
LayerZero Price Forecast: ZRO shows early signs of sell-off amid steady network demand
بواسطة Vishal Dixit
تاريخ النشر: 30 Jan 2026 | تاريخ التعديل: 30 Jan 2026


المقالات الشائعة

LayerZero (ZRO) is under pressure from the broader cryptocurrency market sell-off, recording a 7% loss at press time on Friday. The cross-chain messaging layer retains on-chain and retail demand, as network users and transactions hold steady amid increasing capital inflows into ZRO futures.
- LayerZero drops below $2, down 7% so far on Friday, risking a bearish shift in momentum.
- Derivatives data indicate bullish positioning by confident investors, boosting capital inflows into ZRO futures.
- On-chain data show consistent network usage, evading the spot market sell-off.
LayerZero (ZRO) is under pressure from the broader cryptocurrency market sell-off, recording a 7% loss at press time on Friday. The cross-chain messaging layer retains on-chain and retail demand, as network users and transactions hold steady amid increasing capital inflows into ZRO futures. However, the technical outlook for ZRO remains mixed, with the 200-day Exponential Moving Average (EMA) serving as a key support level.
LayerZero’s consistent demand amid volatile crypto market
LayerZero maintains steady demand as a blockchain interoperability protocol, while the broader crypto market faces outflows from major protocols to exchanges. Dune dashboard data show that LayerZero's all-time fees stand at $99.56 million, approaching the $100 million milestone as of Friday.
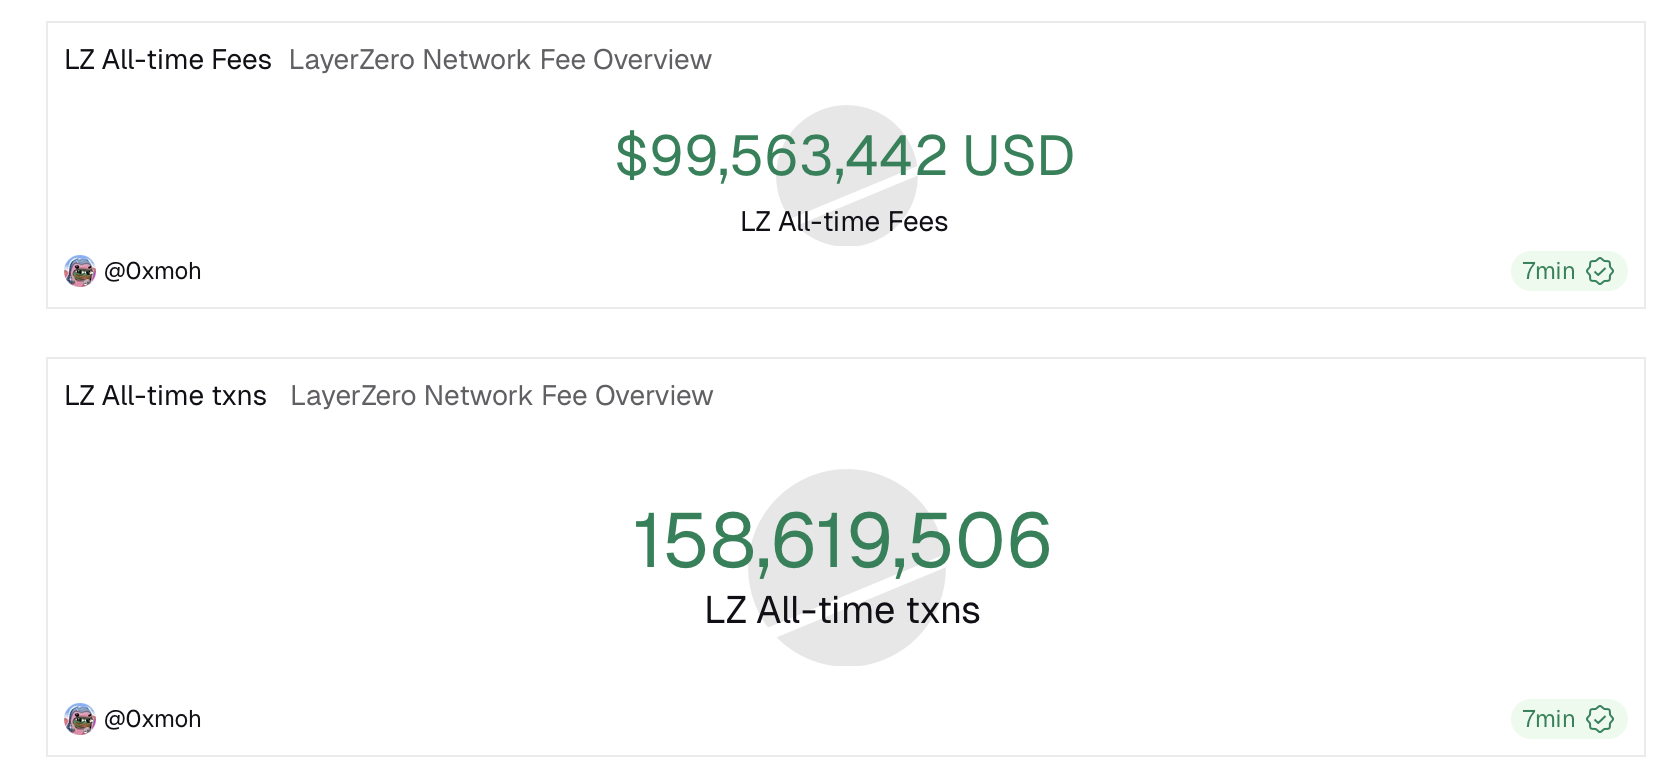
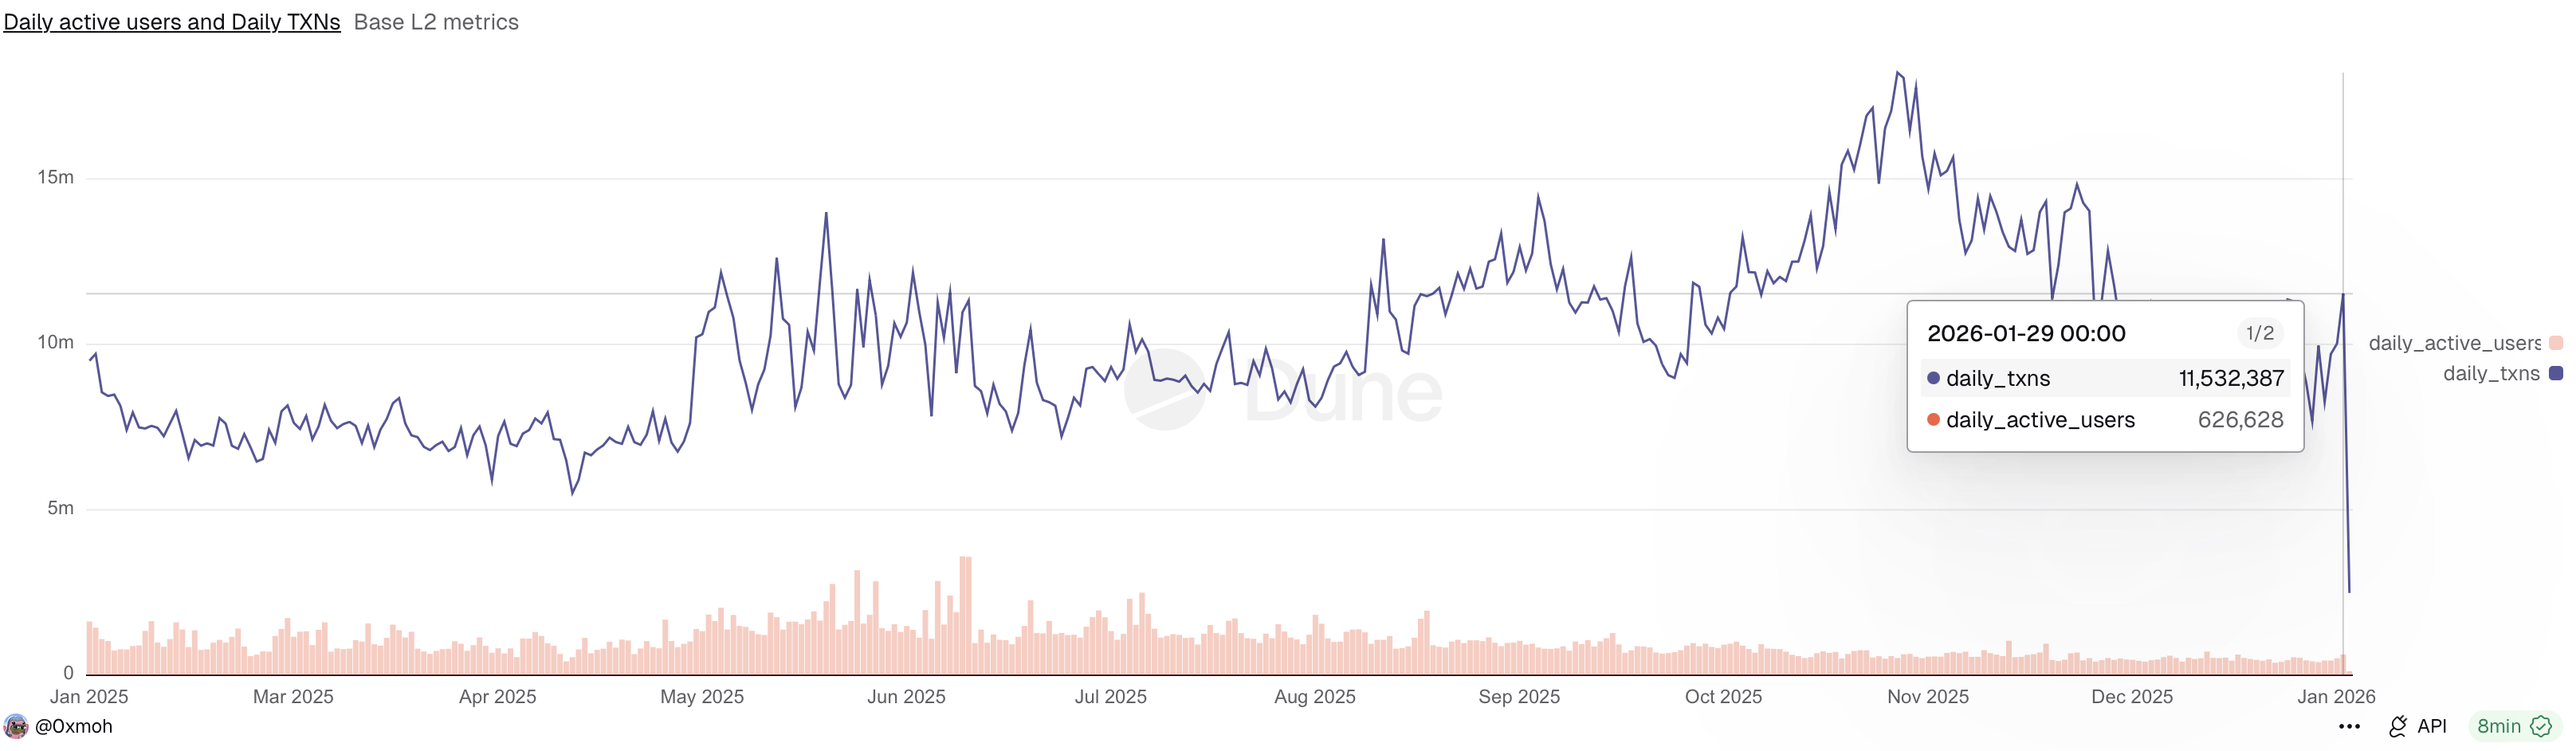
At the same time, daily transactions stood at 11.53 million on Thursday, recovering from 7.68 million last week. Meanwhile, the daily active users trend holds over 500,000, rising to 626,628 on Thursday. Consistent demand over the last month reflects LayerZero’s strengthening network.
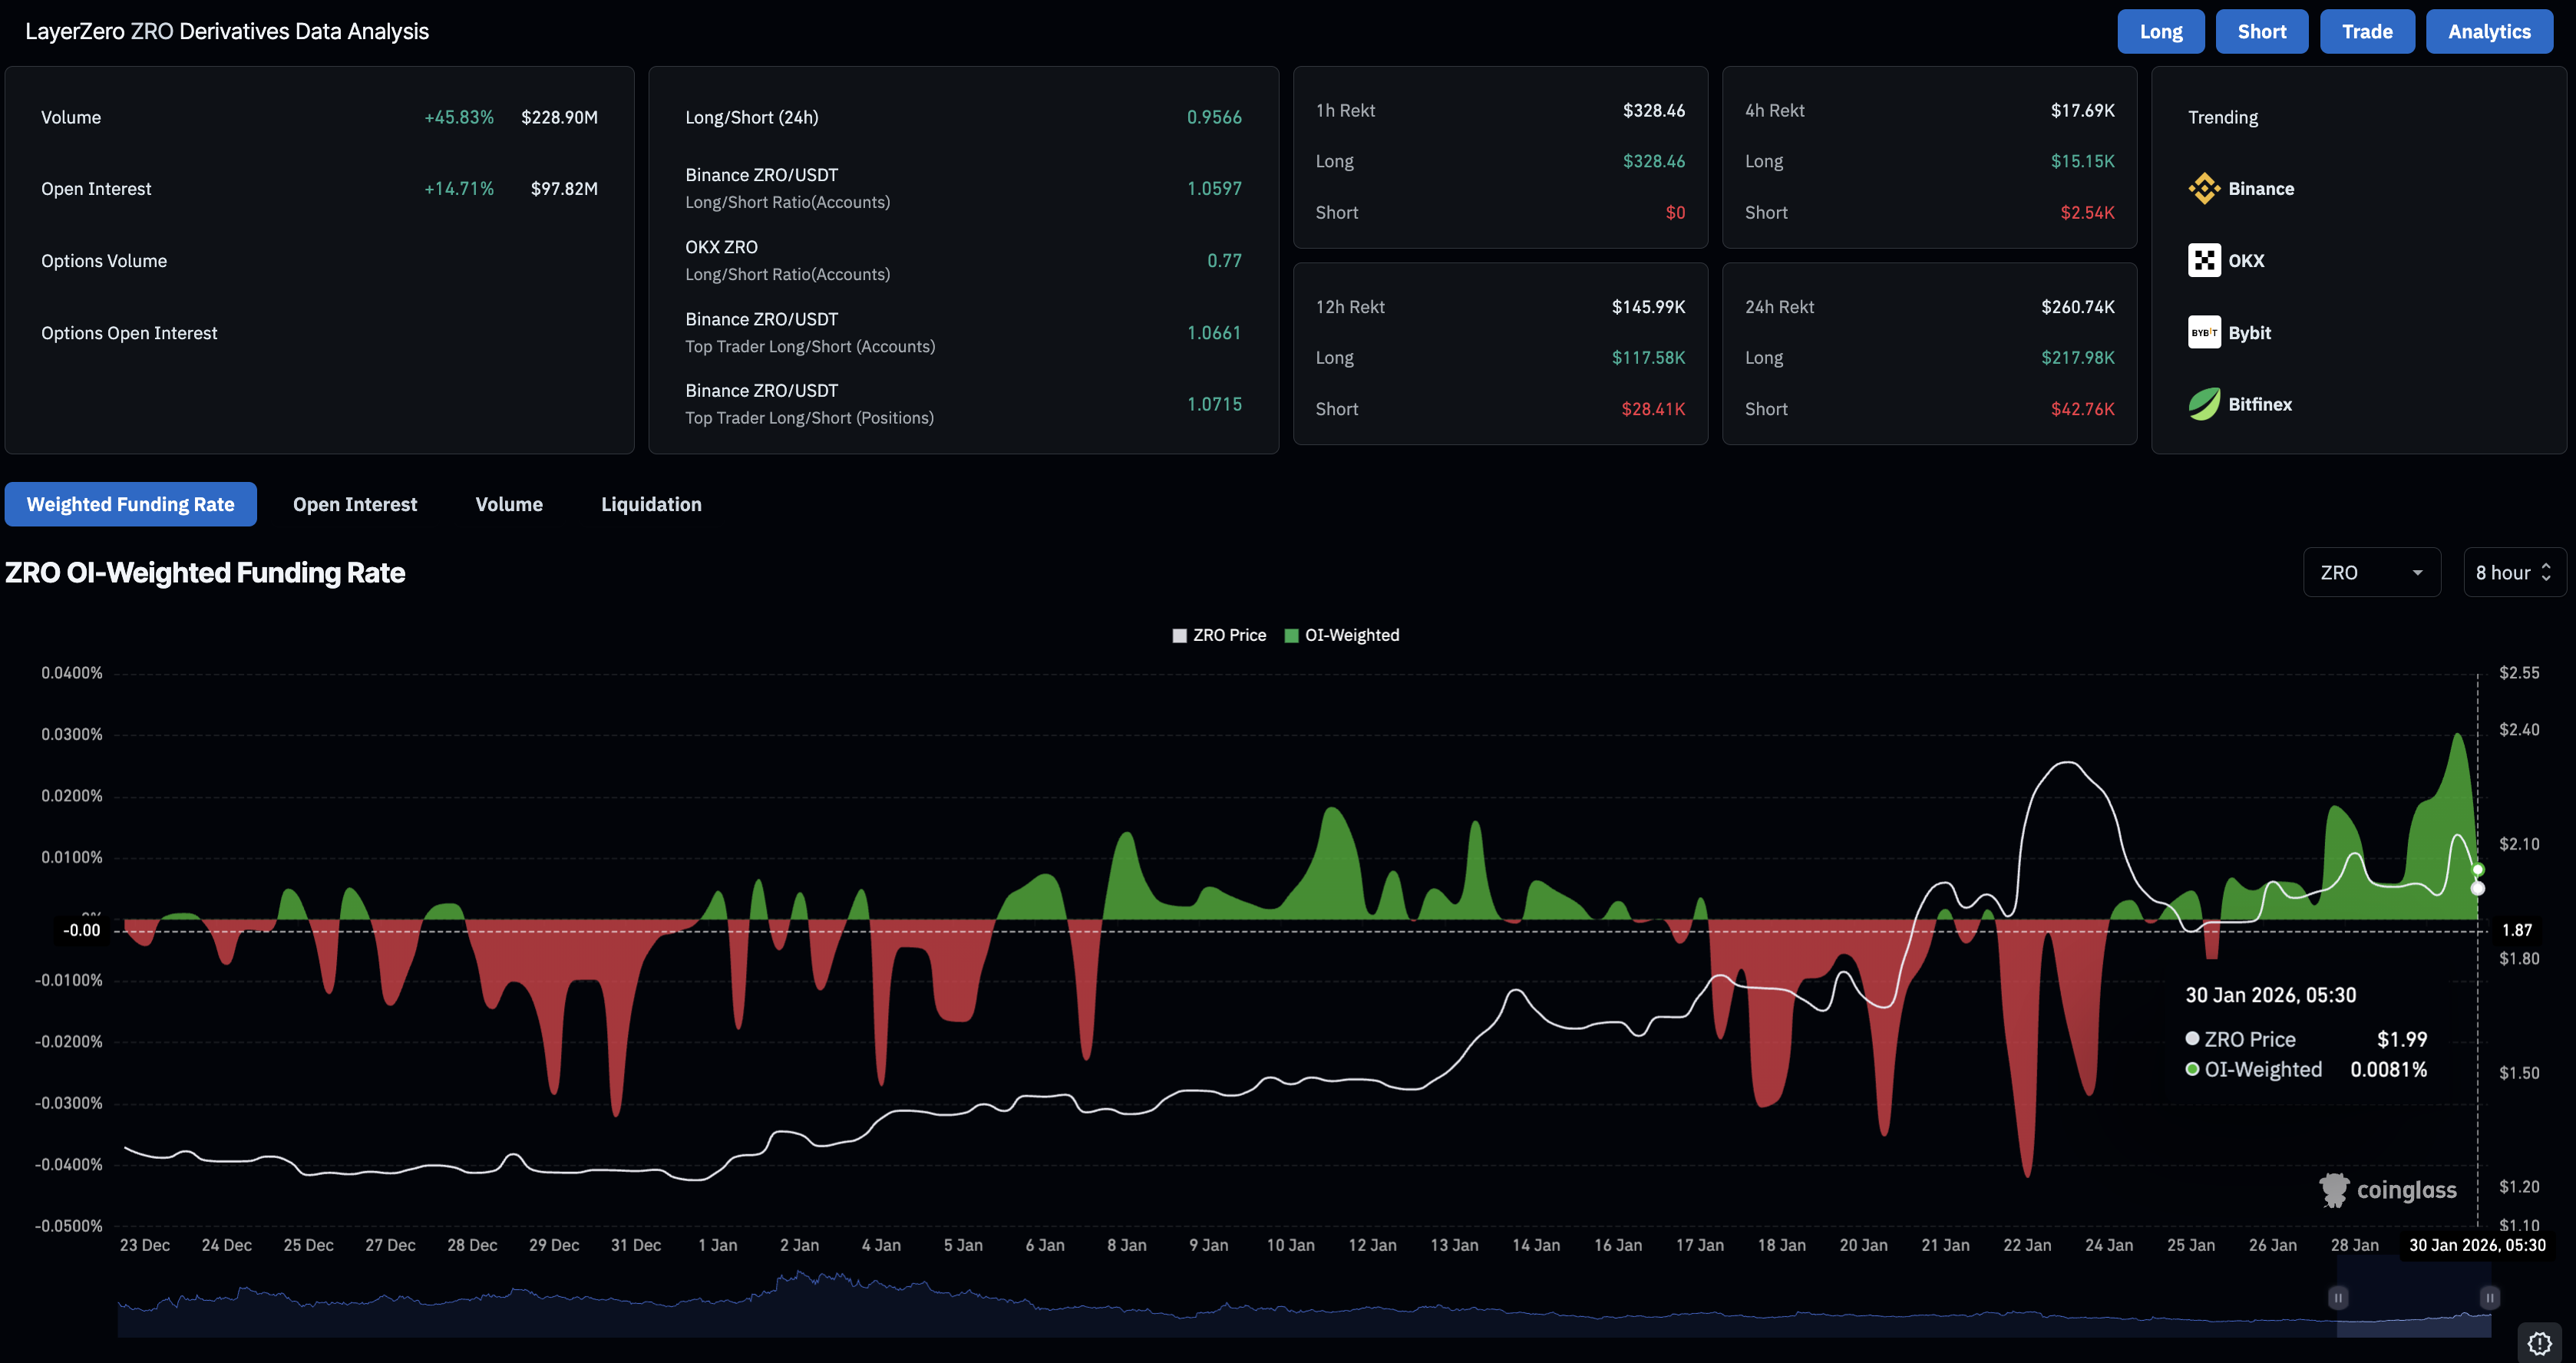
On the derivatives side, LayerZero’s retail strength is increasing, overlooking the broader market correction. CoinGlass data show that the ZRO futures Open Interest (OI) is up 14.71% over the last 24 hours, reaching $97.82 million, indicating a surge in the value of outstanding contracts. At the same time, the OI-weighted funding rate stands at 0.0081%, down from 0.0304% on Thursday, reflecting a reduced but still bullish level of interest among traders.
However, long liquidations of $217,980 outpaced short liquidations of $42,760 over the last 24 hours, indicating a significantly larger bullish positional wipeout.
Technical outlook: Will LayerZero sustain its rally?
LayerZero is 7% down at press time on Friday, eclipsing the 6% gains from the previous day. The pullback crosses below the $2.00 mark, with bears targeting the 200-day EMA at $1.80, implying a downside of roughly 10% from the current price.
However, the 50-day EMA crossing above the 100-day EMA on Tuesday signals a Golden Cross, indicating a short-term bullish bias, consistent with the 60% gains so far this month.
The technical indicators on the daily chart suggest the sell-off could signal an early trend reversal. The Moving Average Convergence Divergence (MACD) drops to the signal line as the green histogram contracts. A potential crossover that yields a red histogram would indicate renewed bearish momentum and trigger a sell signal.
At the same time, the Relative Strength Index (RSI) at 58 is retracing toward the halfway line from the overbought zone, indicating that buying pressure is cooling down.
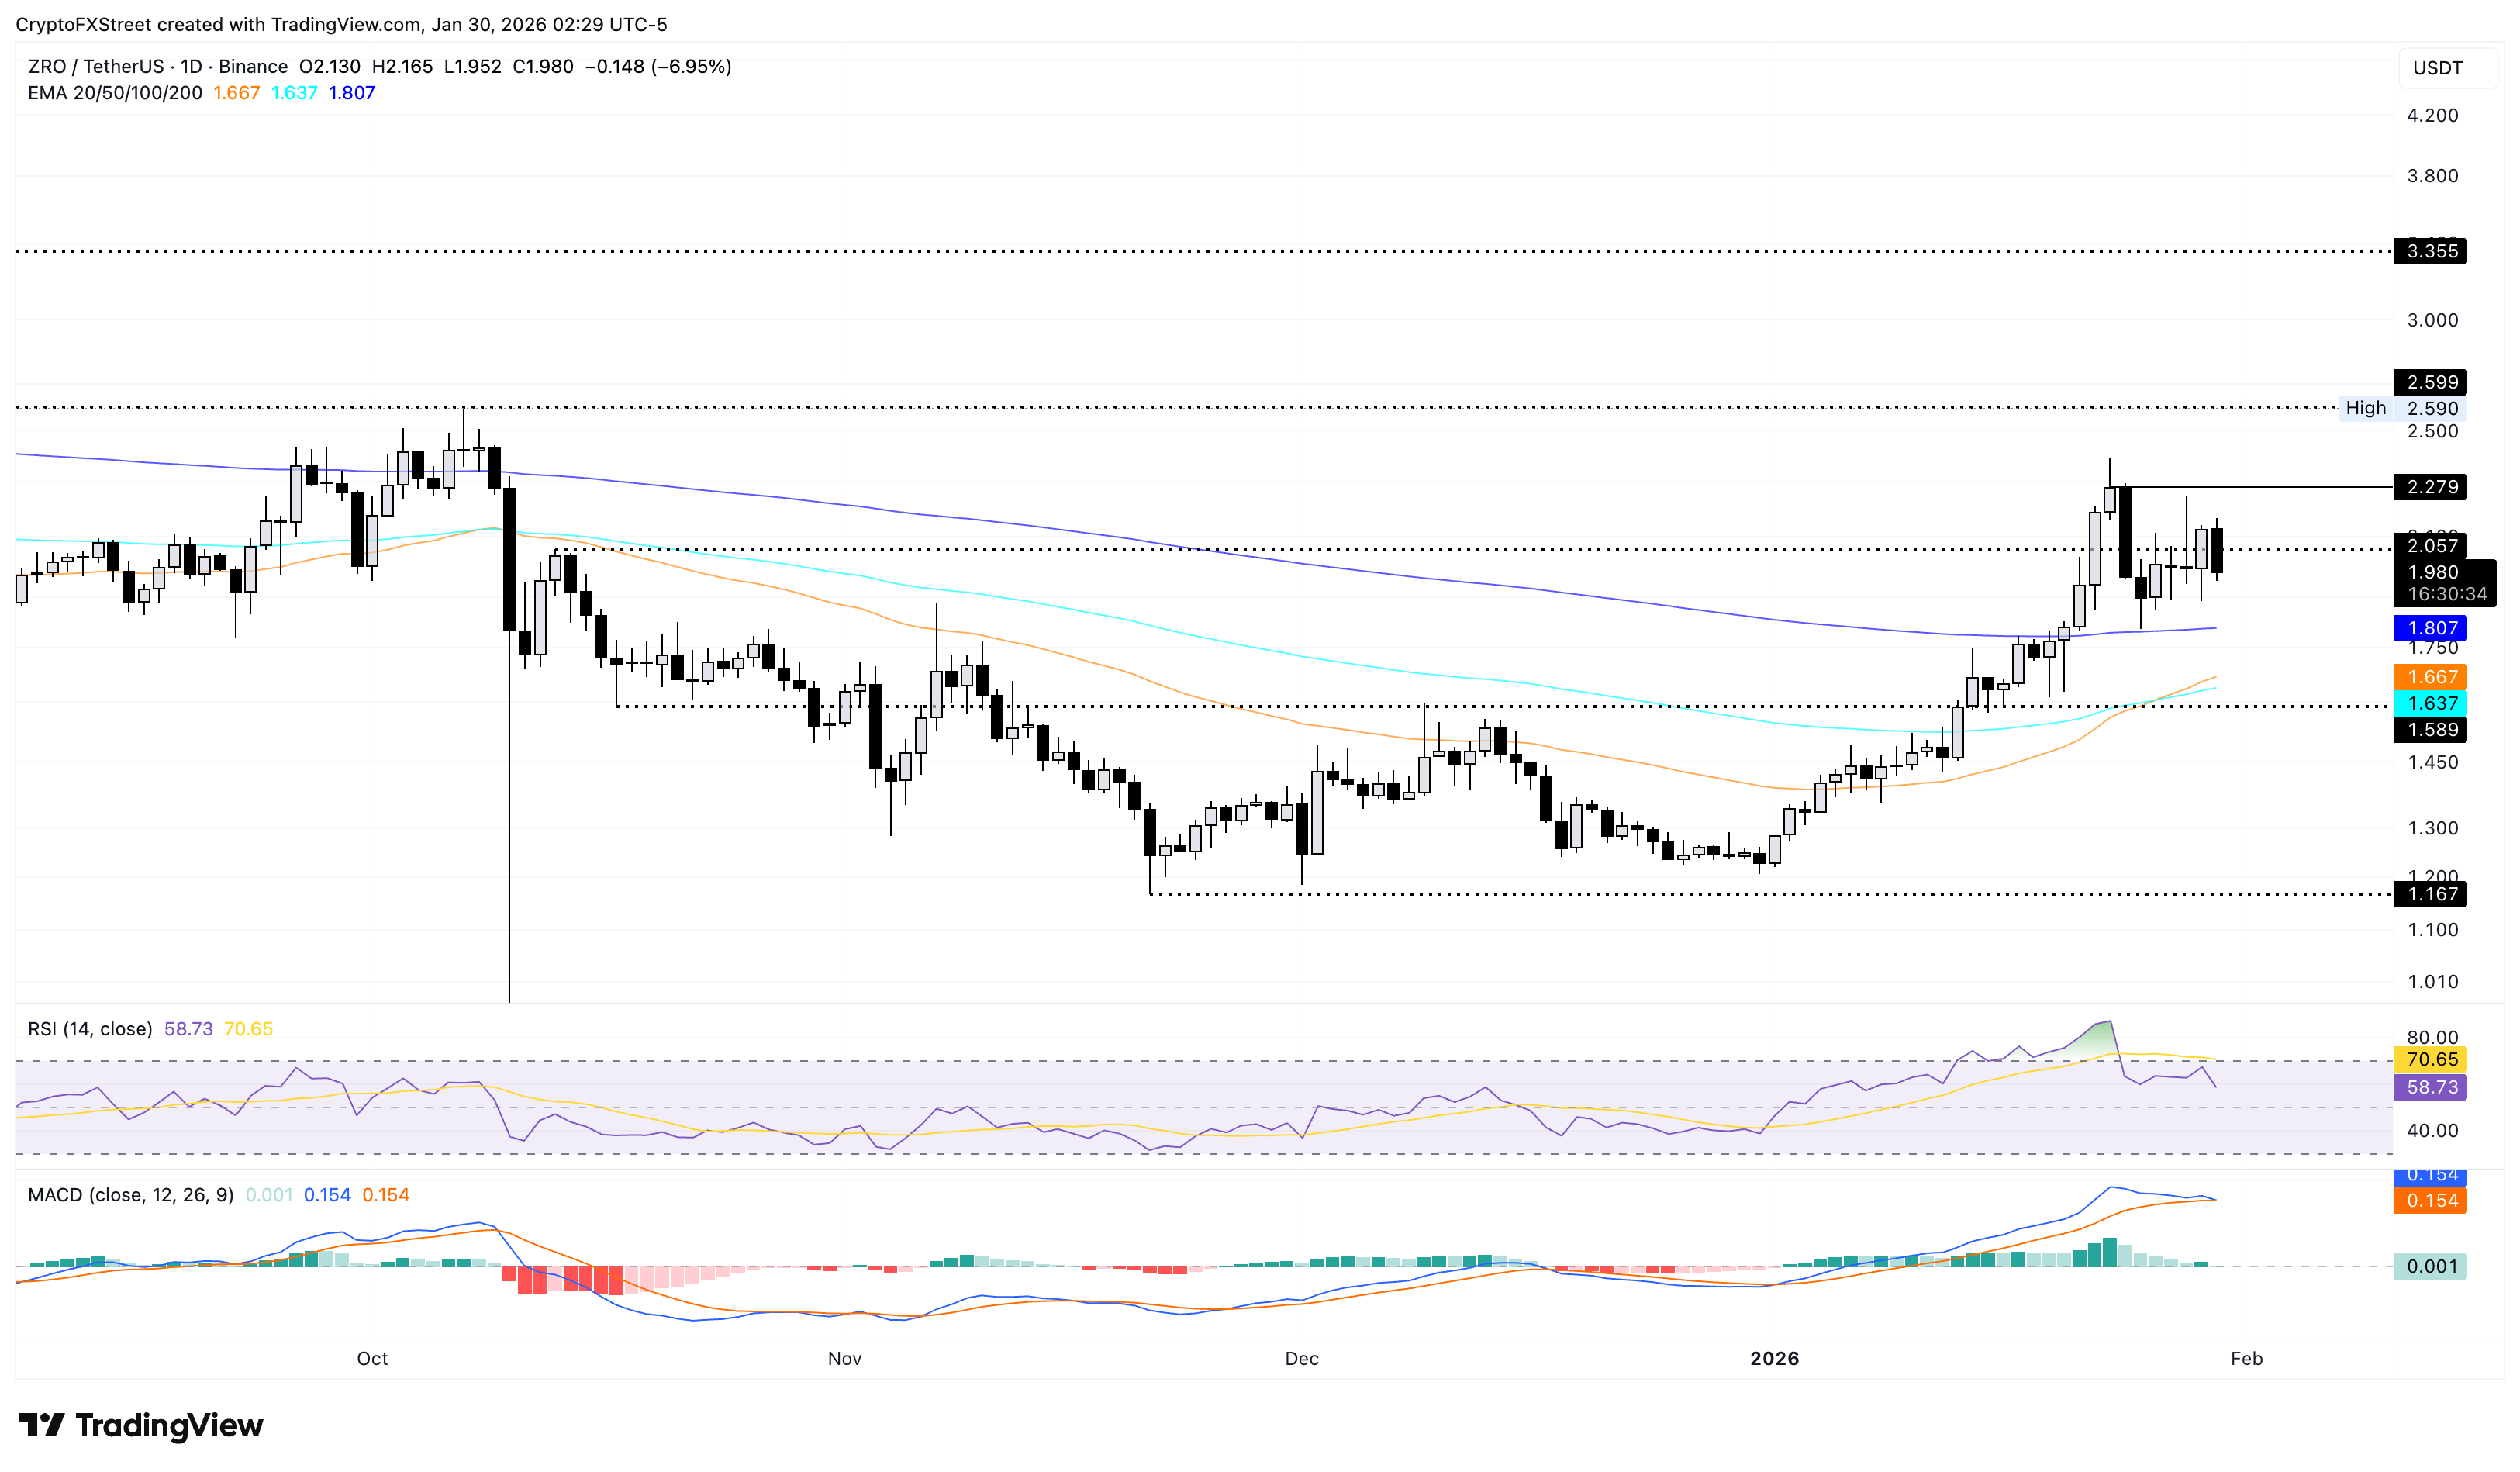
If ZRO sustains a daily close above $2, it would signal an easing of overhead pressure. However, a clear buying opportunity might arise with a daily close above the January 23 close at $2.27, which would open the door to the August 11 high at $2.59.

يعتمد أكثر من مليون مستخدم على FXStreet للحصول على بيانات سوقية لحظية، وأدوات رسوم بيانية، ورؤى خبراء، وأخبار الفوركس. يساعد تقويمهم الاقتصادي الشامل والندوات التعليمية عبر الويب المتداولين على البقاء على اطلاع واتخاذ قرارات محسوبة. لدى FXStreet فريق يضم حوالي 60 محترفًا موزعين بين مقر برشلونة ومناطق عالمية مختلفة.
اقرأ المزيد


