
NZD/USD Price Forecast: Targets 0.6100 near 16-month highs
بواسطة Akhtar Faruqui
تاريخ النشر: 29 Jan 2026 | تاريخ التعديل: 29 Jan 2026


المقالات الشائعة

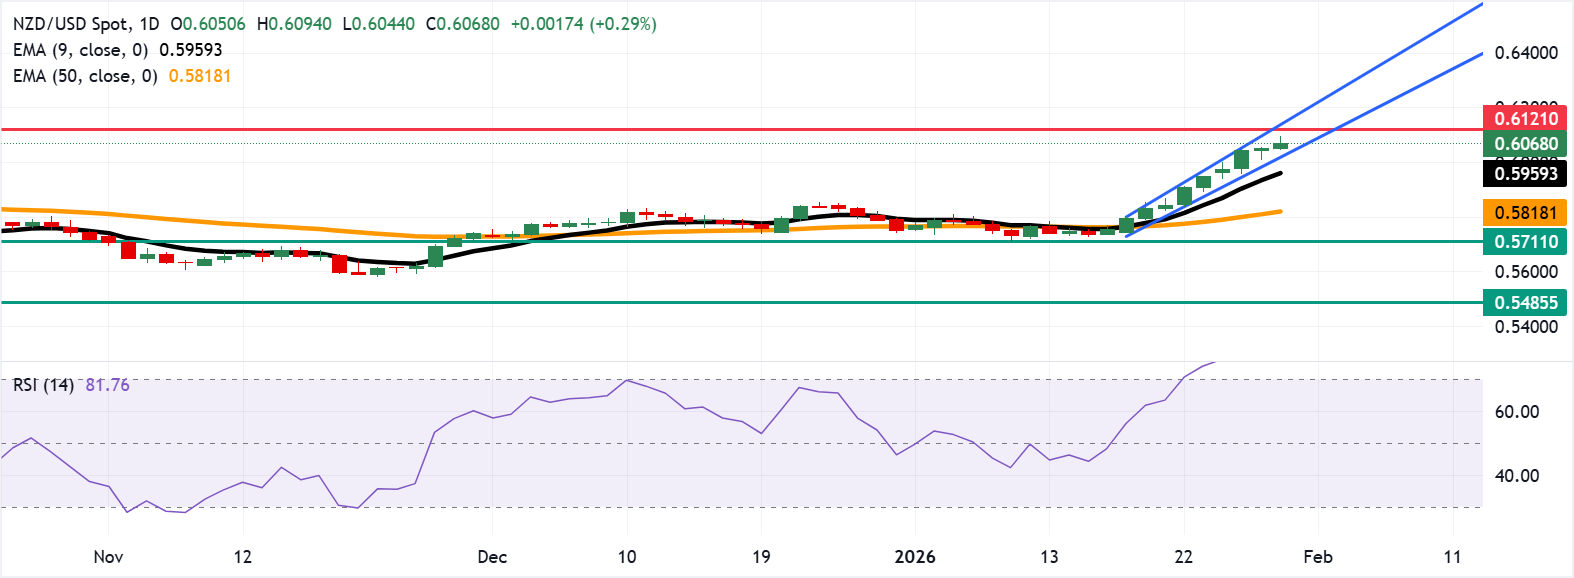
NZD/USD continues its winning streak that began on January 16, trading around 0.6080 during the European hours on Thursday. The technical analysis of the daily chart signals a persistent bullish bias as the pair price rises within the ascending channel pattern.
- NZD/USD may test the 16-month high of 0.6121.
- The 14-day Relative Strength Index at 82 suggests a potential cooling phase before the uptrend resumes.
- Immediate support is seen at the lower ascending channel boundary near 0.6020.
NZD/USD continues its winning streak that began on January 16, trading around 0.6080 during the European hours on Thursday. The technical analysis of the daily chart signals a persistent bullish bias as the pair price rises within the ascending channel pattern.
The NZD/USD pair holds above the nine-day Exponential Moving Average (EMA) and the 50-day EMA, reinforcing a bullish bias. The positive alignment of short- and medium-term averages supports an extension higher. The nine-day EMA continues to rise and maintains clear separation above the 50-day average, keeping the trend on the front foot.
The 14-day Relative Strength Index (RSI) at 82 (overbought) flags stretched conditions that could temper follow-through. RSI remains overbought, so a cooling phase could unfold before the trend resumes.
The NZD/USD pair may target the 16-month high of 0.6121, which was recorded in July 2025, followed by the upper boundary of the ascending channel around 0.6150. A break above this confluence resistance zone would expose the psychological level of 0.6200 as a barrier.
On the downside, the immediate support lies at the lower ascending channel boundary around 0.6020, followed by the nine-day EMA at 0.5961. A break below would weaken the short-term price momentum and put downward pressure on the NZD/USD pair to test the 50-day EMA at 0.5818.
(The technical analysis of this story was written with the help of an AI tool.)
New Zealand Dollar Price Today
The table below shows the percentage change of New Zealand Dollar (NZD) against listed major currencies today. New Zealand Dollar was the strongest against the Japanese Yen.
| USD | EUR | GBP | JPY | CAD | AUD | NZD | CHF | |
|---|---|---|---|---|---|---|---|---|
| USD | -0.18% | -0.18% | 0.03% | -0.22% | -0.44% | -0.26% | -0.24% | |
| EUR | 0.18% | -0.00% | 0.20% | -0.04% | -0.26% | -0.08% | -0.07% | |
| GBP | 0.18% | 0.00% | 0.21% | -0.04% | -0.28% | -0.10% | -0.06% | |
| JPY | -0.03% | -0.20% | -0.21% | -0.26% | -0.48% | -0.32% | -0.28% | |
| CAD | 0.22% | 0.04% | 0.04% | 0.26% | -0.22% | -0.05% | -0.02% | |
| AUD | 0.44% | 0.26% | 0.28% | 0.48% | 0.22% | 0.18% | 0.21% | |
| NZD | 0.26% | 0.08% | 0.10% | 0.32% | 0.05% | -0.18% | 0.02% | |
| CHF | 0.24% | 0.07% | 0.06% | 0.28% | 0.02% | -0.21% | -0.02% |
The heat map shows percentage changes of major currencies against each other. The base currency is picked from the left column, while the quote currency is picked from the top row. For example, if you pick the New Zealand Dollar from the left column and move along the horizontal line to the US Dollar, the percentage change displayed in the box will represent NZD (base)/USD (quote).

يعتمد أكثر من مليون مستخدم على FXStreet للحصول على بيانات سوقية لحظية، وأدوات رسوم بيانية، ورؤى خبراء، وأخبار الفوركس. يساعد تقويمهم الاقتصادي الشامل والندوات التعليمية عبر الويب المتداولين على البقاء على اطلاع واتخاذ قرارات محسوبة. لدى FXStreet فريق يضم حوالي 60 محترفًا موزعين بين مقر برشلونة ومناطق عالمية مختلفة.
اقرأ المزيد


