
Pepe Price Forecast: PEPE extends rebound as broader market risk-on mood lifts retail activity
بواسطة Vishal Dixit
تم التحديث: 22 Apr 2026


المقالات الشائعة

Pepe (PEPE) is trading in the green at press time on Wednesday, edging higher for the third consecutive day. The frog-themed meme coin regains retail strength amid a boost in the broader market sentiment.
- Pepe extends gains on Wednesday, stretching its rebound from the 50-day EMA.
- Derivatives data shows heightened retail activity as risk-on sentiment returns to market.
- PEPE must exceed a descending trendline near $0.00000400 to extend its recovery.
Pepe (PEPE) is trading in the green at press time on Wednesday, edging higher for the third consecutive day. The frog-themed meme coin regains retail strength amid a boost in the broader market sentiment. The technical outlook for Pepe is cautiously bullish as the price tests the breakout of a key resistance trendline.
Pepe gains traction as broader market downside pressure eases
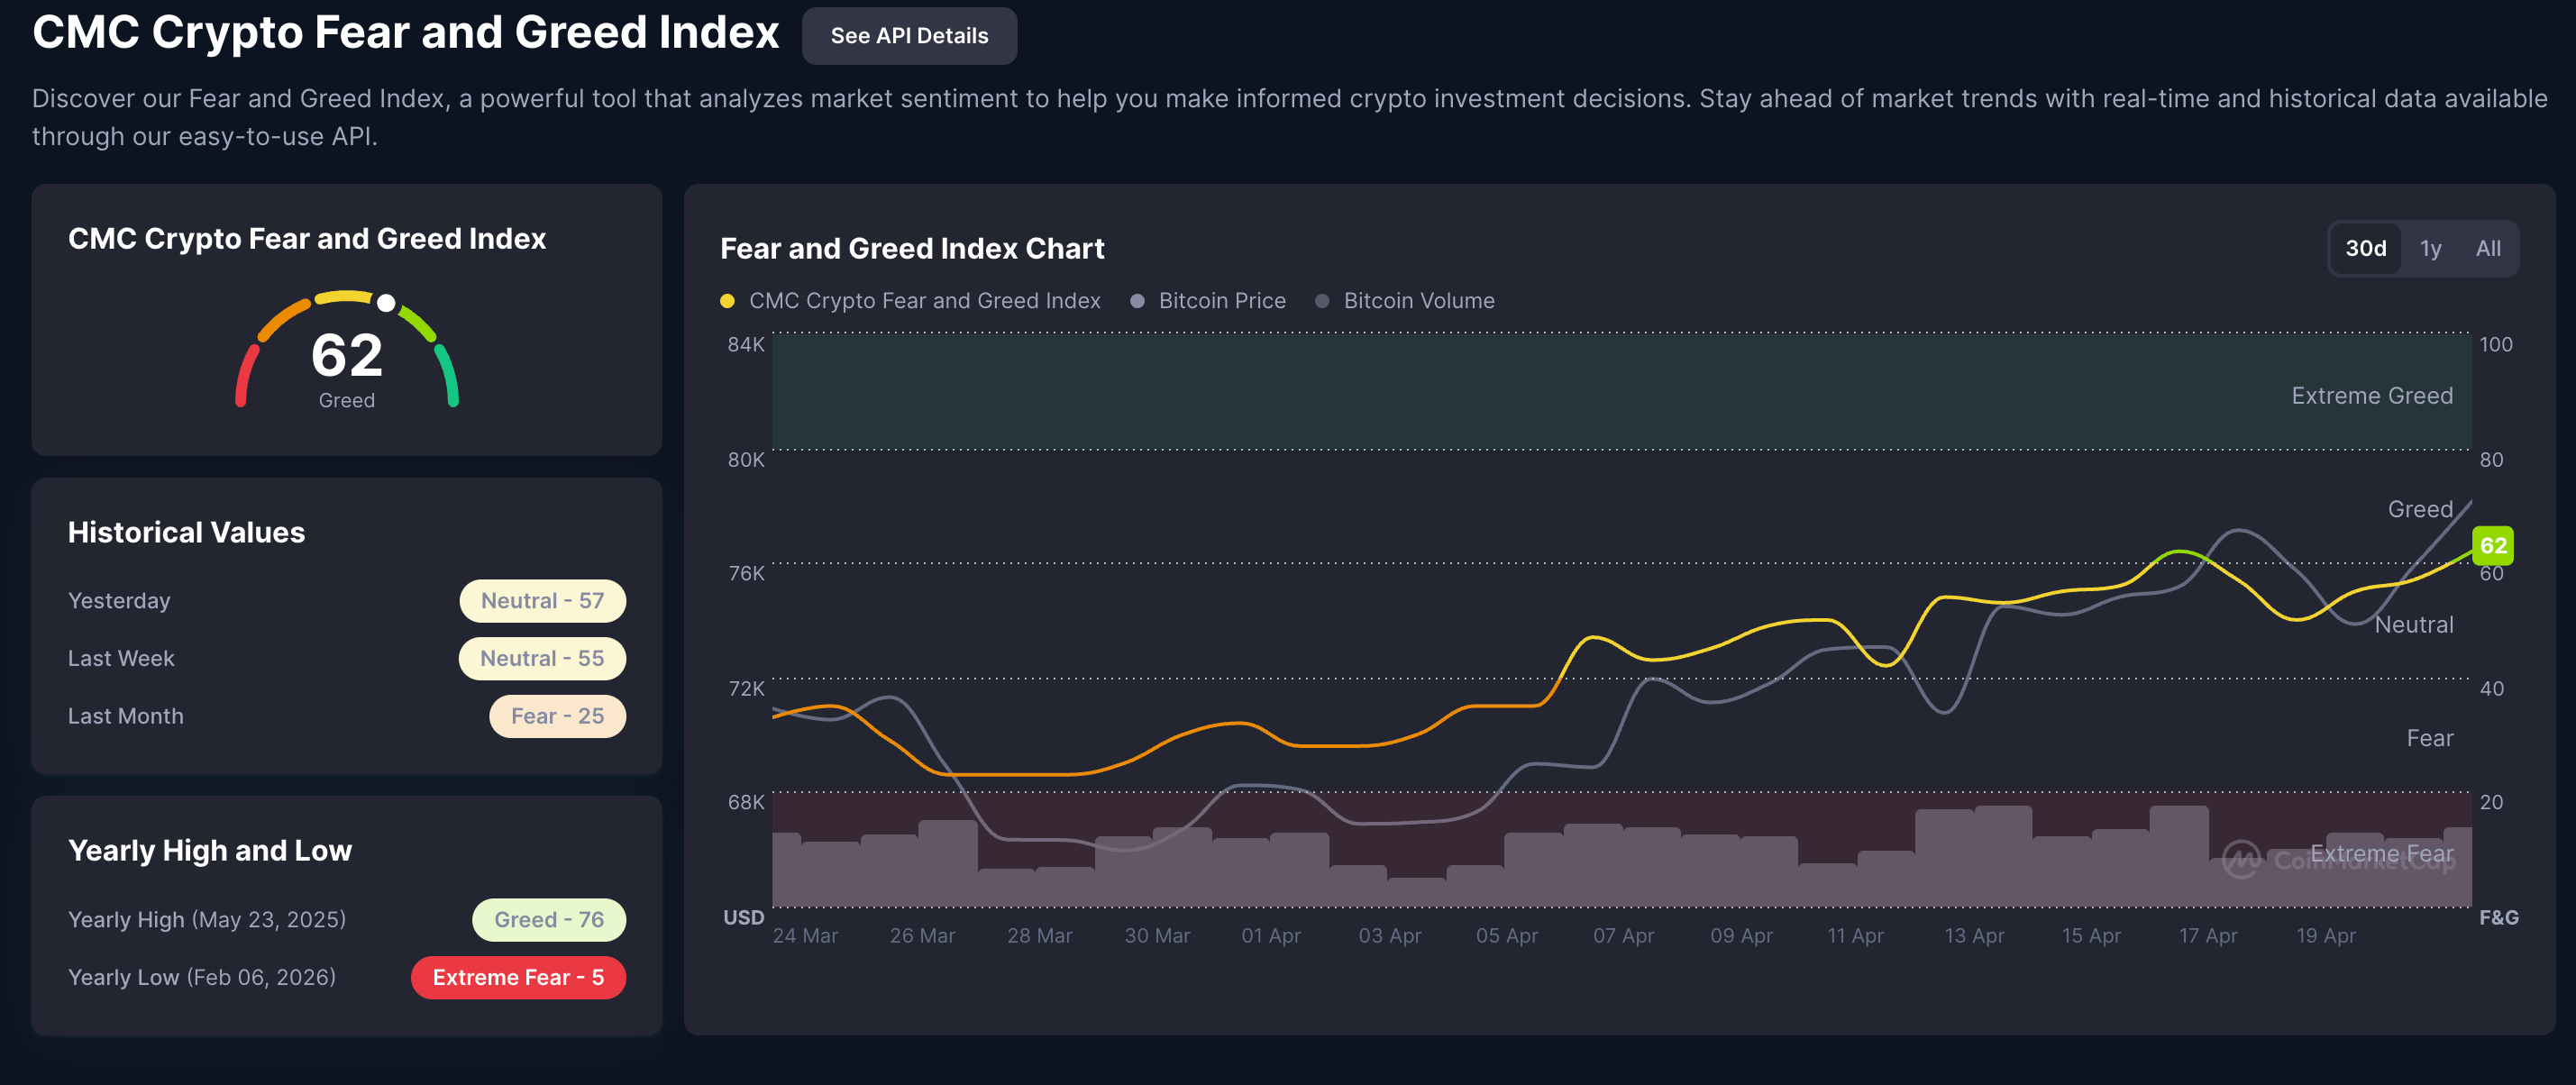
A boost in the broader market, despite the ongoing US-Iran blockade of the Strait of Hormuz and faltering peace talks, lifts retail demand for meme coins. CoinMarketCap data shows the Fear and Greed Index at 62 on Wednesday, with a steady rise seen in risk appetite since the US-Iran ceasefire announcement.
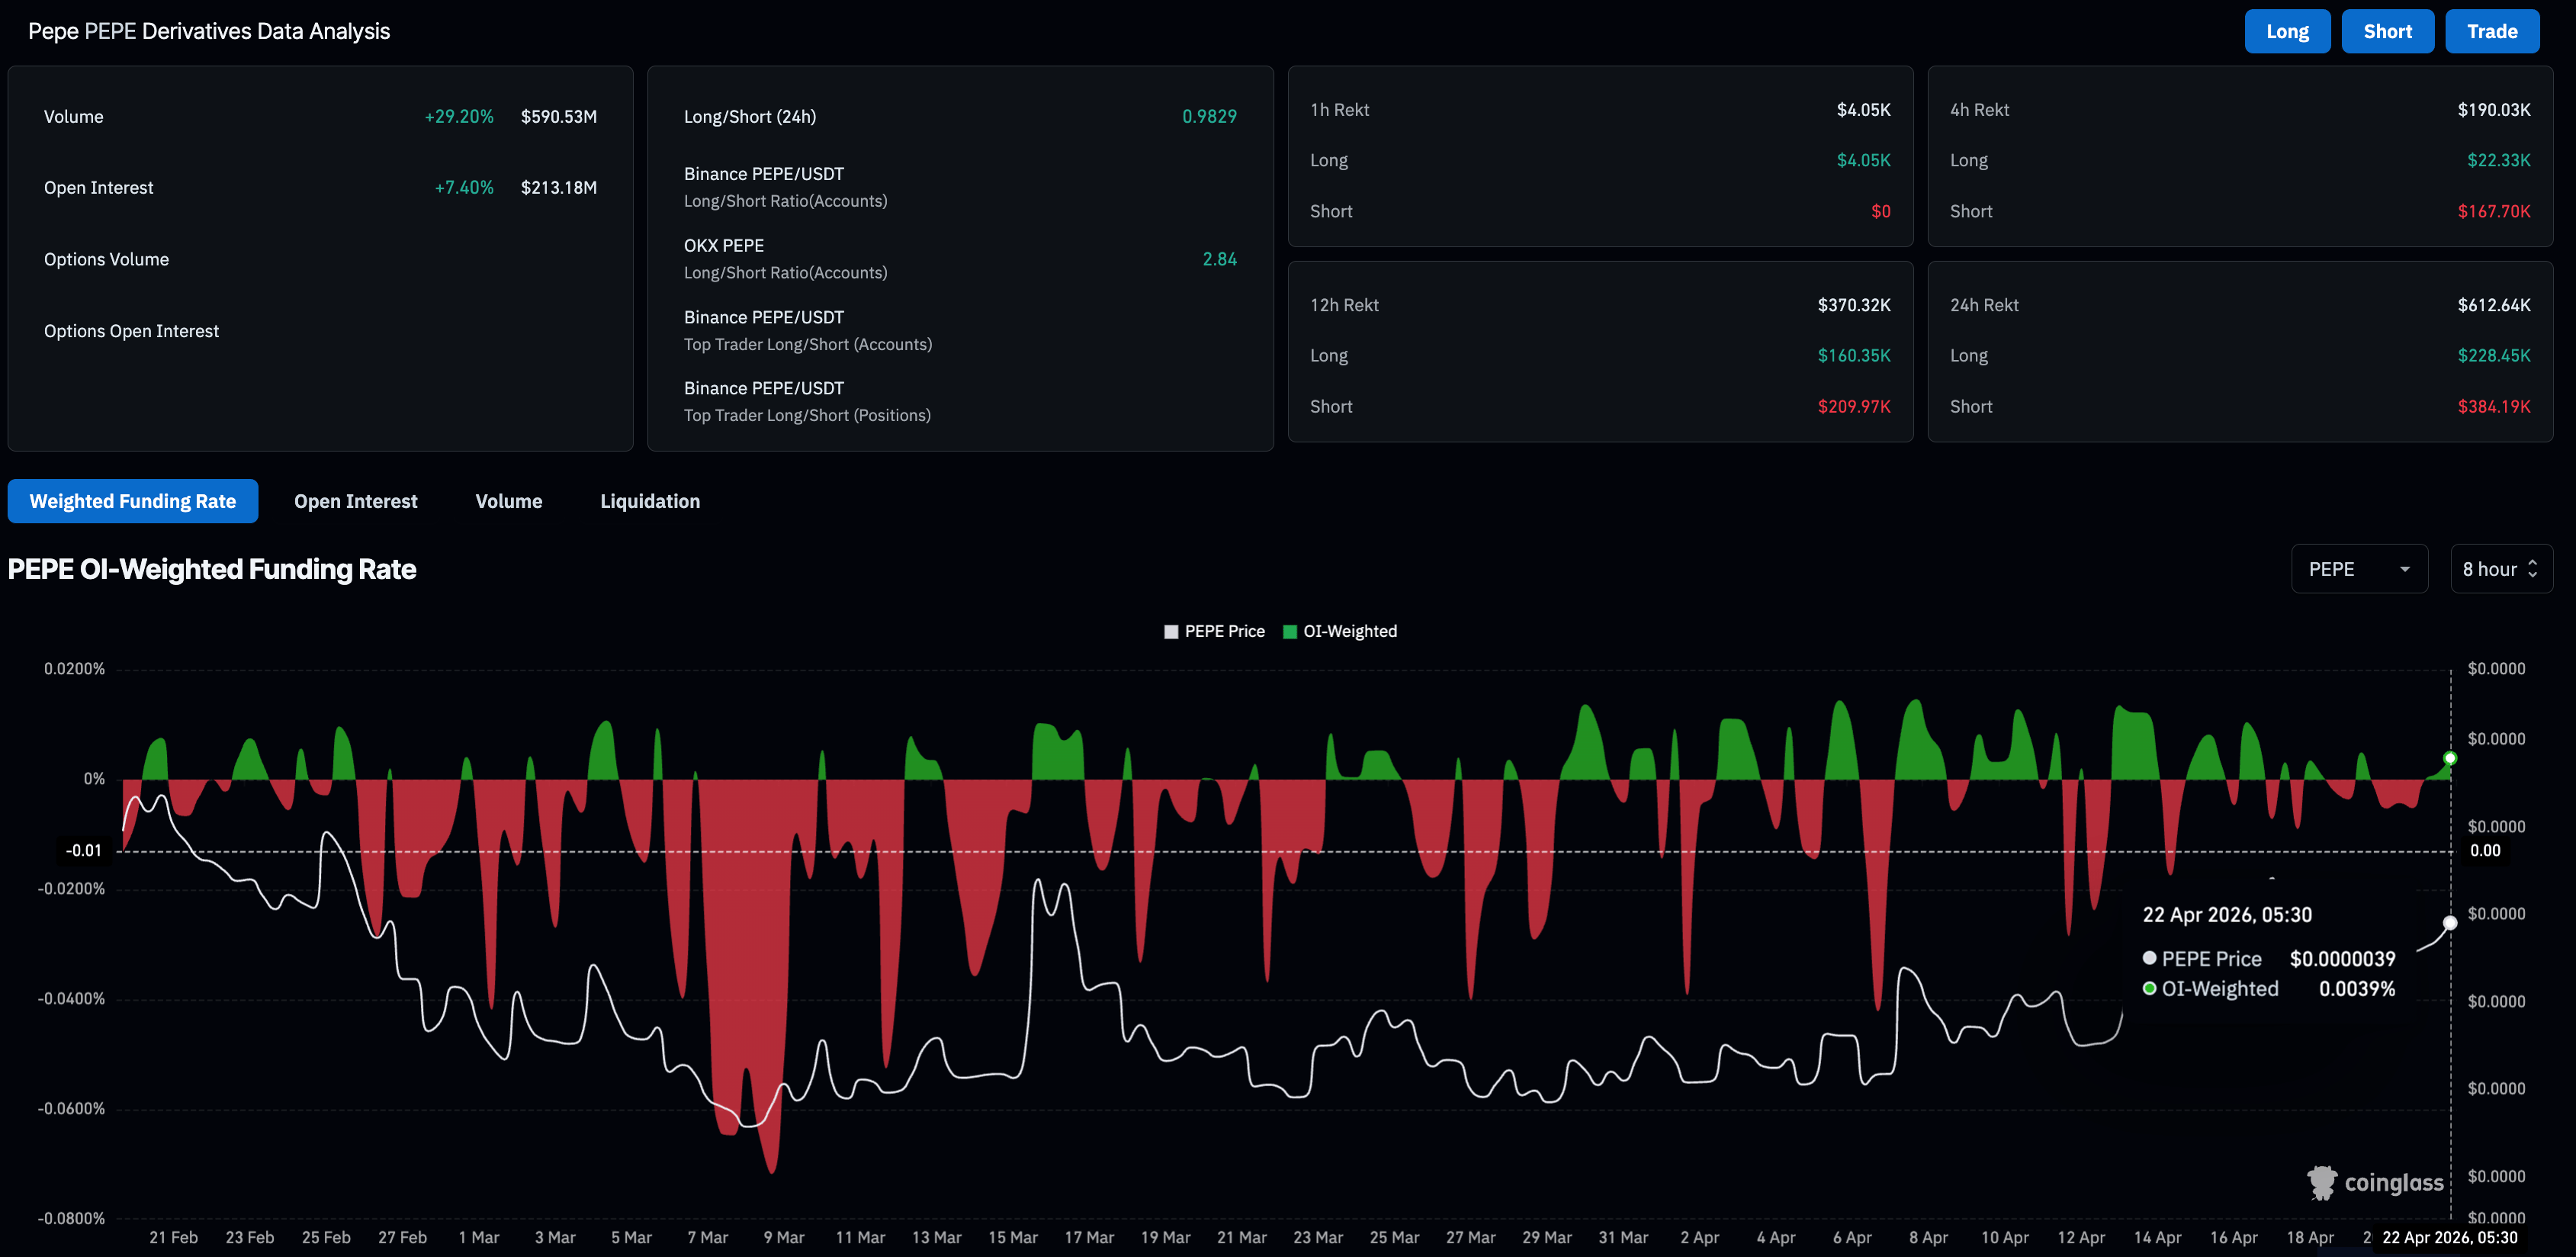
On the derivatives side, the PEPE futures Open Interest (OI) stands at $213.18 million with over 7% gains in the last 24 hours, suggesting an increase in the notional value of outstanding positions. Typically, a surge in traders' participation aligning with a spot price recovery indicates bullish anticipation.
Pepe tests key resistance breakout
Pepe shows a short-term recovery in action with a three-day rebound from the 50-day Exponential Moving Average (EMA) at $0.00000368 so far this week. However, the declining 100-day and 200-day EMAs alongside a mapped downward resistance trendline, connecting the January 5 and April 17 high, project a broader bearish trend.
The Relative Strength Index (RSI) at 58 edges higher from the midline on the daily chart, hinting at mildly positive momentum. Meanwhile, the Moving Average Convergence Divergence (MACD) extends higher above its signal line, keeping the histogram bars positive.
To extend its recovery, PEPE must surpass its descending trendline near $0.00000400 close to the 100-day EMA at $0.00000404. A break above this zone could unlock a rally toward the 200-day EMA around the $0.00000500 psychological mark.
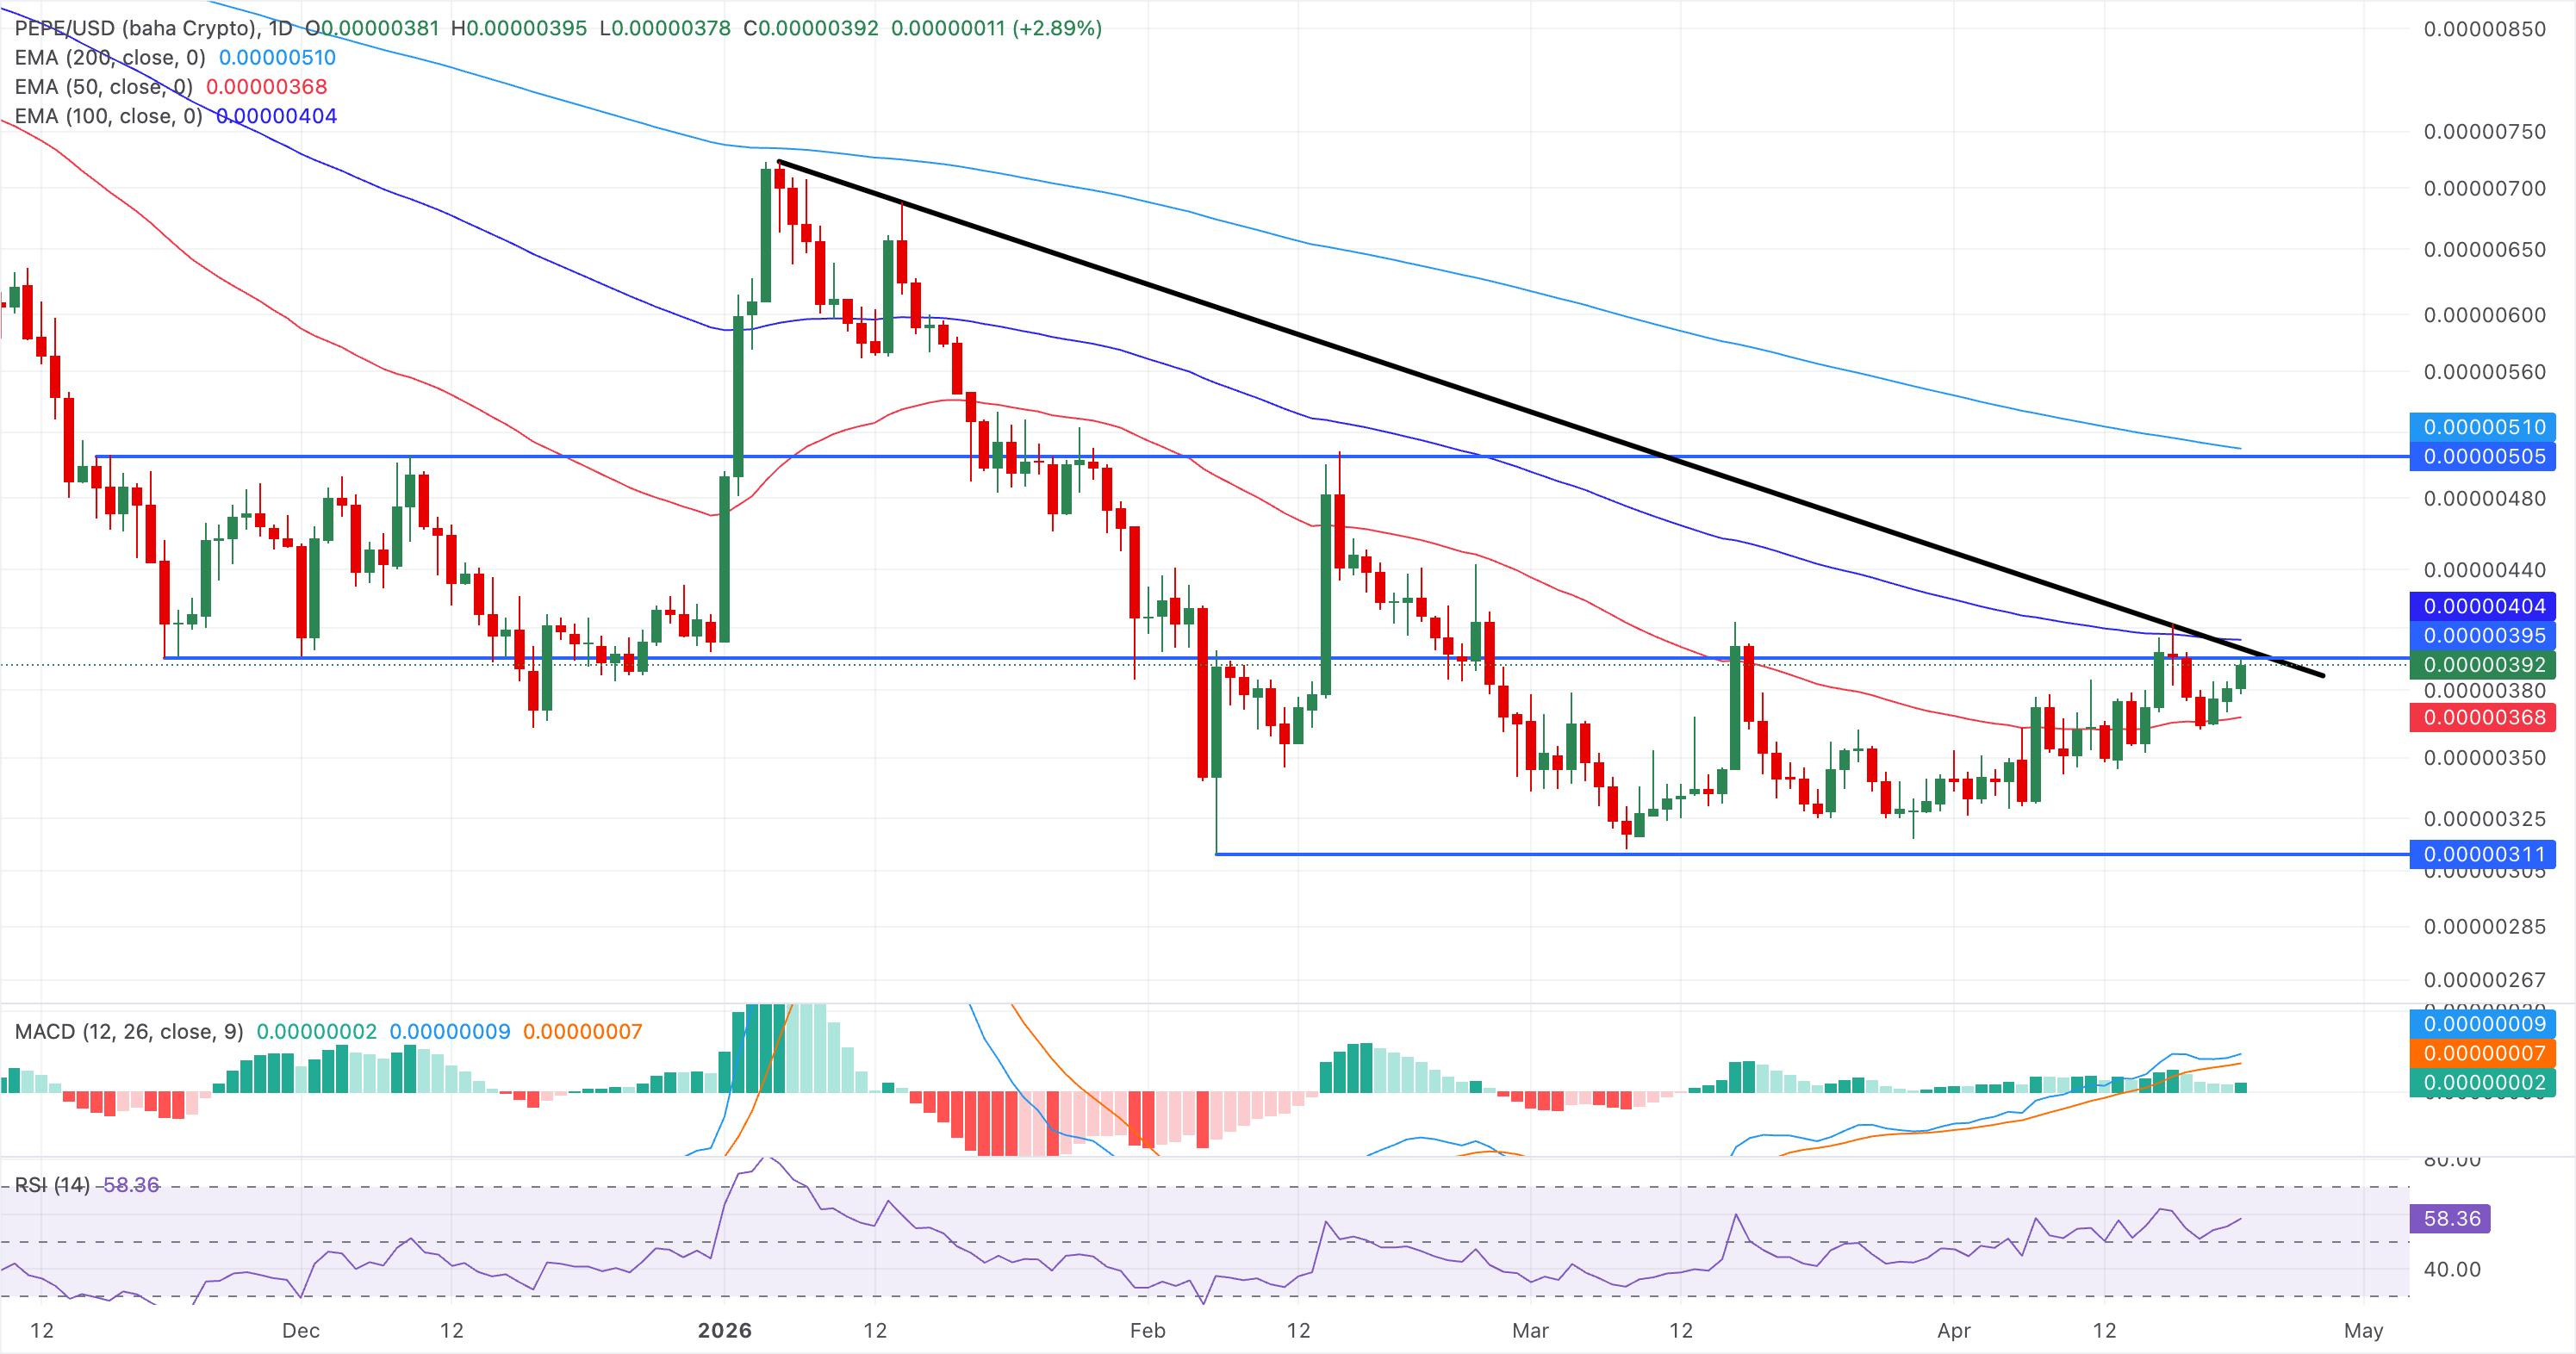
Looking down, the 50-day EMA at $0.00000368 serves as the immediate dynamic support, guarding the downside to the February 6 low at $0.00000311.
(The technical analysis of this story was written with the help of an AI tool.)

يعتمد أكثر من مليون مستخدم على FXStreet للحصول على بيانات سوقية لحظية، وأدوات رسوم بيانية، ورؤى خبراء، وأخبار الفوركس. يساعد تقويمهم الاقتصادي الشامل والندوات التعليمية عبر الويب المتداولين على البقاء على اطلاع واتخاذ قرارات محسوبة. لدى FXStreet فريق يضم حوالي 60 محترفًا موزعين بين مقر برشلونة ومناطق عالمية مختلفة.
اقرأ المزيد


