
Pi Network Price Forecast: Bulls hold ground at key support amid second migration
بواسطة Vishal Dixit
تم التحديث: 30 Mar 2026


المقالات الشائعة

Pi Network (PI) recovers over 2% at press time on Monday, holding above a key support level despite the ongoing US-Iran war weighing down on the broader cryptocurrency market.
- Pi Network is up roughly 2% at press time on Monday, marking a potential bullish start to the week.
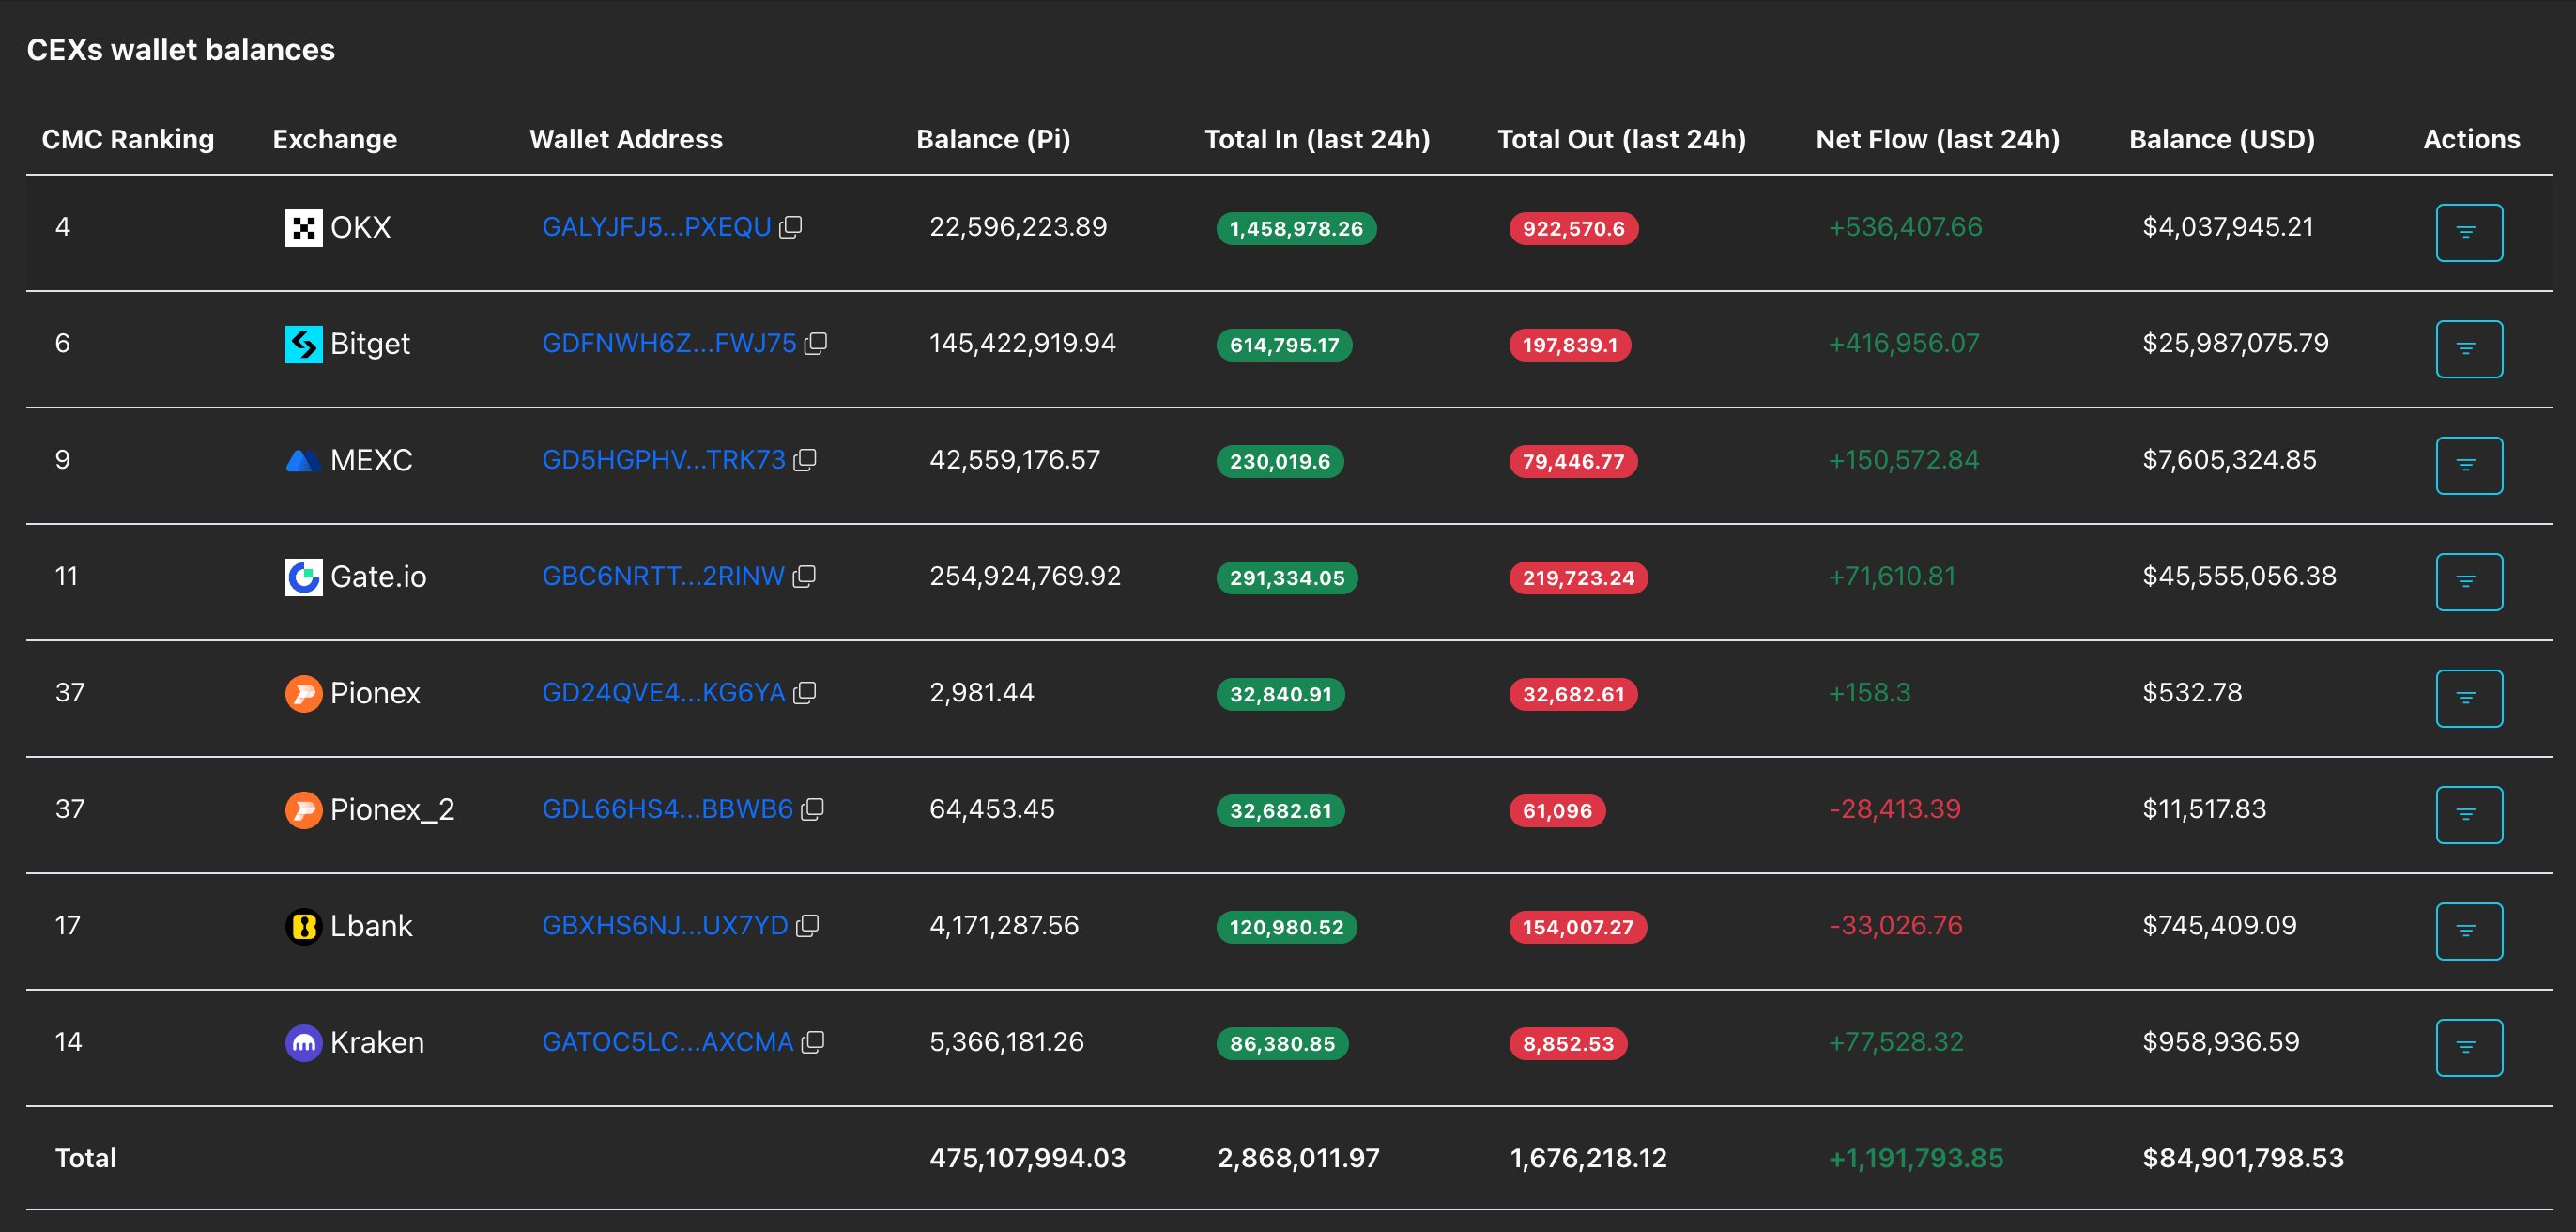
- PiScan data shows steady deposits on CEXs, over 1 million PI tokens in the last 24 hours, amid the second mainnet migration.
- The technical outlook for PI is mixed, with the near-term support under pressure.
Pi Network (PI) recovers over 2% at press time on Monday, holding above a key support level despite the ongoing US-Iran war weighing down on the broader cryptocurrency market. The second mainnet migration event has triggered steady waves of PI token deposits over Centralized Exchanges (CEXs), testing the resilience of Pi Network. The technical outlook for PI is mixed under these conditions as bulls hold ground around $0.1750.
Pi Network faces downside pressure after the second migration
PiScan data shows an increase of 1.12 million Pi tokens in the CEXs over the last 24 hours, suggesting net deposits by holders. Typically, deposits increase the available supply on exchanges, which weighs down on short-term recoveries. However, in the case of Pi Network, only mainnet users can deposit their PI holdings on CEXs, for which they are selected during the mainnet migration events.
In the second mainnet migration, over 119,000 Pi Network users, commonly referred to as Pioneers, completed their post-KYC transfers.
On the other hand, Pi Network continues on its roadmap to upgrade its network to Protocol 21, which is based on the Stellar blockchain. For this process, the Pi Core Team has announced April 6 as the deadline for all the mainnet nodes.

Technical outlook: Will Pi Network extend its recovery?
Pi Network shows a minor recovery at press time on Monday, holding above the $0.1736 support level. The near-term bias is neutral, with a mild bearish tilt, as spot remains capped below the falling 50-day Exponential Moving Average (EMA) at $0.1872 and well below the 100- and 200-day EMAs.
The Moving Average Convergence Divergence (MACD) line holds just below its signal line and the zero line, while the negative histogram bars are contracting, suggesting fading downside momentum. The Relative Strength Index (RSI) at 45 stays below the 50 midline, reinforcing a lack of bullish conviction and keeping the focus on whether prices can stabilize above nearby $0.1736 support.
On the topside, initial resistance stands at the 50-day EMA at $0.1872, and a daily close above it would open the way toward the 100-day EMA at $0.1953.
Looking down, if the PI token slips below $0.1736, the immediate support would emerge at the February 23 low at $0.1556.
(The technical analysis of this story was written with the help of an AI tool.)

يعتمد أكثر من مليون مستخدم على FXStreet للحصول على بيانات سوقية لحظية، وأدوات رسوم بيانية، ورؤى خبراء، وأخبار الفوركس. يساعد تقويمهم الاقتصادي الشامل والندوات التعليمية عبر الويب المتداولين على البقاء على اطلاع واتخاذ قرارات محسوبة. لدى FXStreet فريق يضم حوالي 60 محترفًا موزعين بين مقر برشلونة ومناطق عالمية مختلفة.
اقرأ المزيد


