
Pi Network Price Forecast: Launchpad upgrades, fading bearish pressure lift recovery prospects
بواسطة Manish Chhetri
تم التحديث: 15 Jun 2026


المقالات الشائعة

Pi Network (PI) began the week on a positive note, trading above $0.1340 on Monday after posting a mild recovery and closing above a key resistance in the previous week.
- Pi Network price trades with a constructive tone on Monday after breaking above the key resistance zone in the previous week.
- The network announced improvements to the Pi launchpad following feedback from more than 478,000 participants.
- The technical outlook suggests a possibility of a short-term recovery as momentum indicators show fading bearish strength.
Pi Network (PI) began the week on a positive note, trading above $0.1340 on Monday after posting a mild recovery and closing above a key resistance in the previous week. The recovery outlook strengthens after Pi Network’s official X account announced improvements to the Pi launchpad following feedback from more than 478,000 participants. Meanwhile, the technical outlook shows early signs of fading bearish momentum, suggesting a continuation of the recovery.
Pi Network expands ecosystem testing
Pi Network’s official X account announced on Saturday that it is making improvements to the Pi launchpad, which was launched on Pi Day 2026.
“The first Launchpad test token attracted over 478,000 participating Pioneers and generated valuable feedback on the Launchpad mechanism. That feedback has now been incorporated into a simpler participation flow, updated Launchpad mechanics, and an improved user experience,” said Pi Network on its X post.
Moreover, a second test token, “SLICE,” is now live on Testnet until Pi2Day on June 28. This helps evaluate whether the updates can achieve these goals and gives Pioneers another chance to learn the new ecosystem token mechanics.
These ongoing developments could support the growth of Pi Network’s ecosystem and improve community engagement, thereby further strengthening investor confidence and sentiment around PI.
Pi Network Price Forecast: Breaks above key resistance
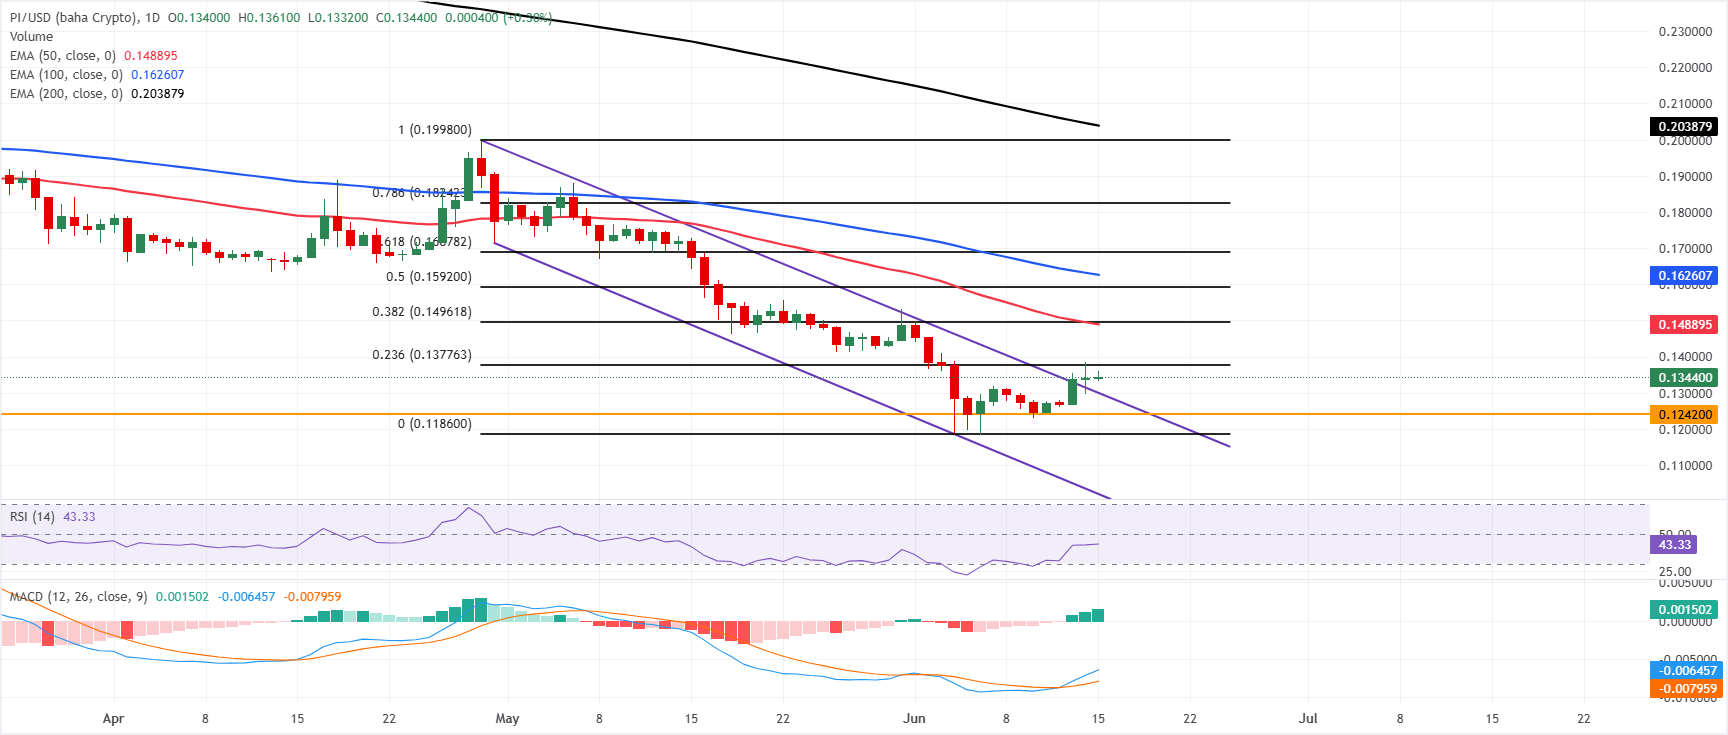
Pi network price trades above $0.1340 on Monday after a mild recovery in the previous week. PI breaks and closes above the descending trendline resistance, supporting a near-term constructive bias. However, the recovery could be capped, as it remains well below the 50-day, 100-day, and 200-day Exponential Moving Averages (EMAs), clustered between roughly $0.150 and $0.200.
Moreover, the failure to reclaim the 23.6% Fibonacci retracement at $0.1378 leaves PI capped on modest rebounds. However, the Relative Strength Index (RSI) near 43 and a slightly positive Moving Average Convergence Divergence (MACD) histogram hint that downside momentum has eased rather than fully reversed.
On the topside, initial resistance comes at the 23.6% Fibonacci retracement at $0.1378, with a tighter supply band forming around the 50-day EMA at $0.1489 and the 38.2% retracement at $0.1496; above that, the 50.0% retracement level at $0.1592 and the 100-day EMA at $0.1626 reinforce a broader corrective ceiling ahead of the 61.8% Fibonacciretracement at $0.1688 and higher retracement/EMA barriers toward $0.180–$0.200.
On the downside, immediate support is seen near the former trendline break at $0.1296, followed by horizontal support at $0.1242. At the same time, a deeper slide would expose the Fibonacci anchor low at $0.1186 as a more critical floor.
(The technical analysis of this story was written with the help of an AI tool.)

يعتمد أكثر من مليون مستخدم على FXStreet للحصول على بيانات سوقية لحظية، وأدوات رسوم بيانية، ورؤى خبراء، وأخبار الفوركس. يساعد تقويمهم الاقتصادي الشامل والندوات التعليمية عبر الويب المتداولين على البقاء على اطلاع واتخاذ قرارات محسوبة. لدى FXStreet فريق يضم حوالي 60 محترفًا موزعين بين مقر برشلونة ومناطق عالمية مختلفة.
اقرأ المزيد


