
Pi Network Price Forecast: PI extends recovery flouting market pressure
بواسطة Vishal Dixit
تاريخ النشر: 16 Feb 2026 | تاريخ التعديل: 16 Feb 2026


المقالات الشائعة

Pi Network (PI) trades above $0.1700 at the time of writing on Monday, testing the 50-day Exponential Moving Average (EMA) at $0.1767.
- Pi Network holds steady near the 50-day EMA at $0.1767 after four consecutive days of recovery.
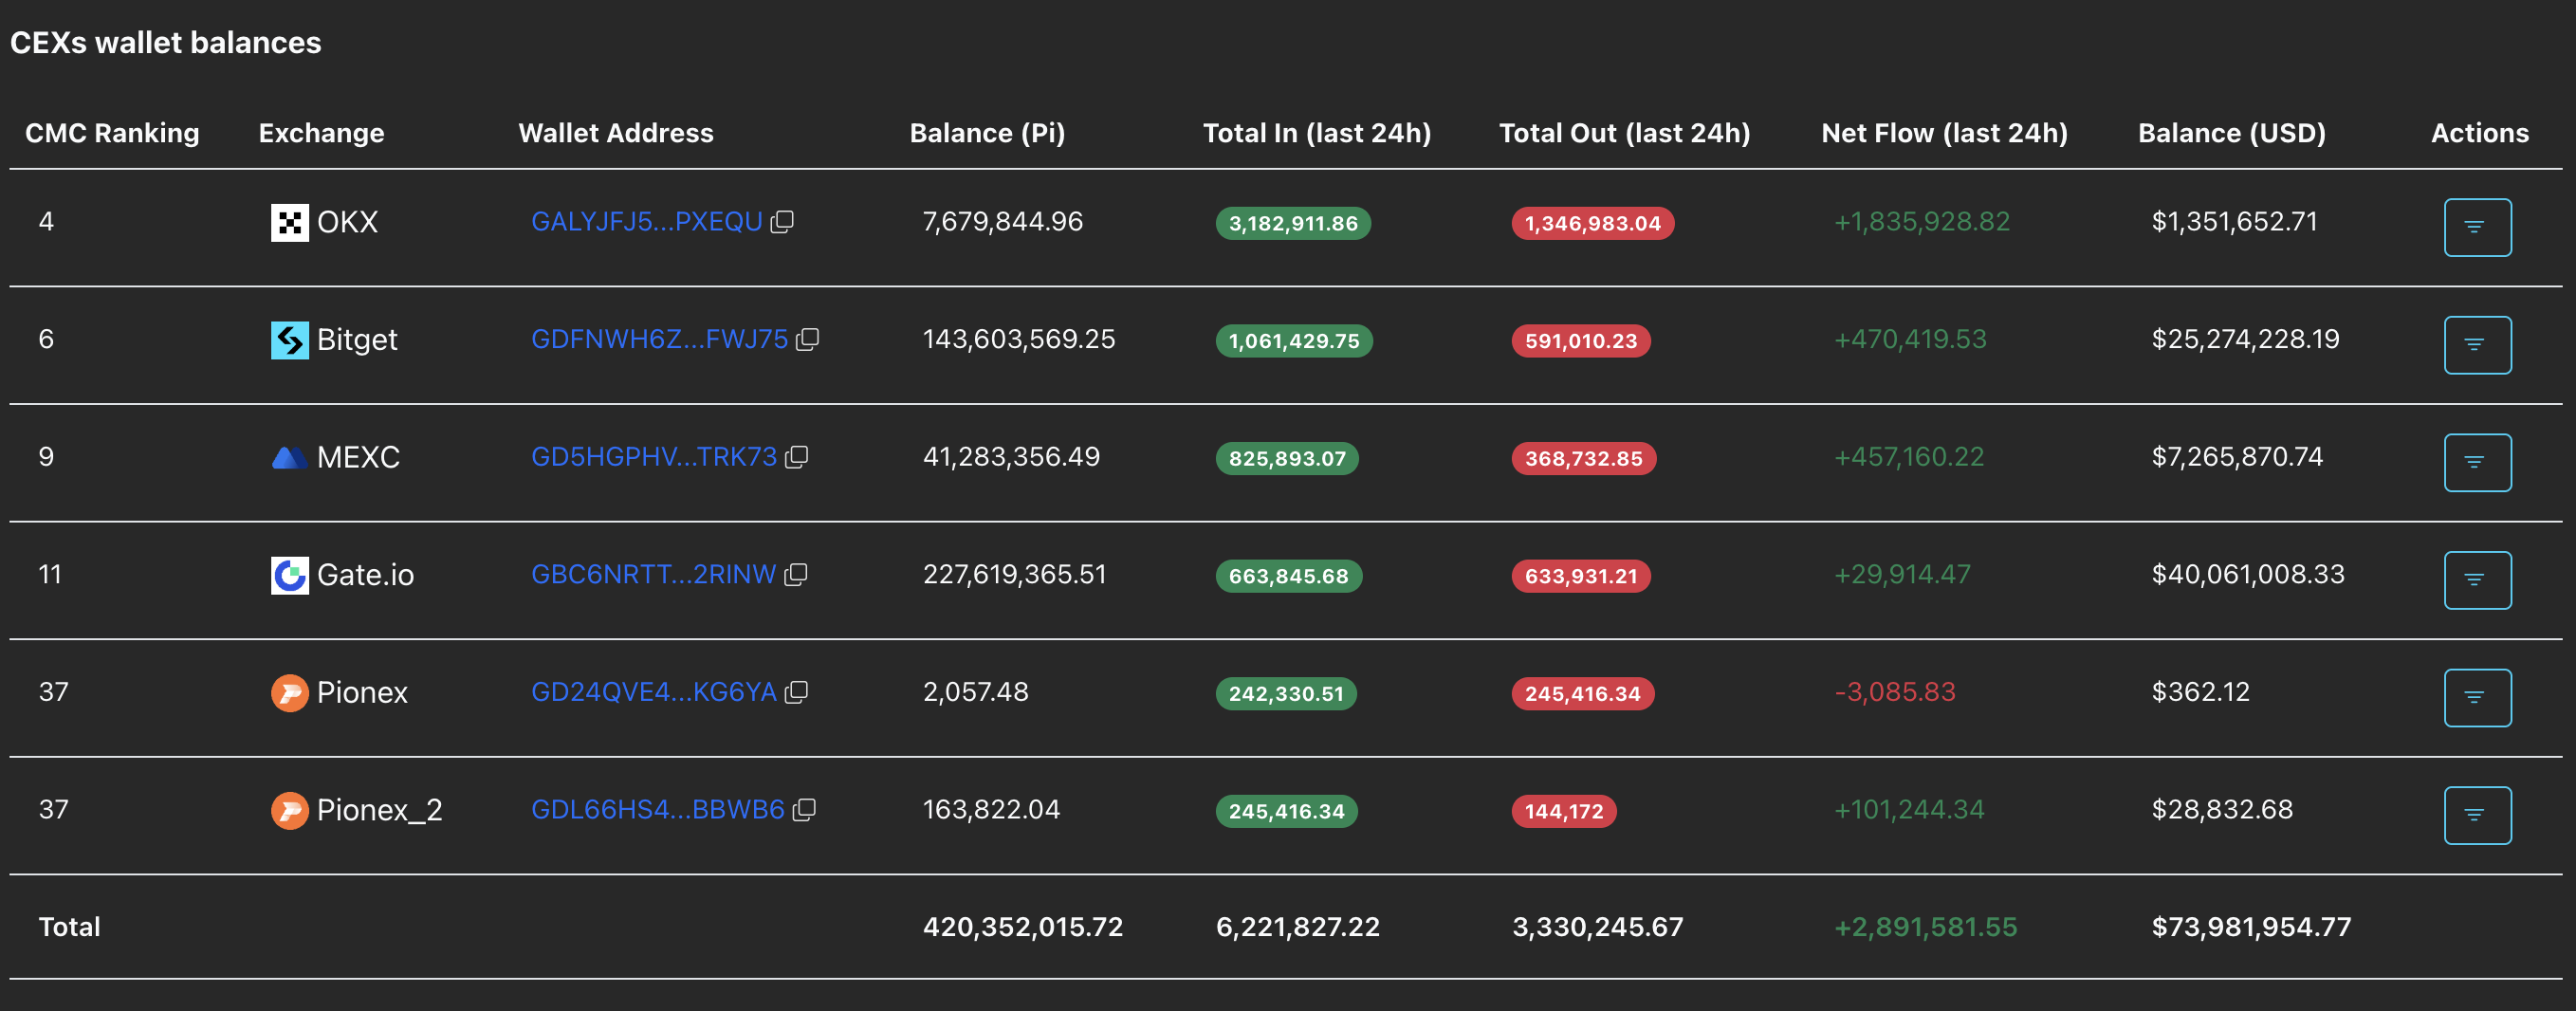
- Massive deposits of roughly 2.90 million PI tokens on CEXs within 24 hours warn of profit-taking.
- The technical outlook focuses on the 50-day EMA as the key resistance level.
Pi Network (PI) trades above $0.1700 at the time of writing on Monday, testing the 50-day Exponential Moving Average (EMA) at $0.1767. Over the last 24 hours, roughly 2.90 million PI tokens were deposited onto Centralized Exchanges (CEXs), suggesting profit-taking by investors following the recent recovery. Technically, the PI token rally is at risk of reversing from the 50-day EMA after the mandatory node upgrade passed on Sunday.
Investors exit after the mainnet node upgrade deadline
Piscan data shows that 2.89 million PI tokens were deposited on Pi Network’s Know Your Business verified (KYB) centralized exchanges over the last 24 hours. Typically, such inflows on exchanges suggest a profit-taking spree among investors capitalizing on the short-term recovery. This sudden decline in investor confidence underscores the risk of a local top, with Pi Network retracing below $0.18 on Sunday after reaching an intraday high of $0.2070.
Technical outlook: Will PI token exceed the 50-day EMA?
Pi Network is trading around $0.1750 at the time of writing, struggling to extend gains above the declining 50-day EMA at $0.1767. The PI token is trading below the 200-day and 50-day EMAs, confirming the prevailing bearish bias.
The short-term PI recovery, aligned with the mandatory node upgrade with a deadline the previous day, is part of the Stellar network's version 22 rollout from version 19. Additionally, Pi Network is experiencing renewed demand ahead of its first-year anniversary of the mainnet launch on February 20.
A decisive close above the 50-day EMA at $0.1767 would confirm a breakout rally, potentially extending it to the $0.20 psychological level.
The technical indicators on the daily chart remain bullish. The Relative Strength Index (RSI) at 57 plateaus above the midline after a sharp increase from the oversold zone. Additionally, the Moving Average Convergence Divergence (MACD) approaches the zero line as positive histograms widen, indicating rising bullish momentum.
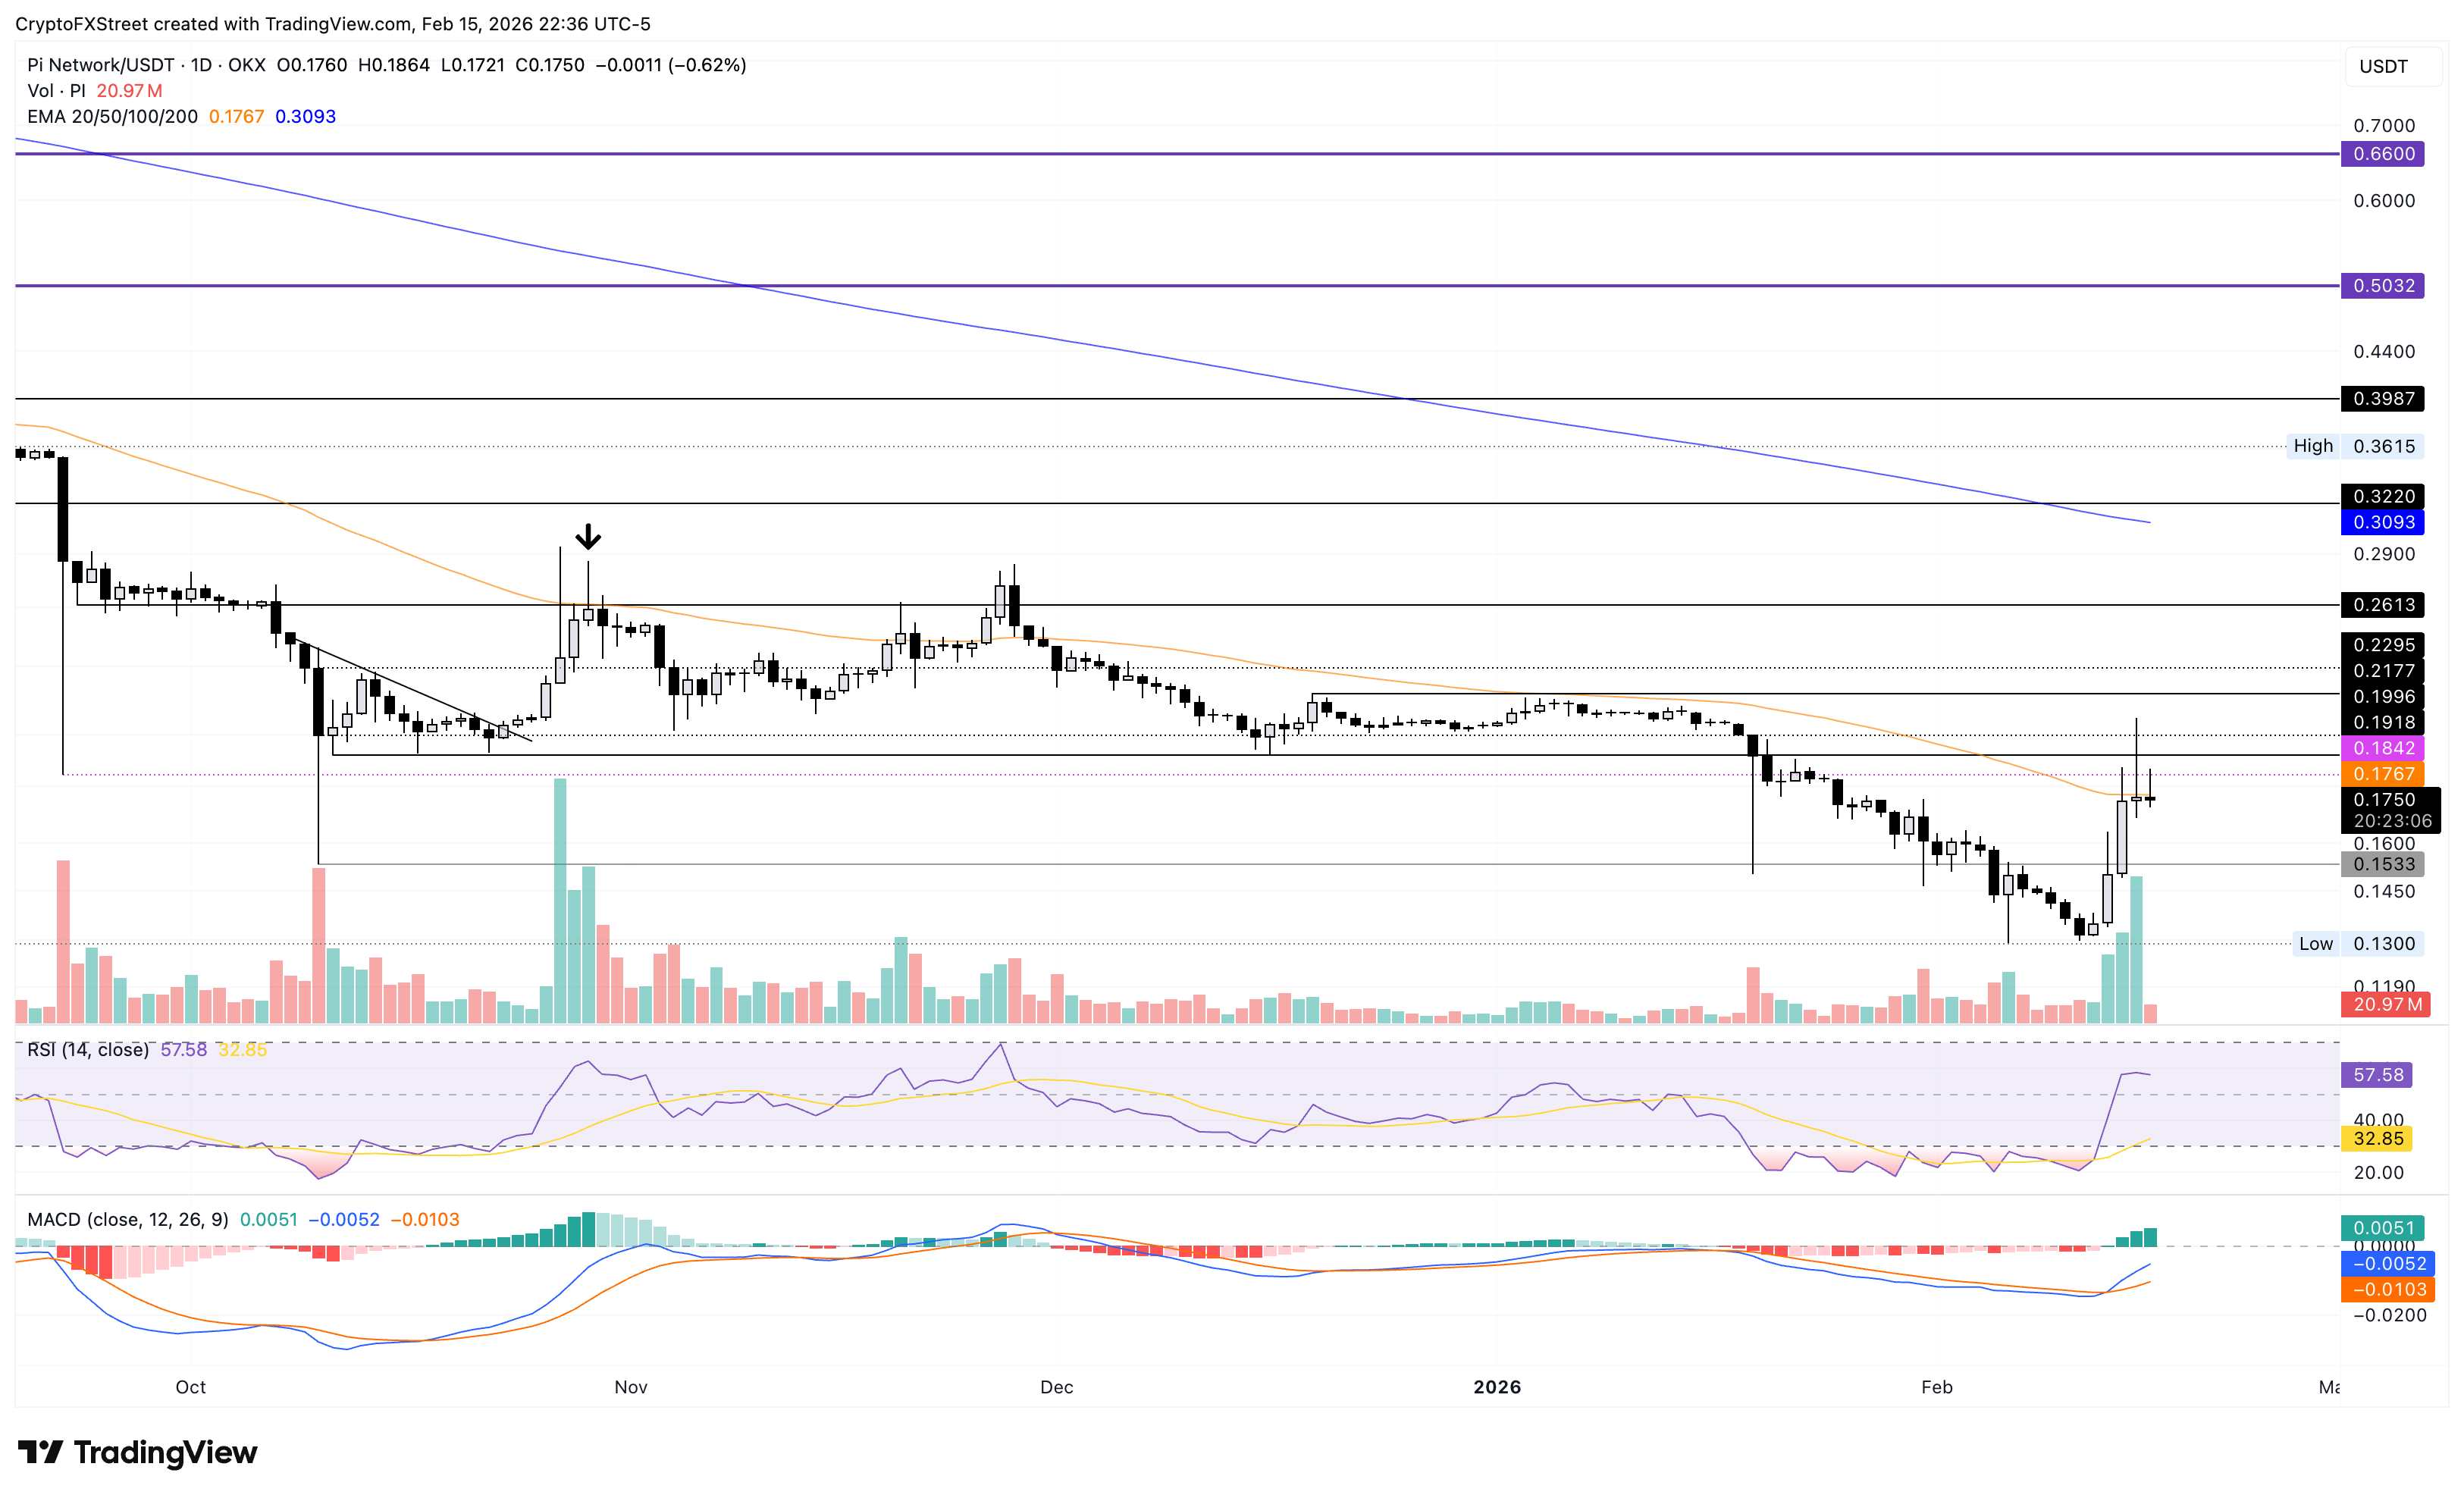
On the flip side, a reversal from the 50-day EMA could test the $0.1533 support level marked by the October 10 low.

يعتمد أكثر من مليون مستخدم على FXStreet للحصول على بيانات سوقية لحظية، وأدوات رسوم بيانية، ورؤى خبراء، وأخبار الفوركس. يساعد تقويمهم الاقتصادي الشامل والندوات التعليمية عبر الويب المتداولين على البقاء على اطلاع واتخاذ قرارات محسوبة. لدى FXStreet فريق يضم حوالي 60 محترفًا موزعين بين مقر برشلونة ومناطق عالمية مختلفة.
اقرأ المزيد


