

Pi Network Price Forecast: PI eyes a rebound as broader market recovers
- Pi Network holds steady above $0.07500 on Wednesday, testing the lower trendline of a falling channel pattern.
- The easing of broader market risk-off sentiment prompts a likely bullish turnaround in the PI token.
- The technical outlook for PI indicates a near-term rebound bias amid oversold momentum.
Pi Network (PI) hovers above $0.07500 on Wednesday, showing early signs of a rebound from a key support zone after over two weeks of steady decline. The broader market recovery linked to reduced US inflation and the likelihood of fewer rate hikes eases risk-off sentiment, which had been weighing down altcoins. The technical outlook for Pi Network takes a mildly optimistic shift, indicating a potential rebound amid oversold momentum.

Market recovery fuels investors’ risk appetite for PI
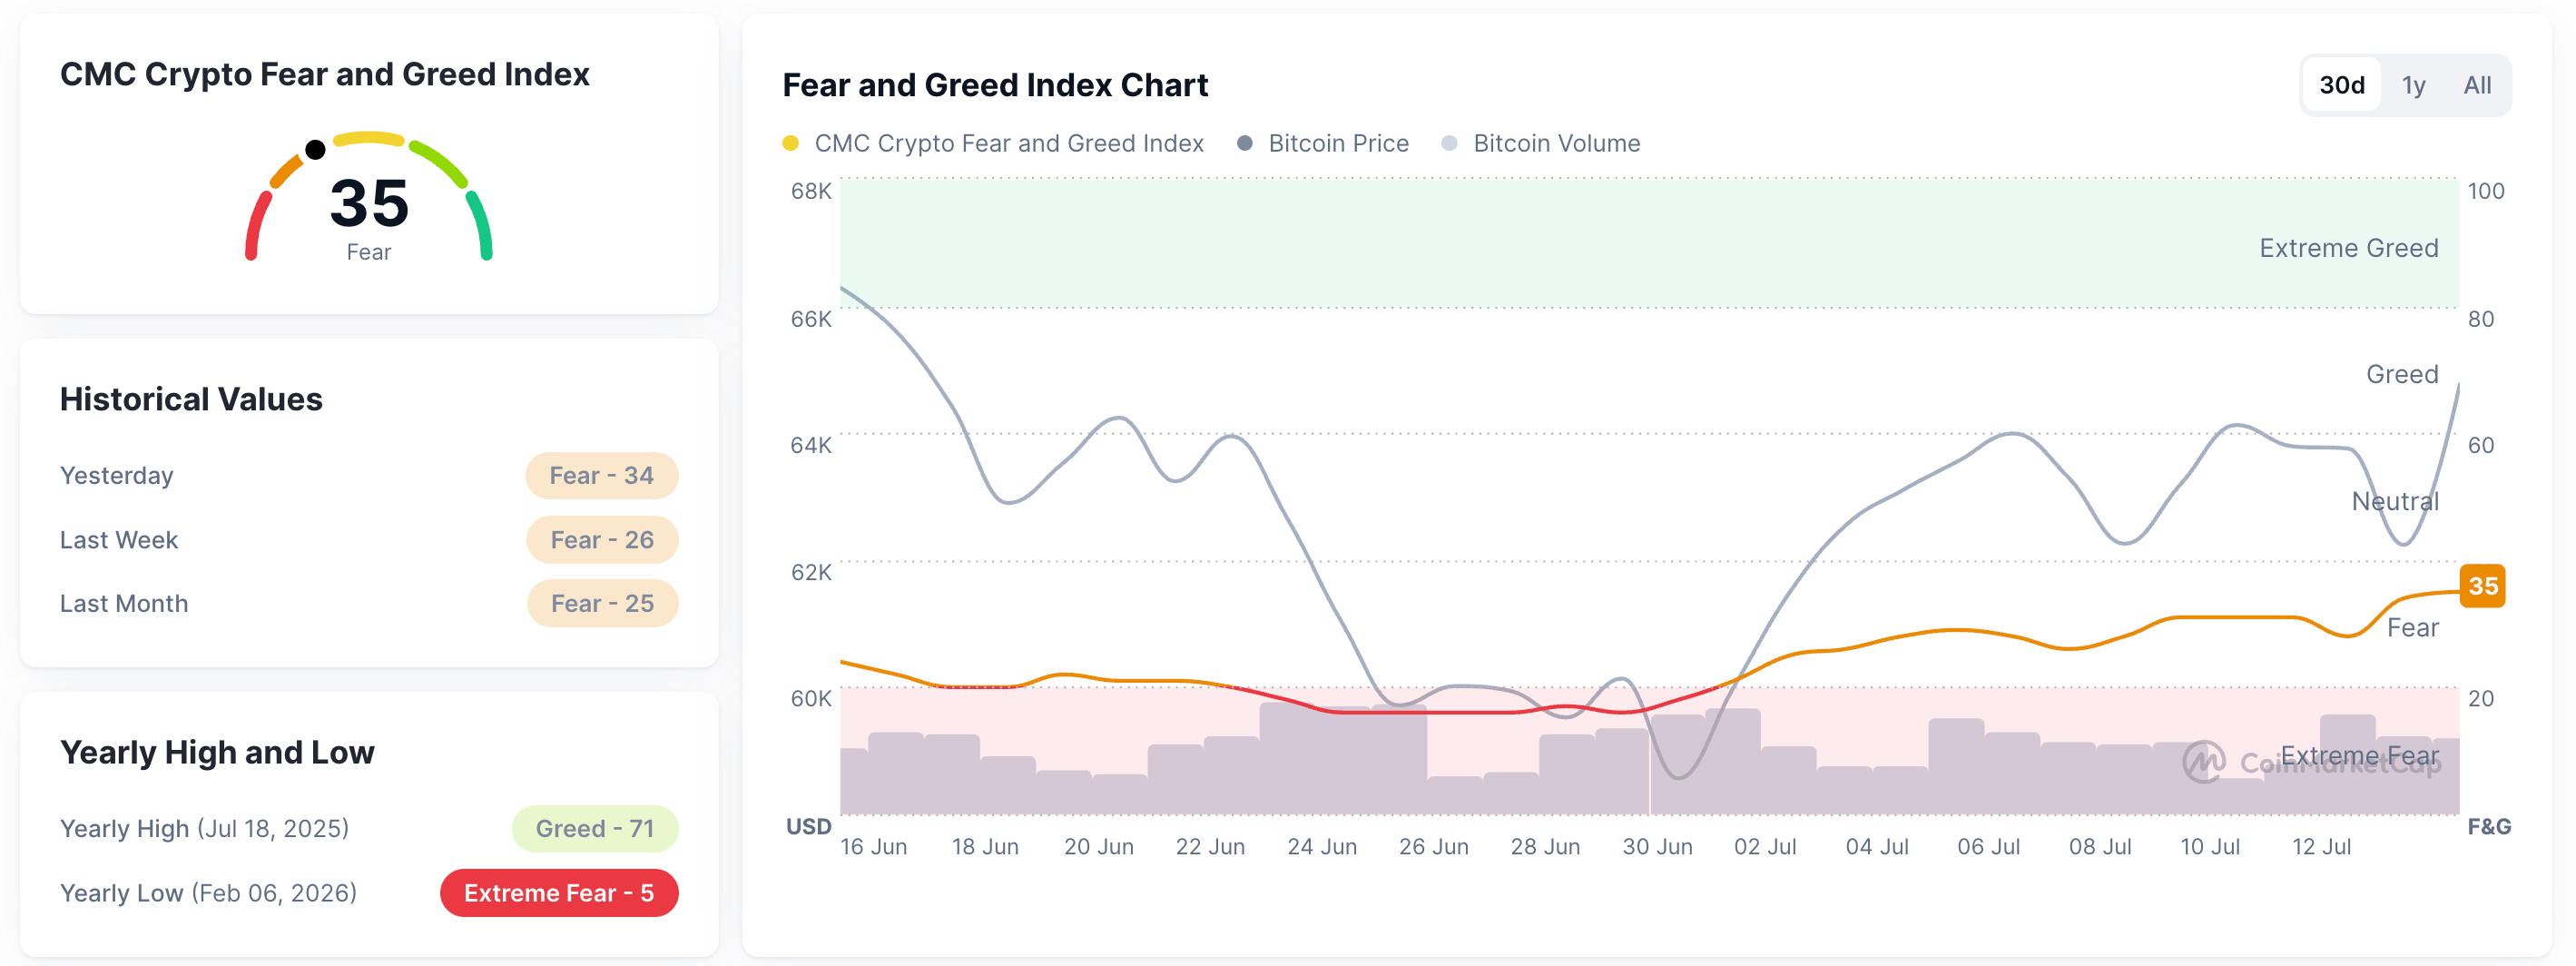
Pi Network paused its steady decline seen over the past two weeks on Tuesday as the crypto market recovered on weaker-than-expected US CPI data for June. CoinMarketCap's Fear and Greed Index at 35 on Wednesday, up from 28 on Monday, indicates a sharp decline in the broader risk-off sentiment.
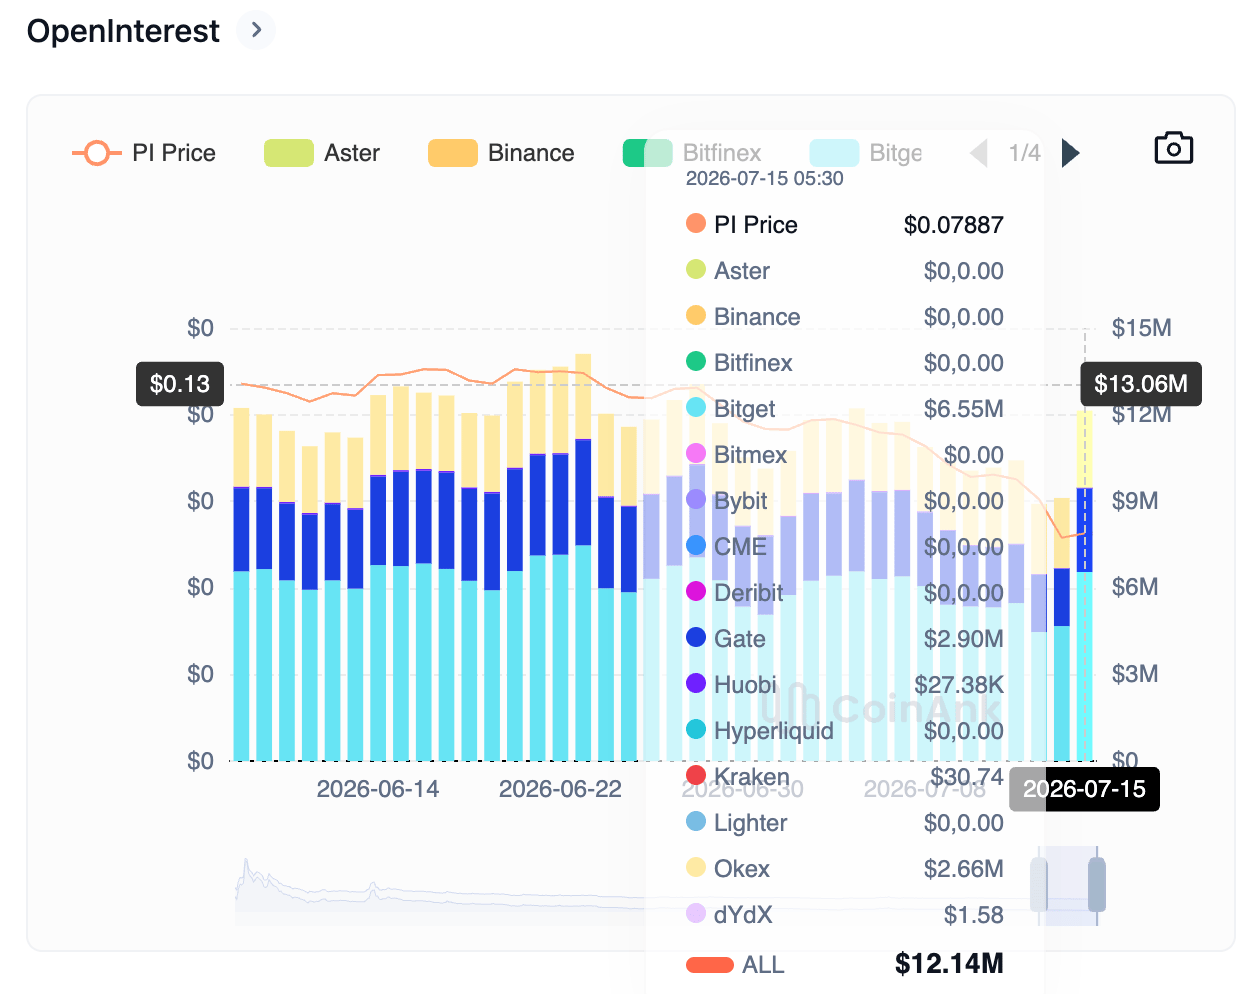
Typically, such spikes in risk appetite among crypto investors trigger an uptick in speculative tokens such as PI. CoinAnk data shows the PI Open Interest (OI) surged to $12.14 million on Tuesday, up from $9.11 million the previous day, indicating a fresh positional buildup and renewed investor demand.
Will Pi Network reclaim $0.1000?
Pi Network hovers around $0.08000 at press time on Wednesday, holding above a descending support trendline of a falling channel pattern, near $0.07500. The Doji candle formed on the previous day, near the support trendline, hints at a potential upside move within the bearish setup.
The 161.8% Fibonacci extension at $0.06793, measured from the downswing from $0.1998 to $0.1183, reinforces the support trendline and the odds of a rebound. Looking up, the potential recovery in PI could face resistance at the 127.2% Fibonacci level at $0.09613, guarding the $0.1000 psychological threshold.
The configuration suggests the broader trend remains under pressure, but the Relative Strength Index (RSI) at around 15 sits deep in oversold territory, and the Moving Average Convergence Divergence (MACD) remains negative, hinting that selling momentum is overstretched.
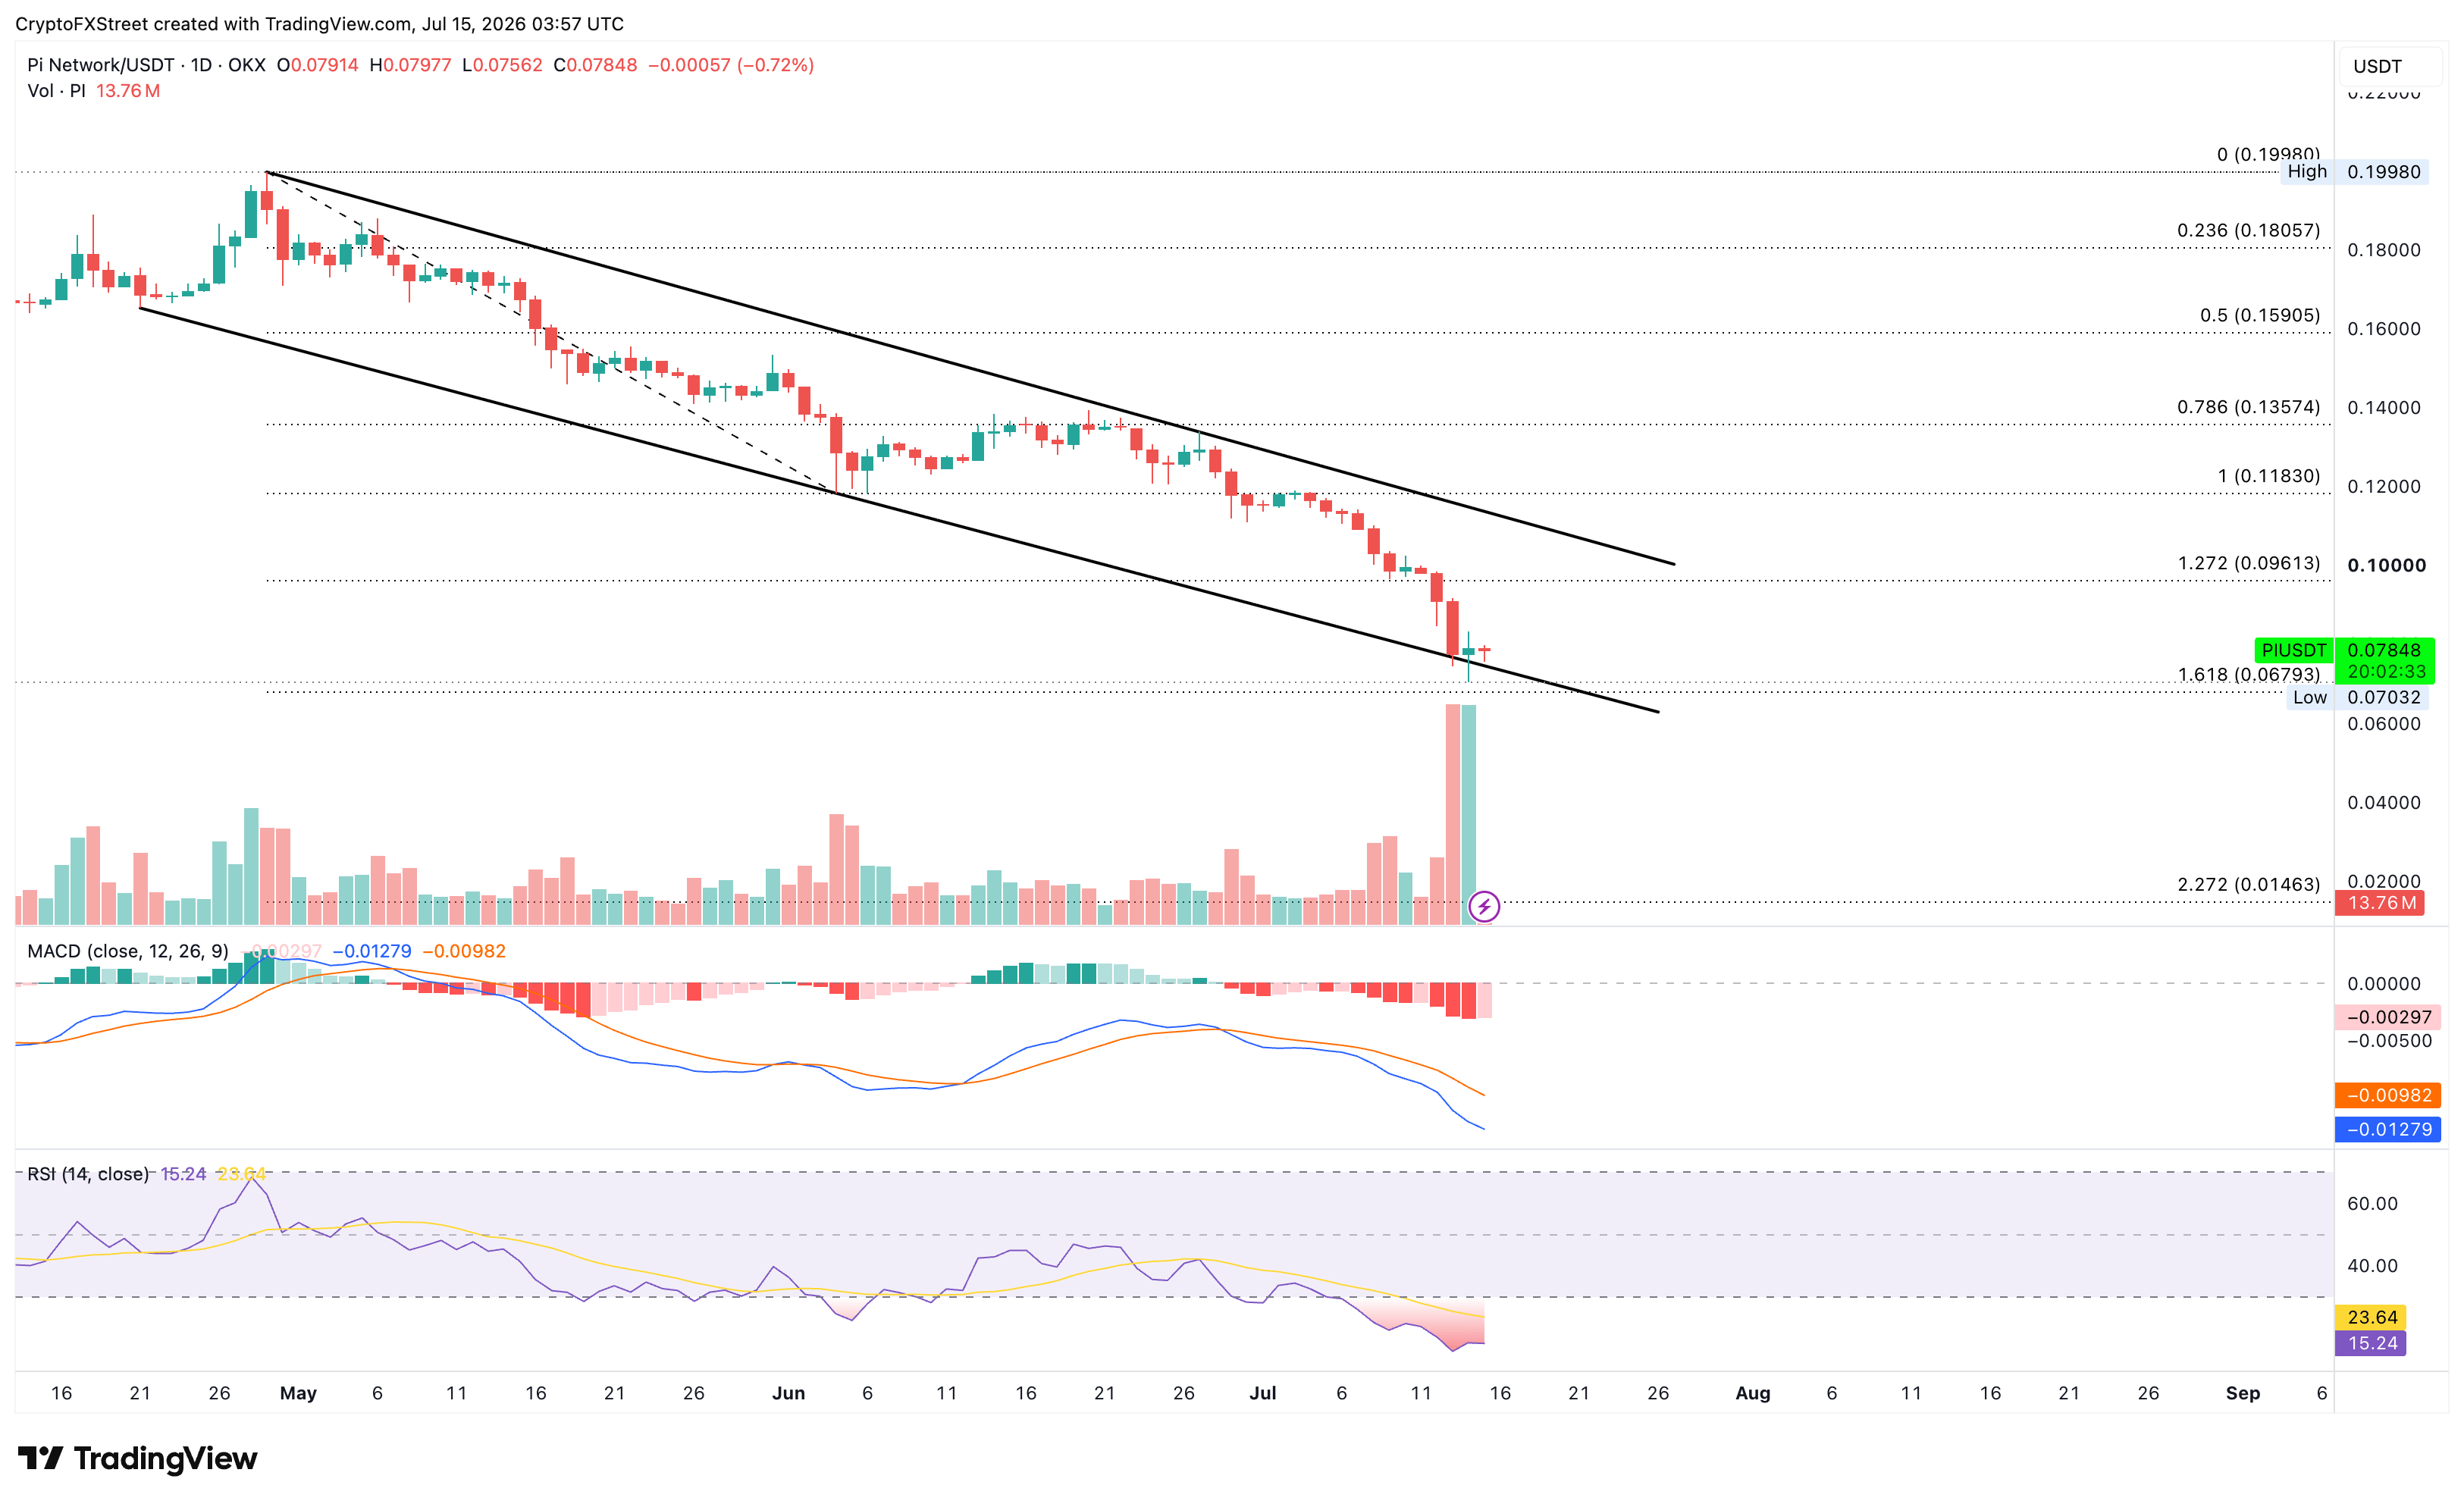
On the downside, the 161.8% Fibonacci extension at $0.06793 remains a key support level, where a daily close below it would start a bearish price discovery phase.
(The technical analysis of this story was written with the help of an AI tool. Know more.)














