
Pi Network Price Forecast: Reduction in fresh supply harbors PI rally
بواسطة Vishal Dixit
تاريخ النشر: 18 Feb 2026 | تاريخ التعديل: 18 Feb 2026


المقالات الشائعة

Pi Network (PI) is trading above $0.1900 at press time on Wednesday, extending the weekly gains by nearly 8% so far. The steady recovery is supported by a short-term pause in mainnet migration, which reduces pressure on the PI token supply for Centralized Exchanges (CEXs).
- Pi Network is up over 3% on Wednesday, building on the 7% gains from the previous day.
- PI extends recovery as the mainnet migration halts ahead of its first anniversary.
- The technical outlook indicates rising bullish momentum, with immediate resistance in focus.
Pi Network (PI) is trading above $0.1900 at press time on Wednesday, extending the weekly gains by nearly 8% so far. The steady recovery is supported by a short-term pause in mainnet migration, which reduces pressure on the PI token supply for Centralized Exchanges (CEXs). The technical outlook focuses on the $0.1919 resistance as bullish momentum increases.
Halt in Mainnet migration reduces sell pressure
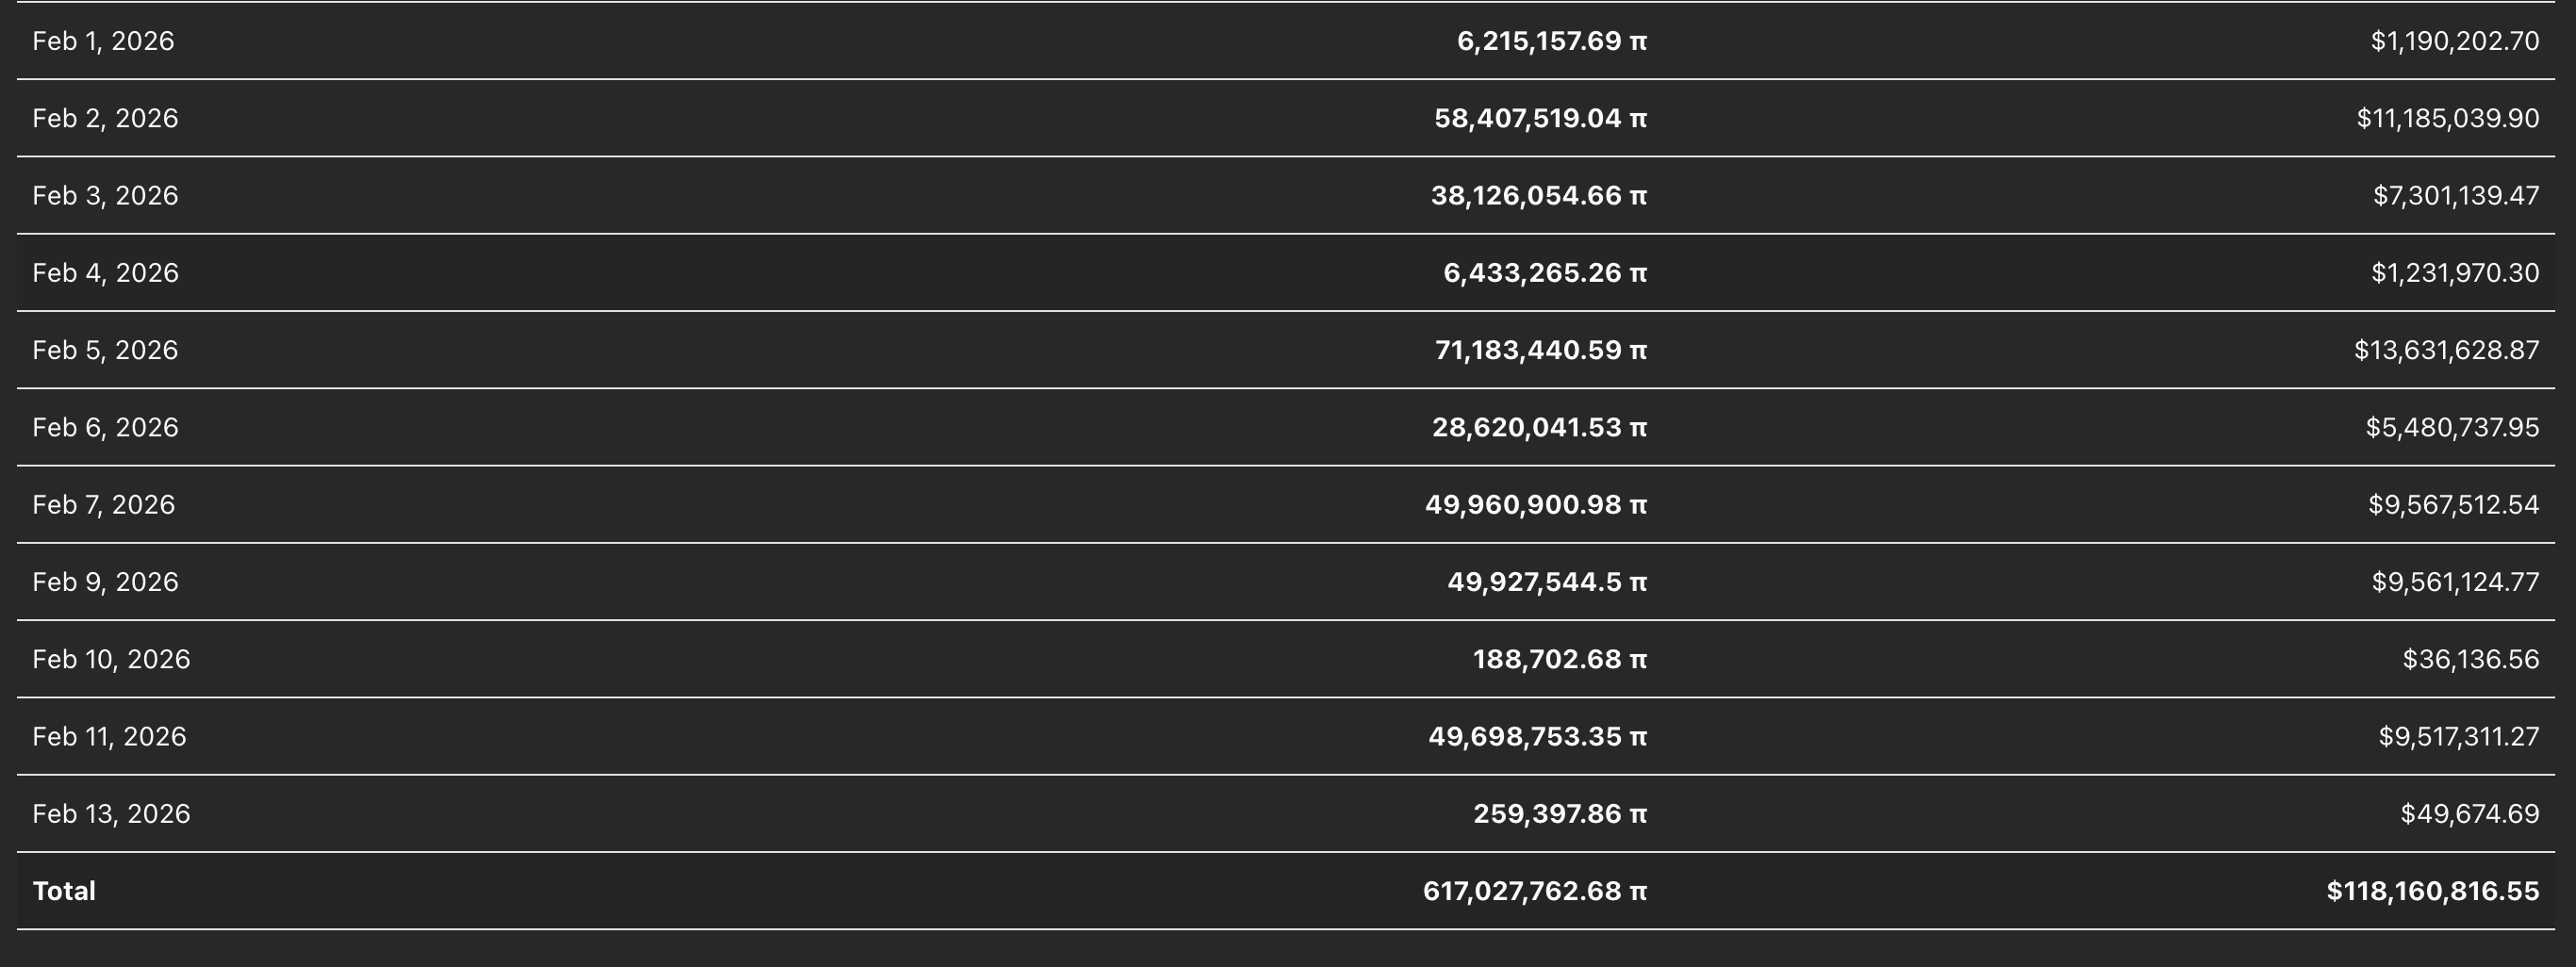
Pi scan data show that the mainnet migration, which allows users to deposit PI tokens from testnet after completing Know Your Customer (KYC) verification, has been inactive since Friday, with the last daily migration of 259,397 PI tokens. This has reduced pressure on the PI token supply for CEXs, supporting the demand spike, and aligns with the short-term recovery in the PI token price.
Pi Network rally approaches crucial resistance level
The PI token is trading above $0.1900 as of Wednesday, up nearly 3%. The PI token has surpassed the 50-day Exponential Moving Average (EMA) at $0.1773, indicating short-term buy-side bias.
The PI token is approaching the $0.1919 resistance level marked by the October 11 low, which previously served as crucial support on multiple occasions. A decisive close above this level could extend the rally to the $0.2177 resistance, aligning with the December 19 high.
The Relative Strength Index (RSI) is at 63 on the daily chart, showcasing a steady increase from the oversold region last week. This suggests a surge in buying pressure and indicates further upside before the market reaches the overbought zone. The Moving Average Convergence Divergence (MACD) approaches the zero line after a bullish crossover on Friday. Additionally, the MACD histogram's steady rise above the zero line indicates increasing bullish momentum.
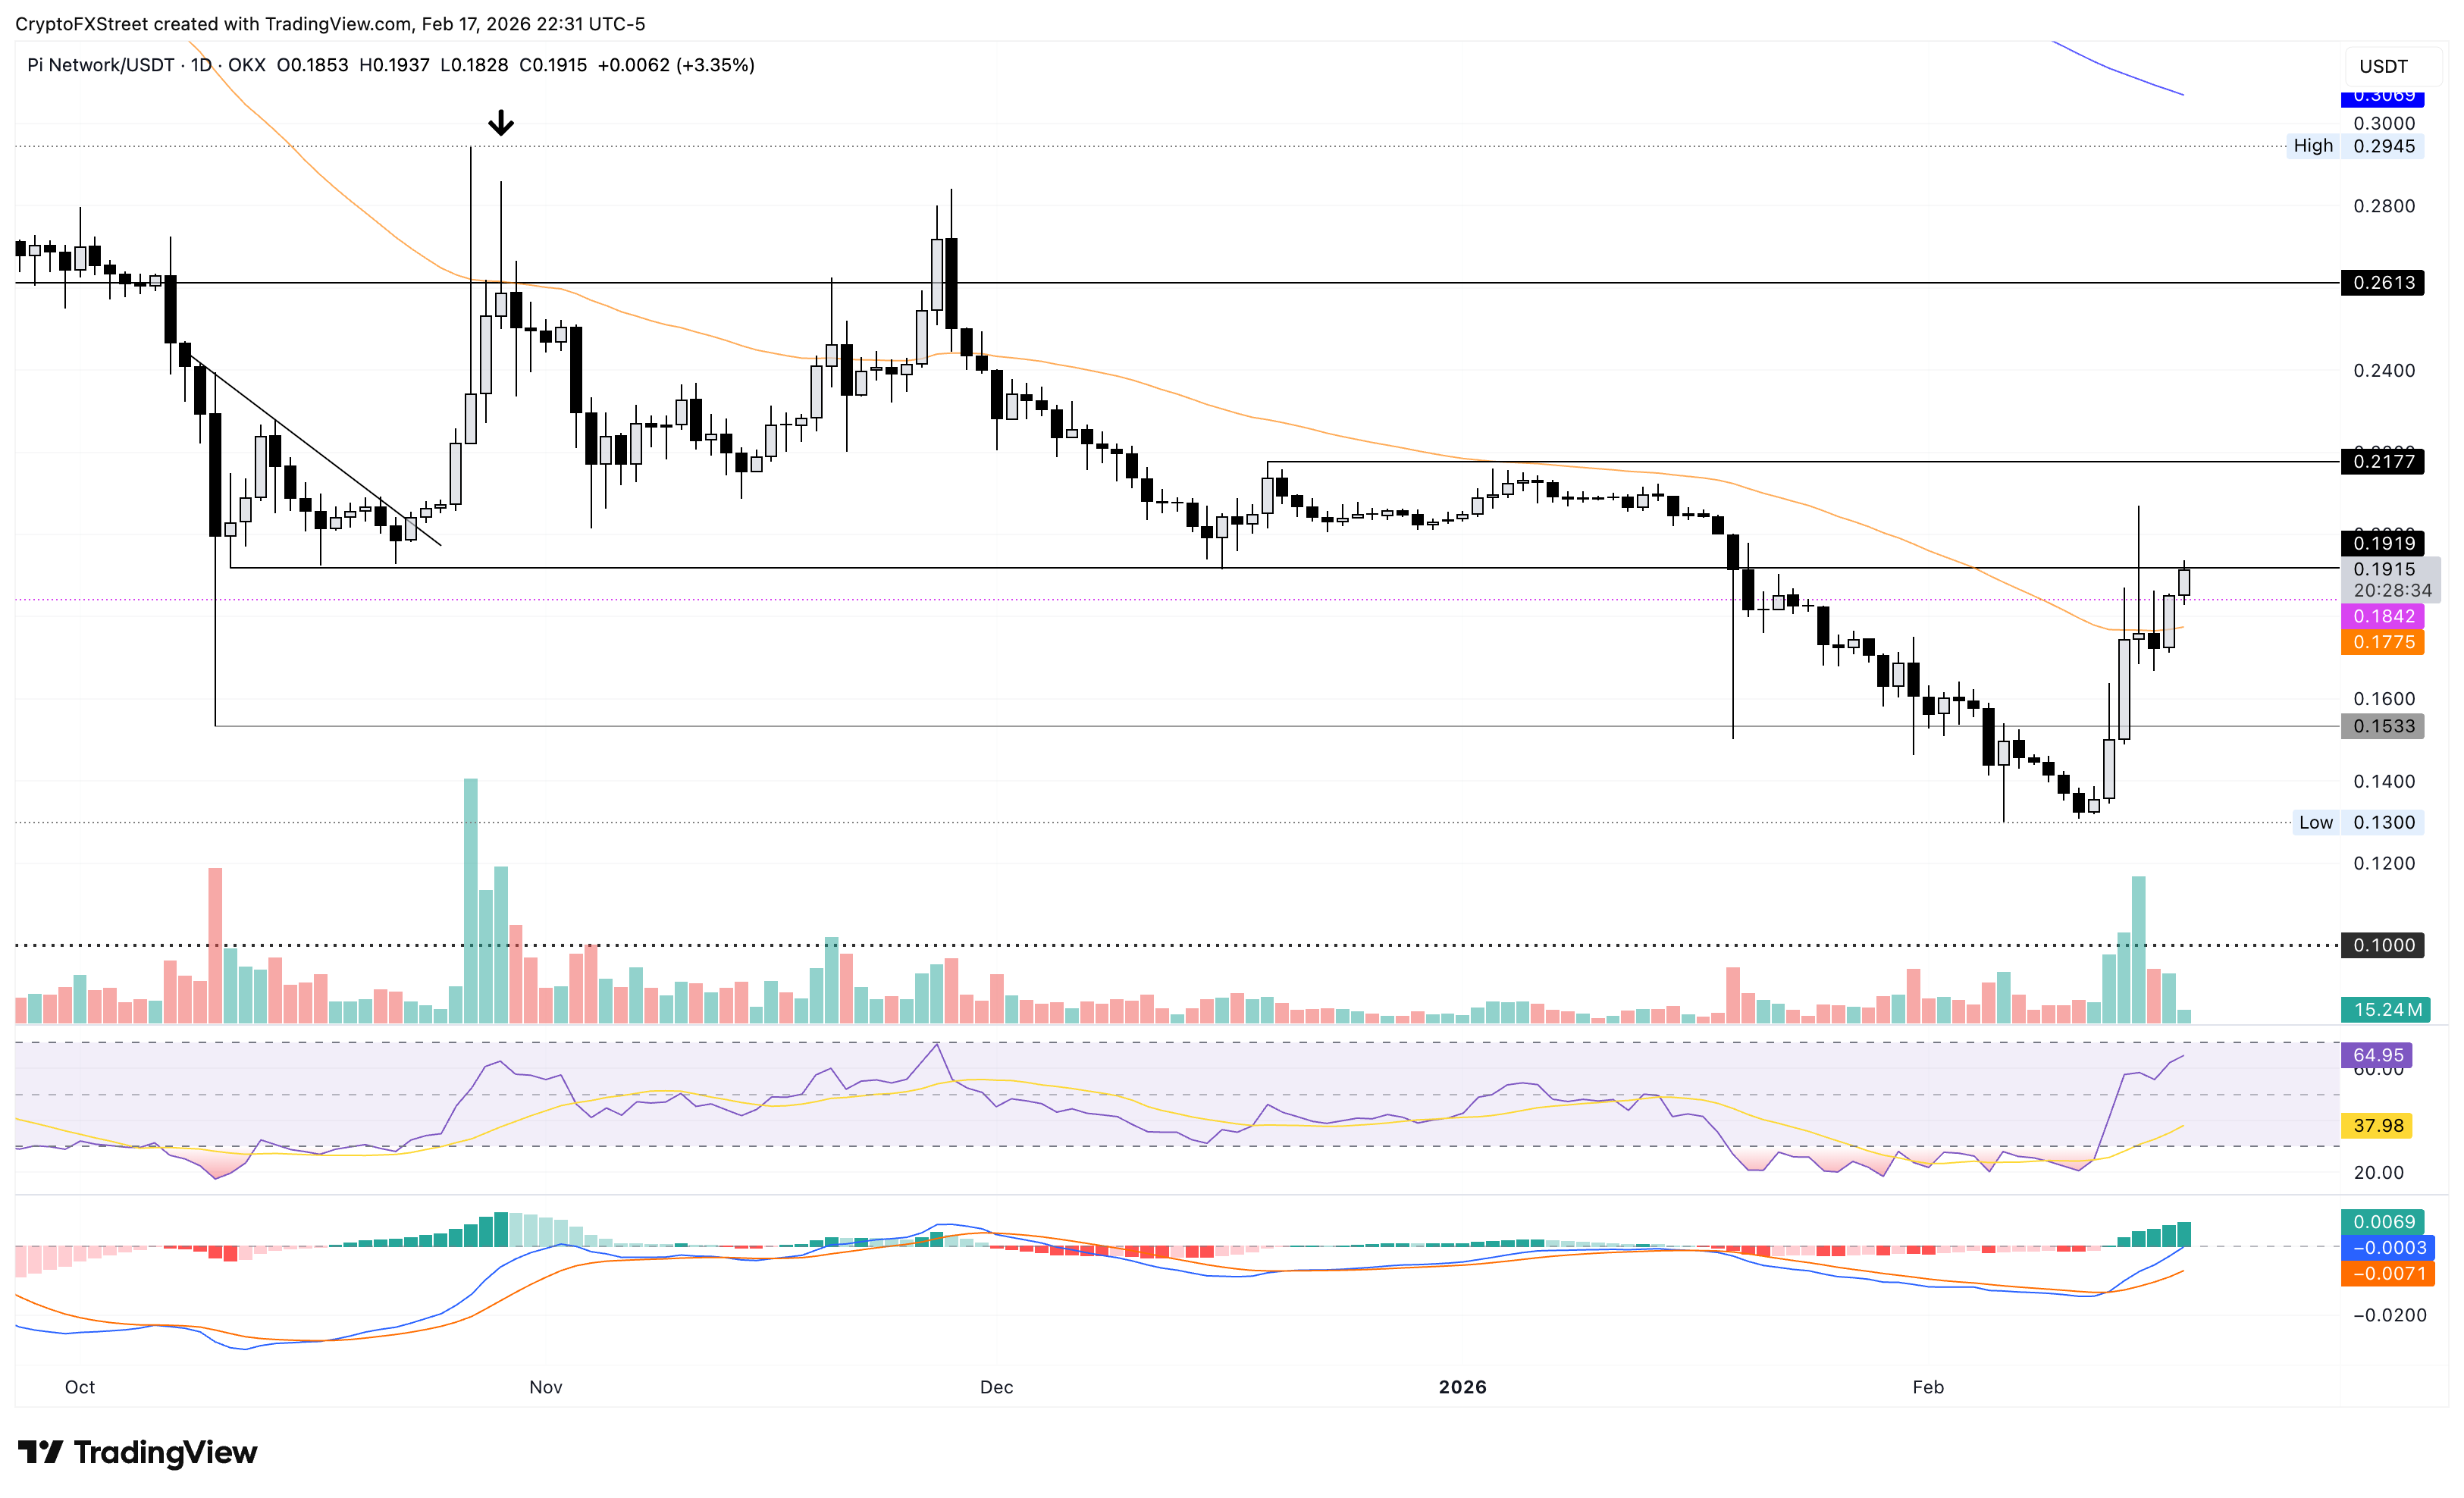
On the downside, the 50-day EMA at $0.1773 remains a key support level, followed by $0.1533, which aligns with the October 10 low.
Cryptocurrency metrics FAQs
The developer or creator of each cryptocurrency decides on the total number of tokens that can be minted or issued. Only a certain number of these assets can be minted by mining, staking or other mechanisms. This is defined by the algorithm of the underlying blockchain technology. On the other hand, circulating supply can also be decreased via actions such as burning tokens, or mistakenly sending assets to addresses of other incompatible blockchains.
Market capitalization is the result of multiplying the circulating supply of a certain asset by the asset’s current market value.
Trading volume refers to the total number of tokens for a specific asset that has been transacted or exchanged between buyers and sellers within set trading hours, for example, 24 hours. It is used to gauge market sentiment, this metric combines all volumes on centralized exchanges and decentralized exchanges. Increasing trading volume often denotes the demand for a certain asset as more people are buying and selling the cryptocurrency.
Funding rates are a concept designed to encourage traders to take positions and ensure perpetual contract prices match spot markets. It defines a mechanism by exchanges to ensure that future prices and index prices periodic payments regularly converge. When the funding rate is positive, the price of the perpetual contract is higher than the mark price. This means traders who are bullish and have opened long positions pay traders who are in short positions. On the other hand, a negative funding rate means perpetual prices are below the mark price, and hence traders with short positions pay traders who have opened long positions.

يعتمد أكثر من مليون مستخدم على FXStreet للحصول على بيانات سوقية لحظية، وأدوات رسوم بيانية، ورؤى خبراء، وأخبار الفوركس. يساعد تقويمهم الاقتصادي الشامل والندوات التعليمية عبر الويب المتداولين على البقاء على اطلاع واتخاذ قرارات محسوبة. لدى FXStreet فريق يضم حوالي 60 محترفًا موزعين بين مقر برشلونة ومناطق عالمية مختلفة.
اقرأ المزيد


