
Pi Network Price Forecast: PI rebounds after eight-day decline, bearish outlook remains intact
بواسطة Vishal Dixit
تاريخ النشر: 15 Dec 2025 | تاريخ التعديل: 15 Dec 2025


المقالات الشائعة

Pi Network (PI) edges higher by almost 2% at press time on Monday, after a steady decline for eight straight days. Still, the Pi Foundation’s 1.1 million token offloading amid large deposits of over 2.4 million PI into accounts linked to Banxa, a payment gateway, could exert some selling pressure.
- Pi Network ticks higher by almost 2% on Monday after eight consecutive days of decline.
- The Pi Foundation offloads over 1.1 million tokens, while the largest transactions on the network show a 2.4 million PI deposit to Banxa.
- The technical outlook for PI remains bearish, ignoring the intraday recovery.
Pi Network (PI) edges higher by almost 2% at press time on Monday, after a steady decline for eight straight days. Still, the Pi Foundation’s 1.1 million token offloading amid large deposits of over 2.4 million PI into accounts linked to Banxa, a payment gateway, could exert some selling pressure. The technical outlook for PI is bearish, with focus on the $0.1919 support level.
Is Pi Foundation selling PI tokens?
PiScan data shows that the Pi Foundation wallet #4 has offloaded 1.13 million PI tokens in the last 24 hours, indicating low confidence among the core team wallets.
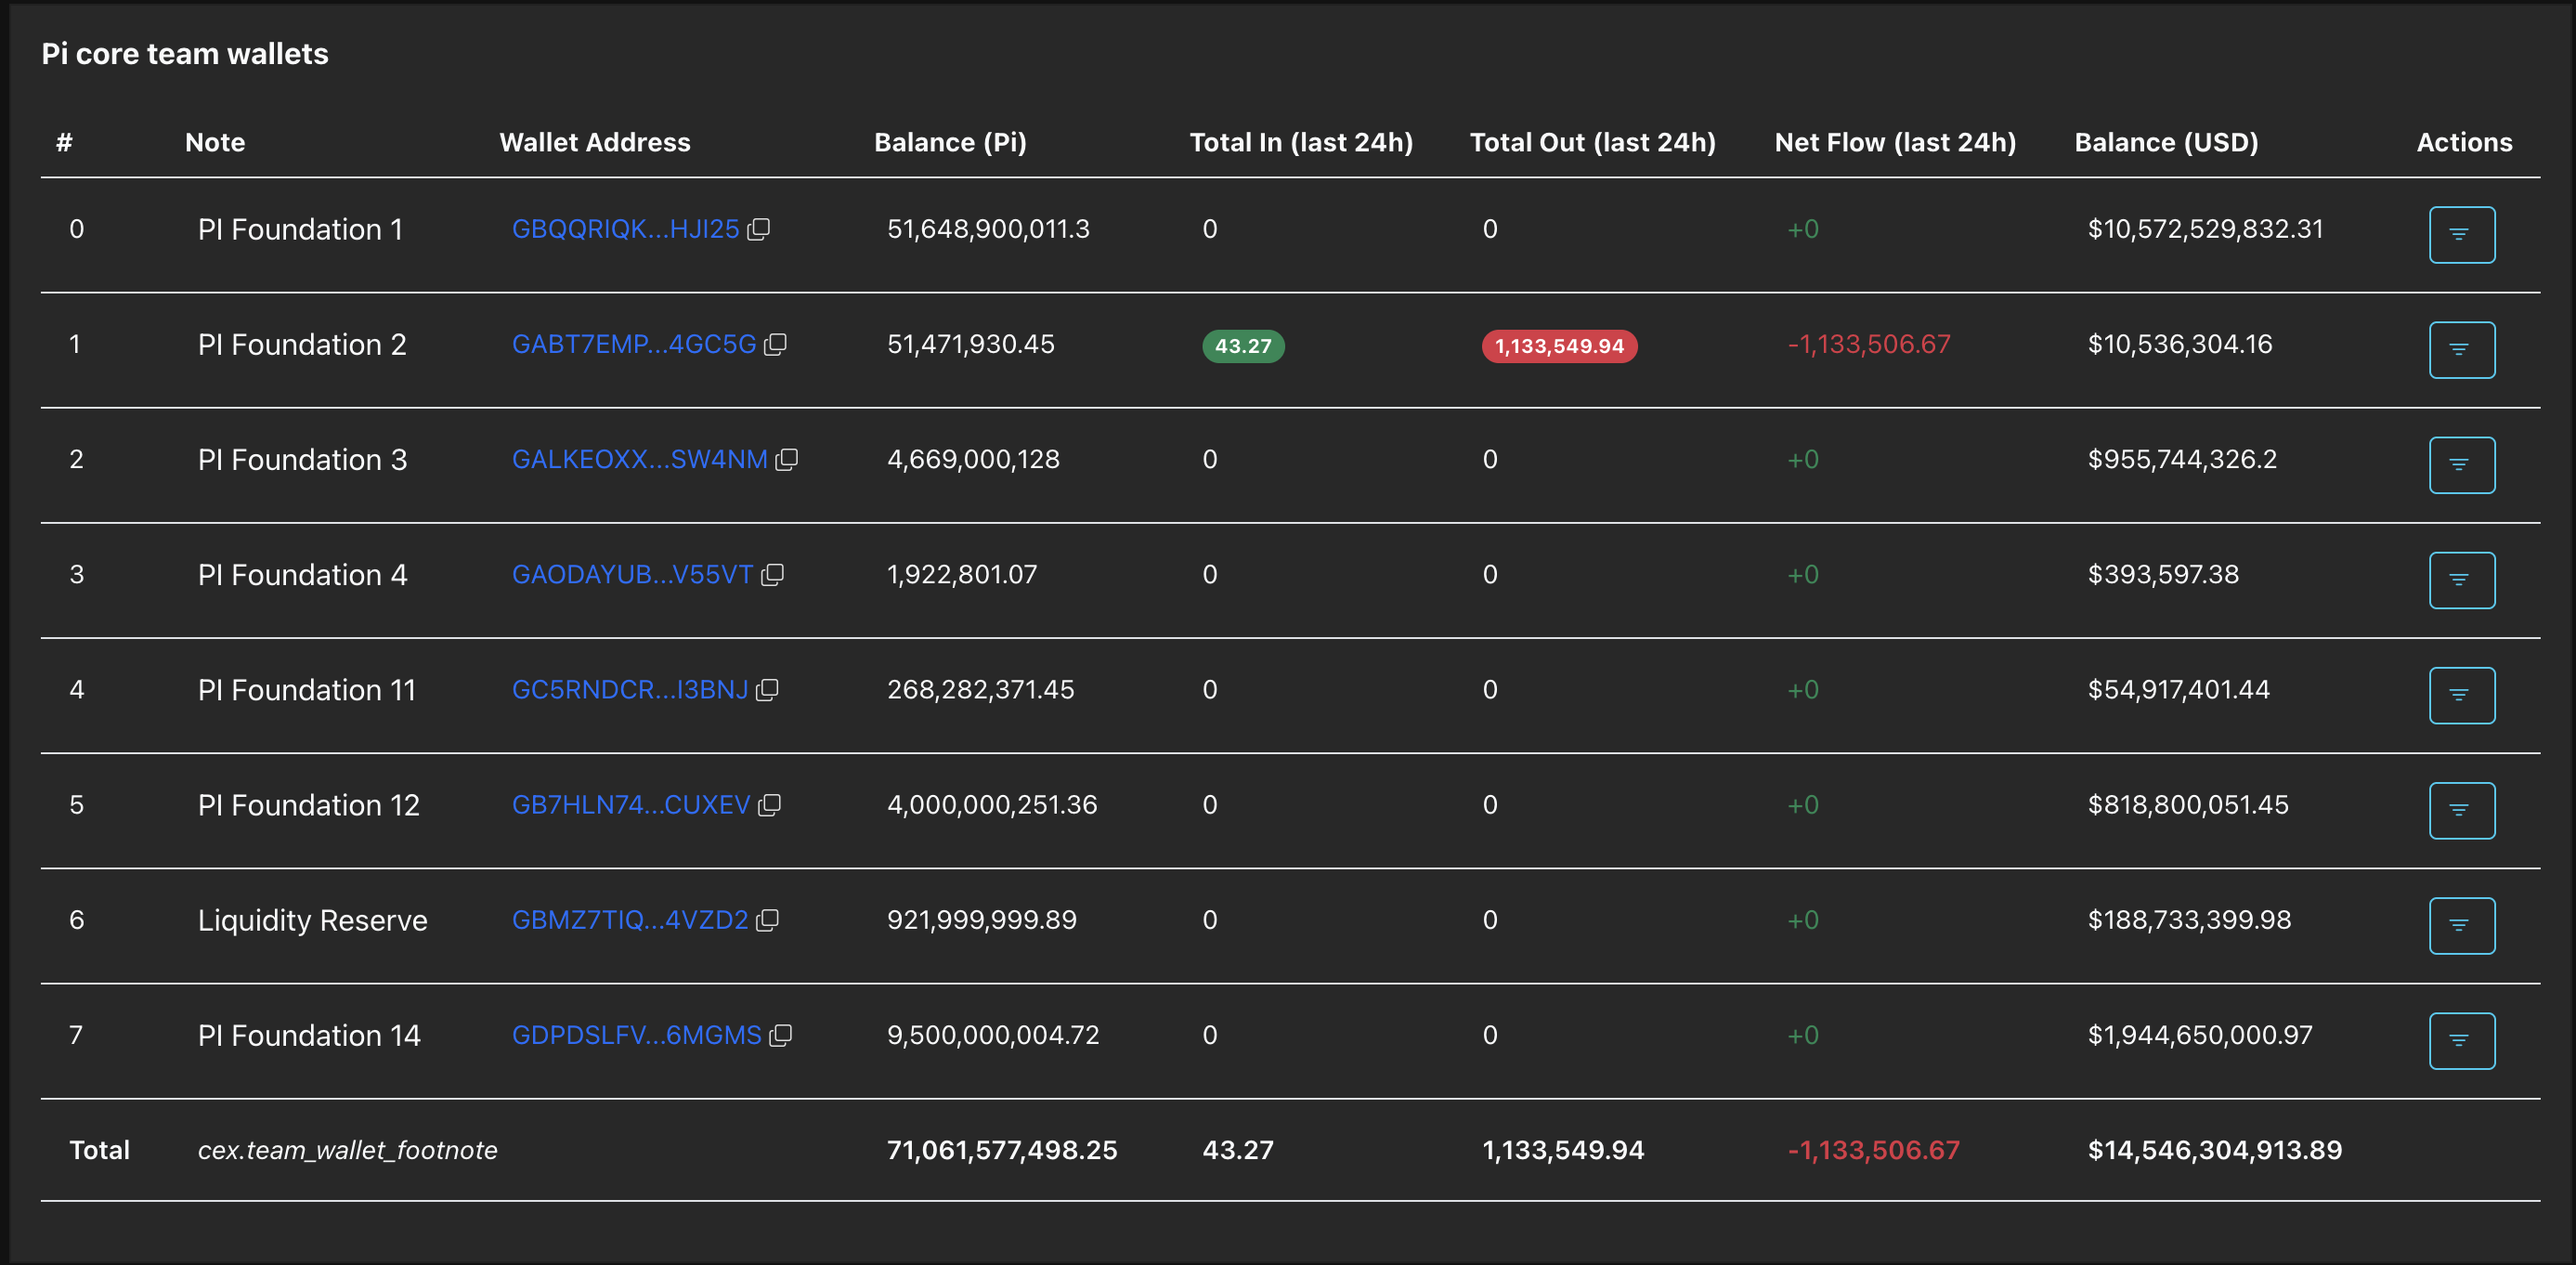
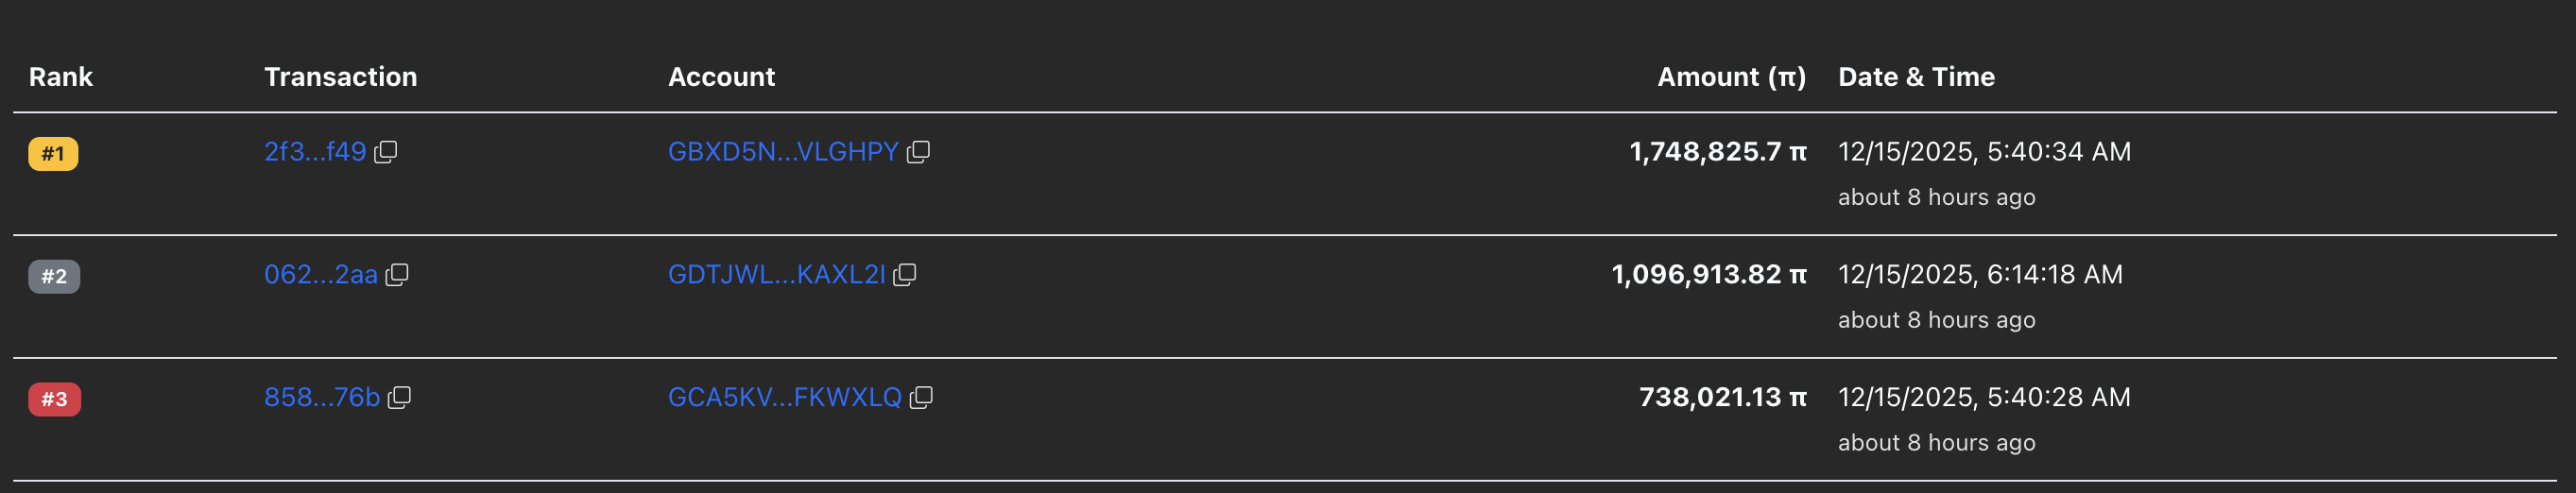
Apart from those, three other wallets transferred over 2.40 million PI tokens to addresses linked to Banxa, a payment gateway that offers an off-ramp for PI, marking the largest transactions in the last 24 hours. It's important to note that these three wallets were created by the previously mentioned Pi Foundation wallet #4 as a potential subsidiary, which implies that a sell-off by the Pi core team is possible.
Pi Network holds at key support with minor recovery
Pi Network trades near the $0.2000 psychological level at press time on Monday. The intraday rise of almost 2% marks a fresh start to the week, after eight straight days of downward trend.
The October 11 low at $0.1919 serves as the immediate support for PI, which has provided three rebounds in October. A potential rebound in PI could aim for the 50-day Exponential Moving Average (EMA) at $0.2319.
Still, the technical indicators on the daily chart suggest PI lacks bullish momentum. The Relative Strength Index (RSI) is at 36, up from the oversold zone, but remains in bearish territory.
Meanwhile, the Moving Average Convergence Divergence (MACD) remains below the zero line, indicating strong bearish pressure.
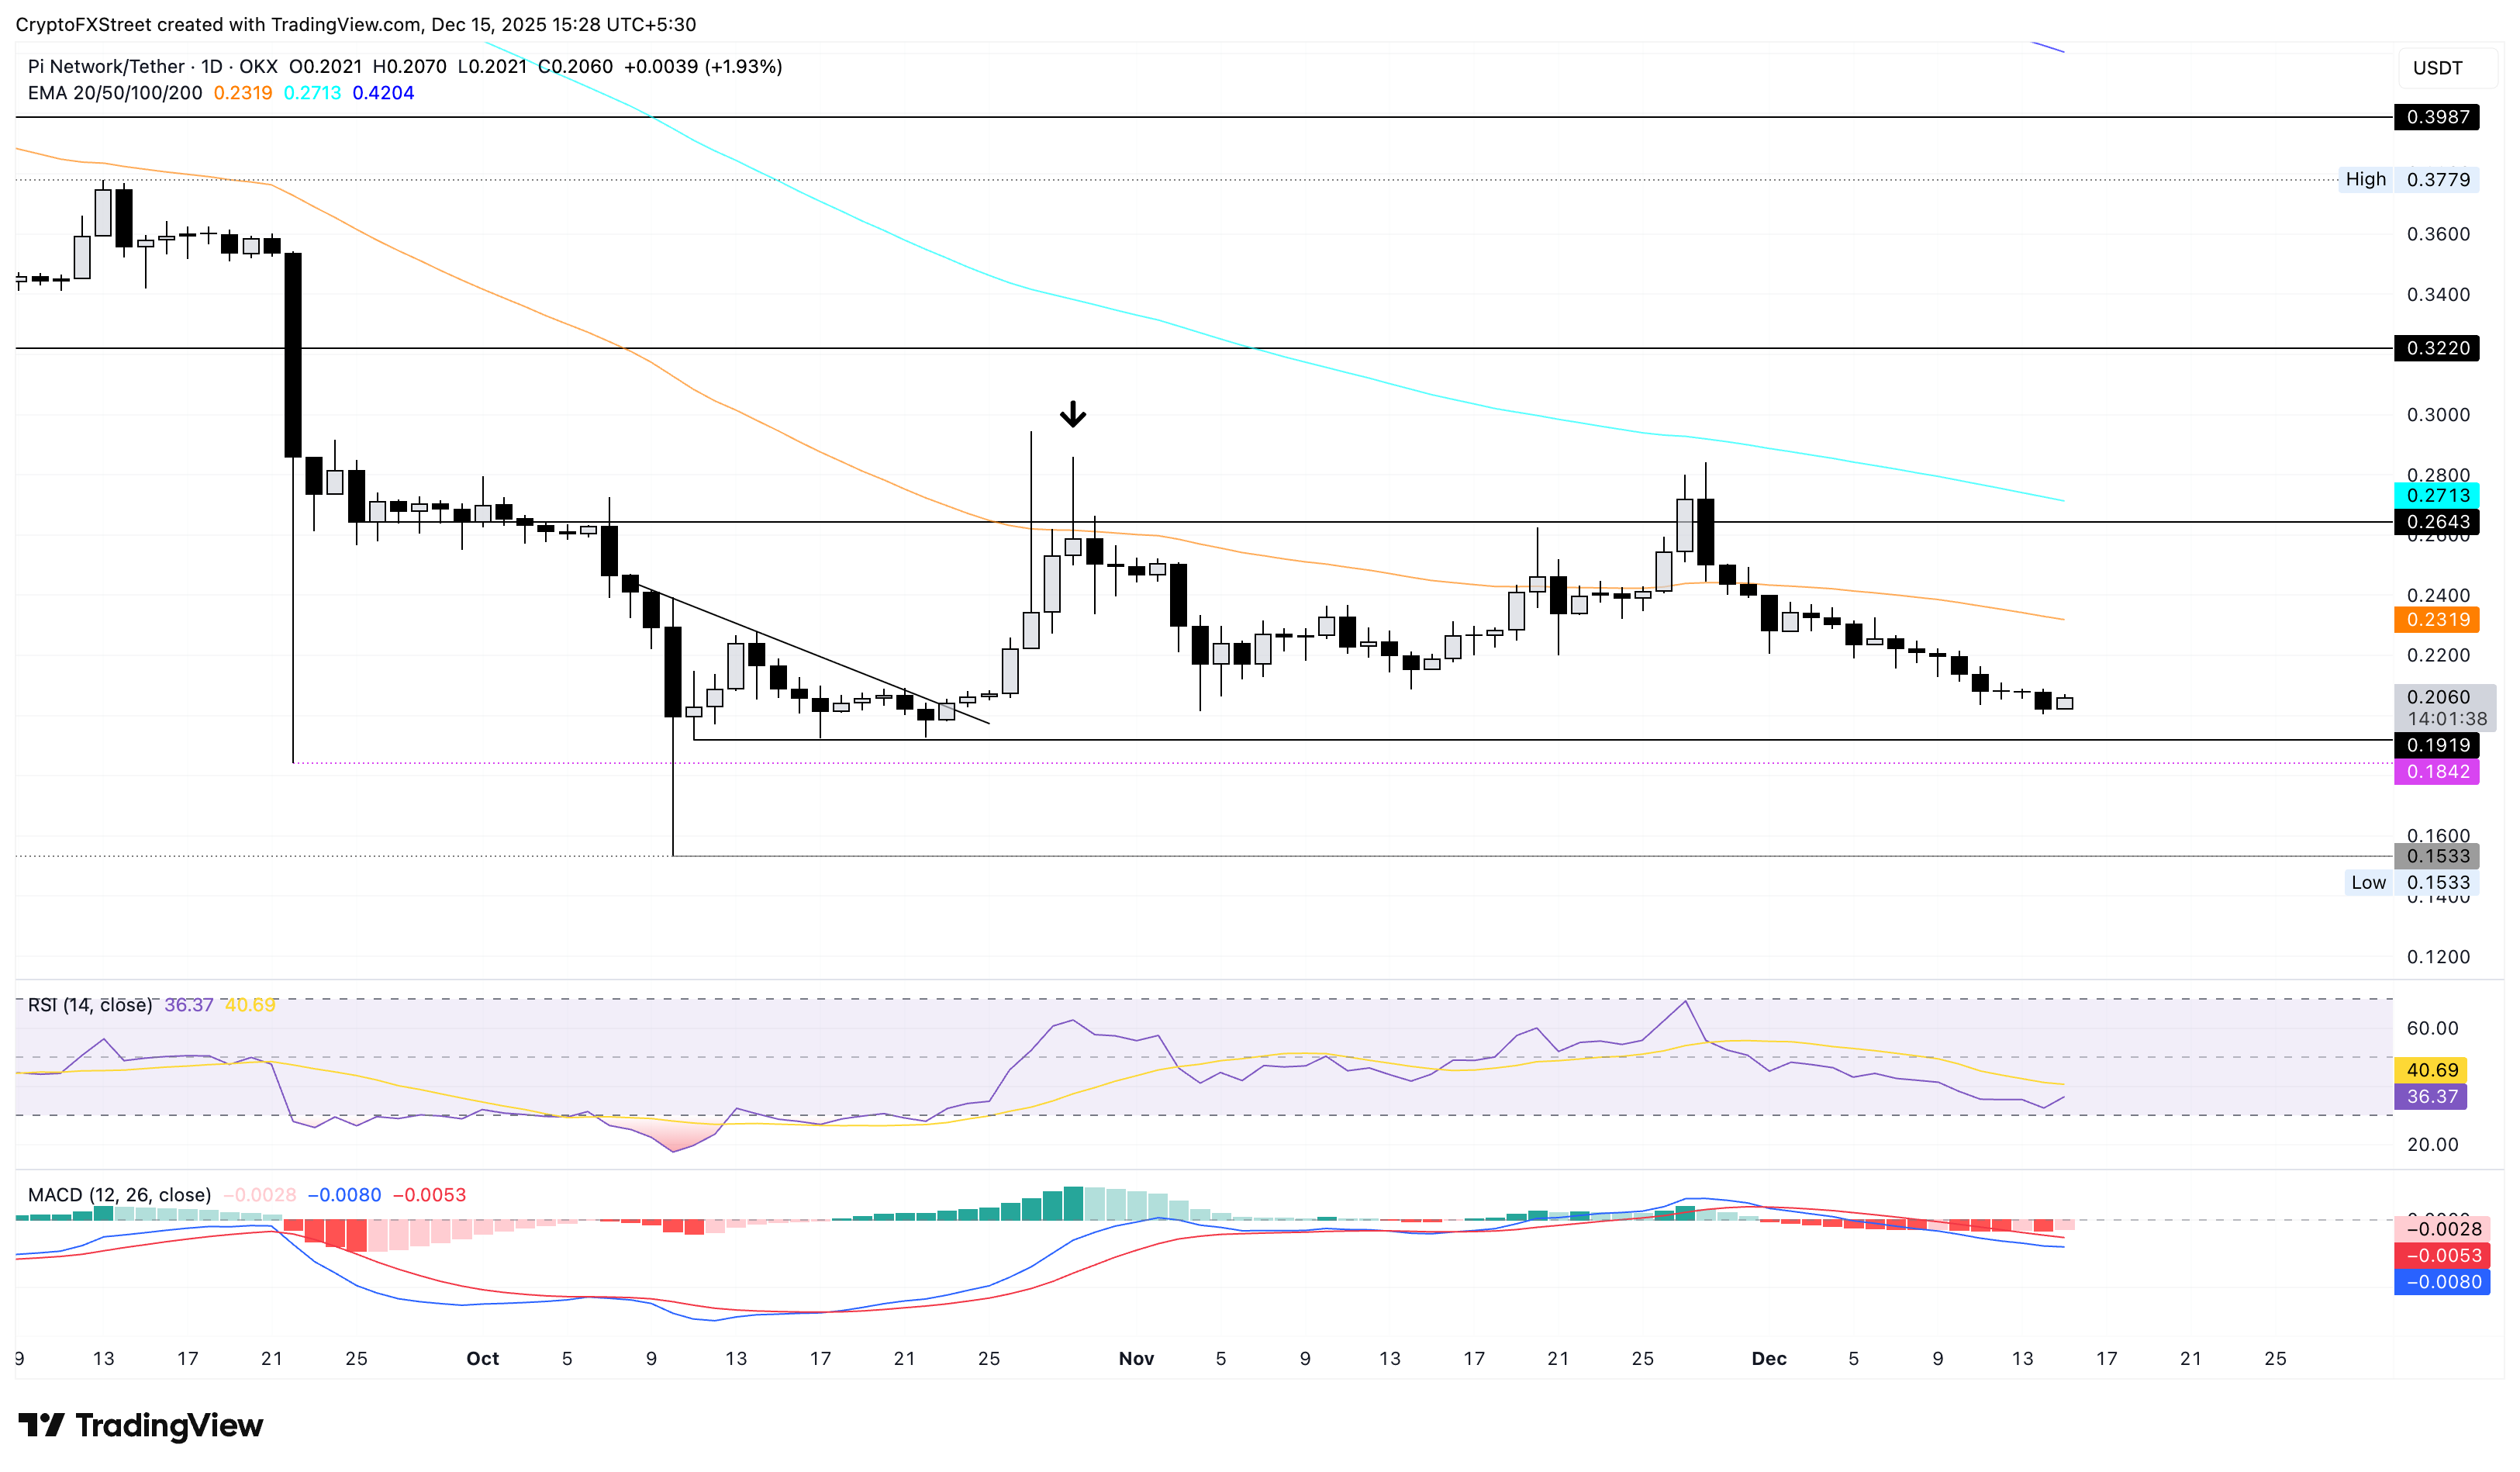
If PI slips below $0.1919, it could test the October 10 low at $0.1533.
Bitcoin, altcoins, stablecoins FAQs
Bitcoin is the largest cryptocurrency by market capitalization, a virtual currency designed to serve as money. This form of payment cannot be controlled by any one person, group, or entity, which eliminates the need for third-party participation during financial transactions.
Altcoins are any cryptocurrency apart from Bitcoin, but some also regard Ethereum as a non-altcoin because it is from these two cryptocurrencies that forking happens. If this is true, then Litecoin is the first altcoin, forked from the Bitcoin protocol and, therefore, an “improved” version of it.
Stablecoins are cryptocurrencies designed to have a stable price, with their value backed by a reserve of the asset it represents. To achieve this, the value of any one stablecoin is pegged to a commodity or financial instrument, such as the US Dollar (USD), with its supply regulated by an algorithm or demand. The main goal of stablecoins is to provide an on/off-ramp for investors willing to trade and invest in cryptocurrencies. Stablecoins also allow investors to store value since cryptocurrencies, in general, are subject to volatility.
Bitcoin dominance is the ratio of Bitcoin's market capitalization to the total market capitalization of all cryptocurrencies combined. It provides a clear picture of Bitcoin’s interest among investors. A high BTC dominance typically happens before and during a bull run, in which investors resort to investing in relatively stable and high market capitalization cryptocurrency like Bitcoin. A drop in BTC dominance usually means that investors are moving their capital and/or profits to altcoins in a quest for higher returns, which usually triggers an explosion of altcoin rallies.

يعتمد أكثر من مليون مستخدم على FXStreet للحصول على بيانات سوقية لحظية، وأدوات رسوم بيانية، ورؤى خبراء، وأخبار الفوركس. يساعد تقويمهم الاقتصادي الشامل والندوات التعليمية عبر الويب المتداولين على البقاء على اطلاع واتخاذ قرارات محسوبة. لدى FXStreet فريق يضم حوالي 60 محترفًا موزعين بين مقر برشلونة ومناطق عالمية مختلفة.
اقرأ المزيد


