
Pi Network Price Forecast: PI recovers as profit-taking pressure eases
بواسطة Vishal Dixit
تاريخ النشر: 20 Mar 2026 | تاريخ التعديل: 20 Mar 2026


المقالات الشائعة

Pi Network (PI) edges higher on Friday, showing early signs of recovery after a bearish start to the week, signaling a cooldown in the profit-taking phase. The technical outlook for PI is cautiously bullish as the recovery run faces clusters of resistance.
- Pi Network is up 3% on Friday, sprouting fresh recovery from a key support.
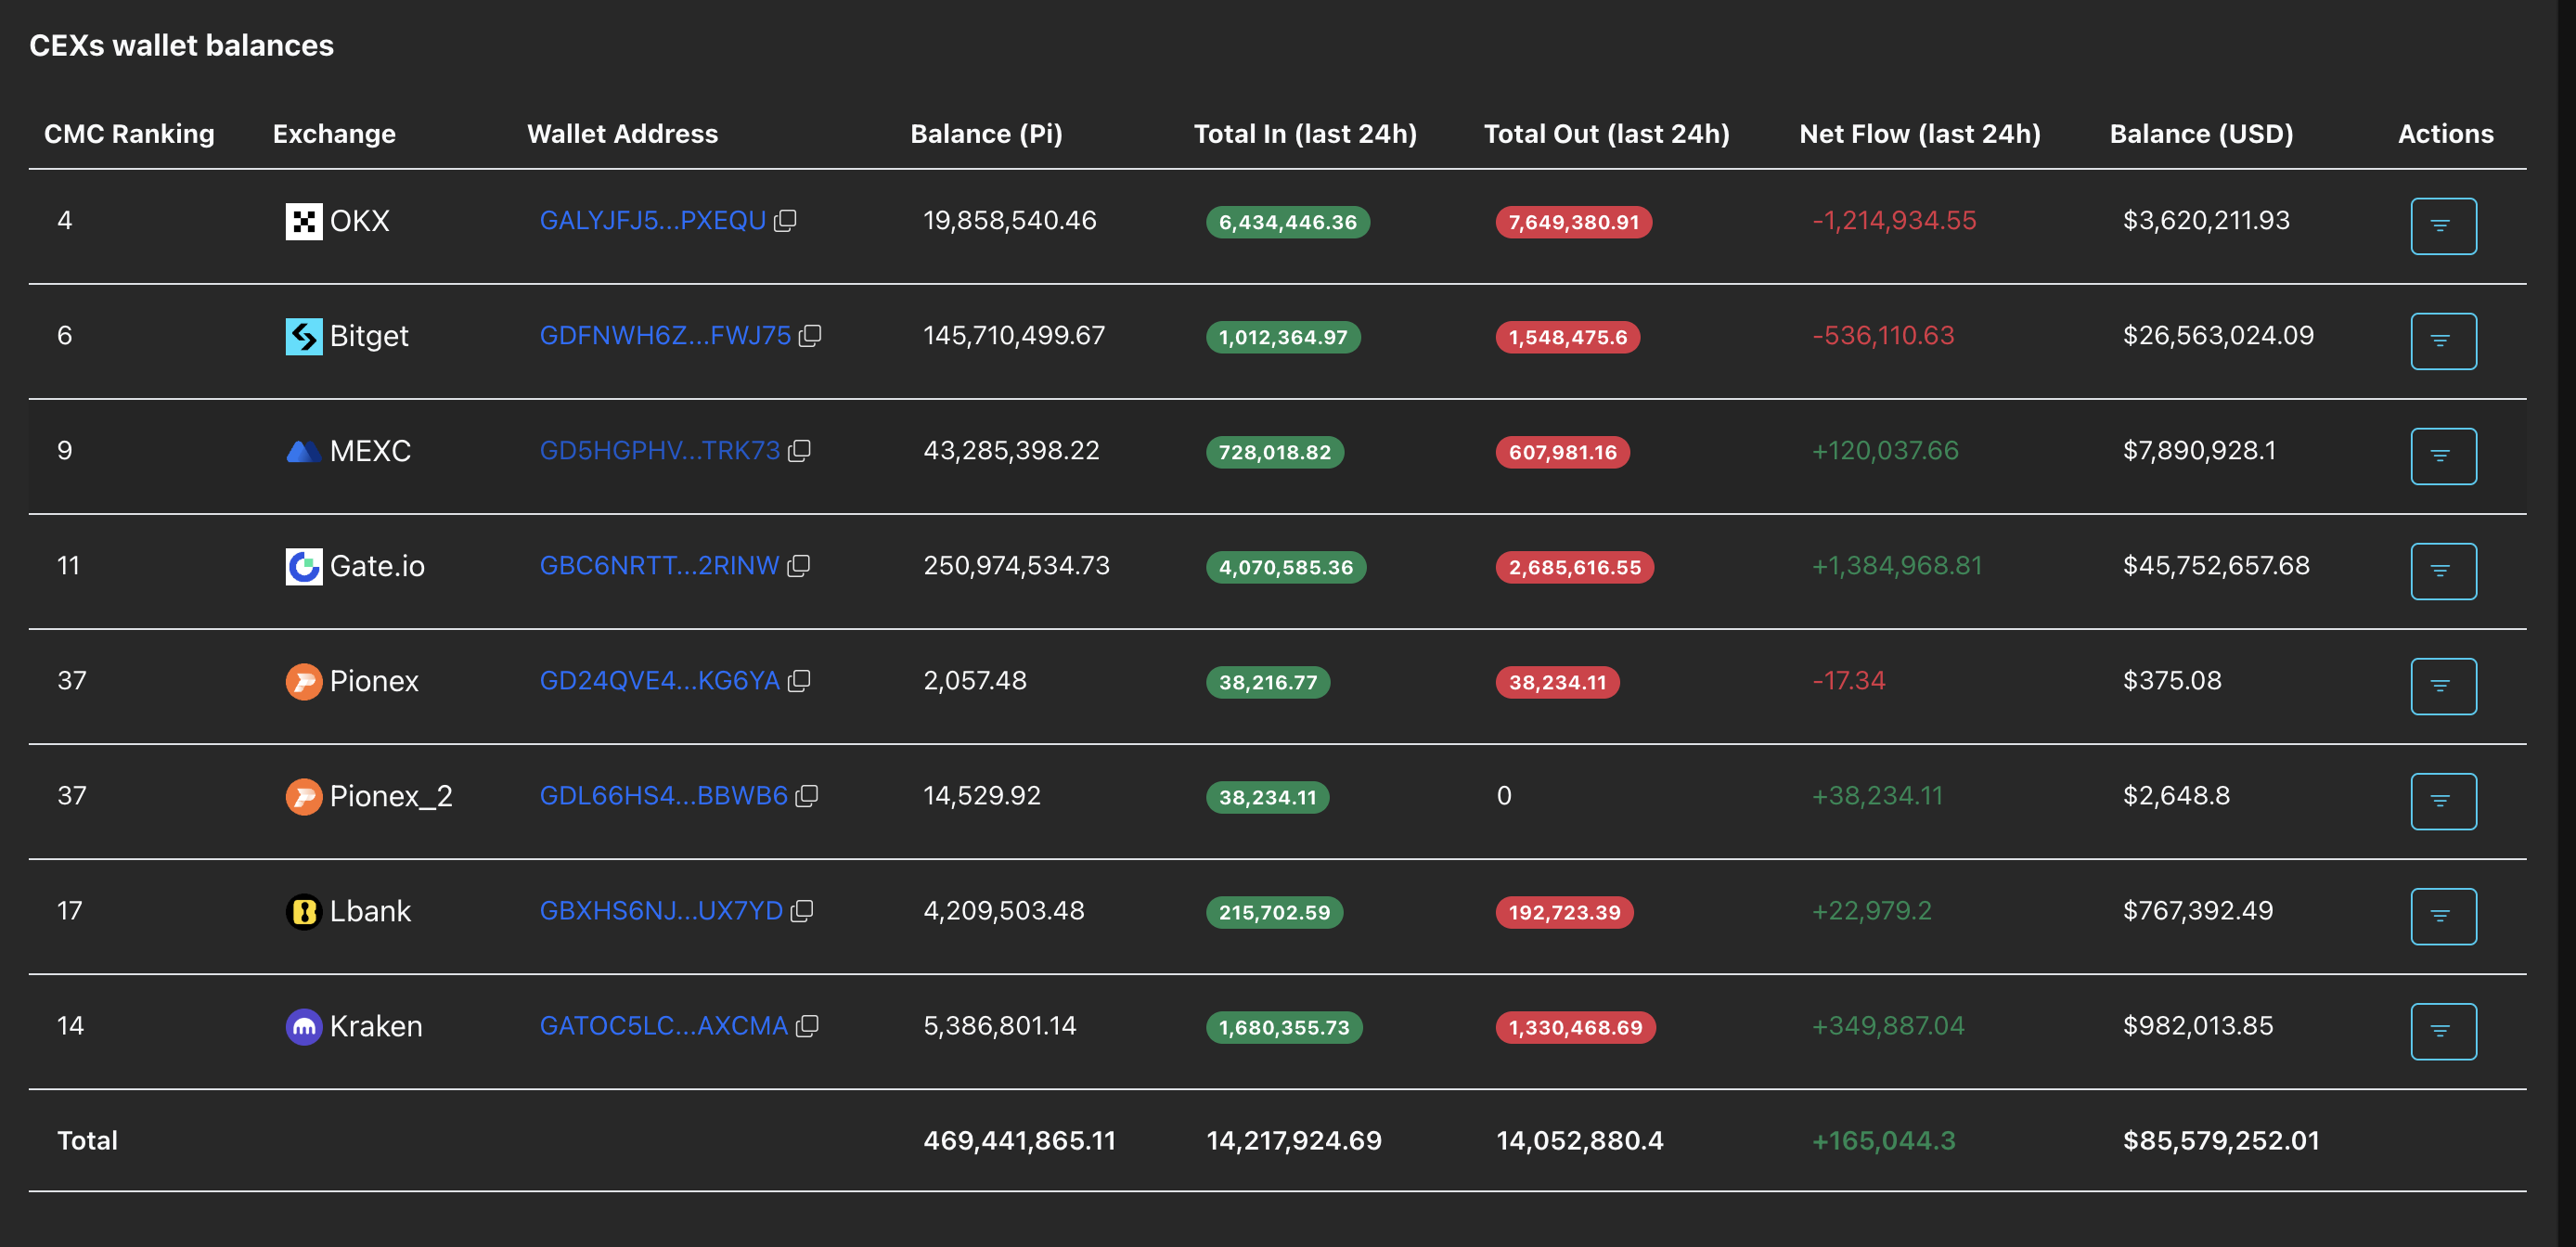
- PiScan data adds Kraken and LBank to the official Centralized Exchange list, while inflows reflect profit-taking slowing down.
- The technical outlook is cautiously optimistic as RSI and MACD indicators signal looming downside pressure.
Pi Network (PI) edges higher on Friday, showing early signs of recovery after a bearish start to the week, signaling a cooldown in the profit-taking phase. The technical outlook for PI is cautiously bullish as the recovery run faces clusters of resistance.
Kraken joins the PiScan CEX list
PiScan adds Kraken and LBank to the list of official Centralized Exchanges (CEXs) supporting the PI token trading. Data shows a minor net inflow of 165,044 PI tokens across all CEXs over the last 24 hours, reaffirming the cooling of the profit-taking narrative. If the net flow turns negative, it would indicate a rise in buying pressure, reflecting increased investor support for the near-term recovery.
Technical outlook: Will PI extend its recovery above $0.20?
Pi Network is up 3% at press time on Friday, extending the 1% gains from the previous day. The near-term bias is neutral with a slight bearish tilt as the PI token nullified the descending resistance trendline breakout with a 10% drop on Tuesday, suggesting the breakout lacks follow-through for now. Additionally, the altcoin trades below the 50-day Exponential Moving Average at $0.1885, acting as nearby dynamic resistance and sitting below the 200-day EMA, keeping the broader trend bearish.
The Moving Average Convergence Divergence (MACD) line sits below its Signal line and below the zero mark, with a negative histogram expanding, indicating strengthening downside momentum after the recent failure to sustain gains above $0.2300. The Relative Strength Index at 47 remains below the 50 midline, reinforcing fading bullish pressure after overbought readings earlier in the month.
If PI exceeds the overhead average, it could test the recent swing high at the $0.2000 psychological level. A push above this level would expose further resistance at $0.2396, where sellers capped gains on March 7.
On the downside, immediate support appears at the recent low near $0.1736, where buyers stabilized declines this week. A decisive drop below this level would strengthen the bearish case and risk a deeper extension toward the February 23 low at $0.1556.
(The technical analysis of this story was written with the help of an AI tool.)

يعتمد أكثر من مليون مستخدم على FXStreet للحصول على بيانات سوقية لحظية، وأدوات رسوم بيانية، ورؤى خبراء، وأخبار الفوركس. يساعد تقويمهم الاقتصادي الشامل والندوات التعليمية عبر الويب المتداولين على البقاء على اطلاع واتخاذ قرارات محسوبة. لدى FXStreet فريق يضم حوالي 60 محترفًا موزعين بين مقر برشلونة ومناطق عالمية مختلفة.
اقرأ المزيد


