
Pi Network Price Forecast: PI struggles as fear grips the crypto market
بواسطة Vishal Dixit
تاريخ النشر: 26 Jan 2026 | تاريخ التعديل: 26 Jan 2026


المقالات الشائعة

Pi Network (PI) hovers above $0.1700 at press time on Monday, stabilizing after the 5% decline on Sunday.
- Pi Network trades below $0.1800 after a 5% drop on Sunday, extending the support-discovery mode.
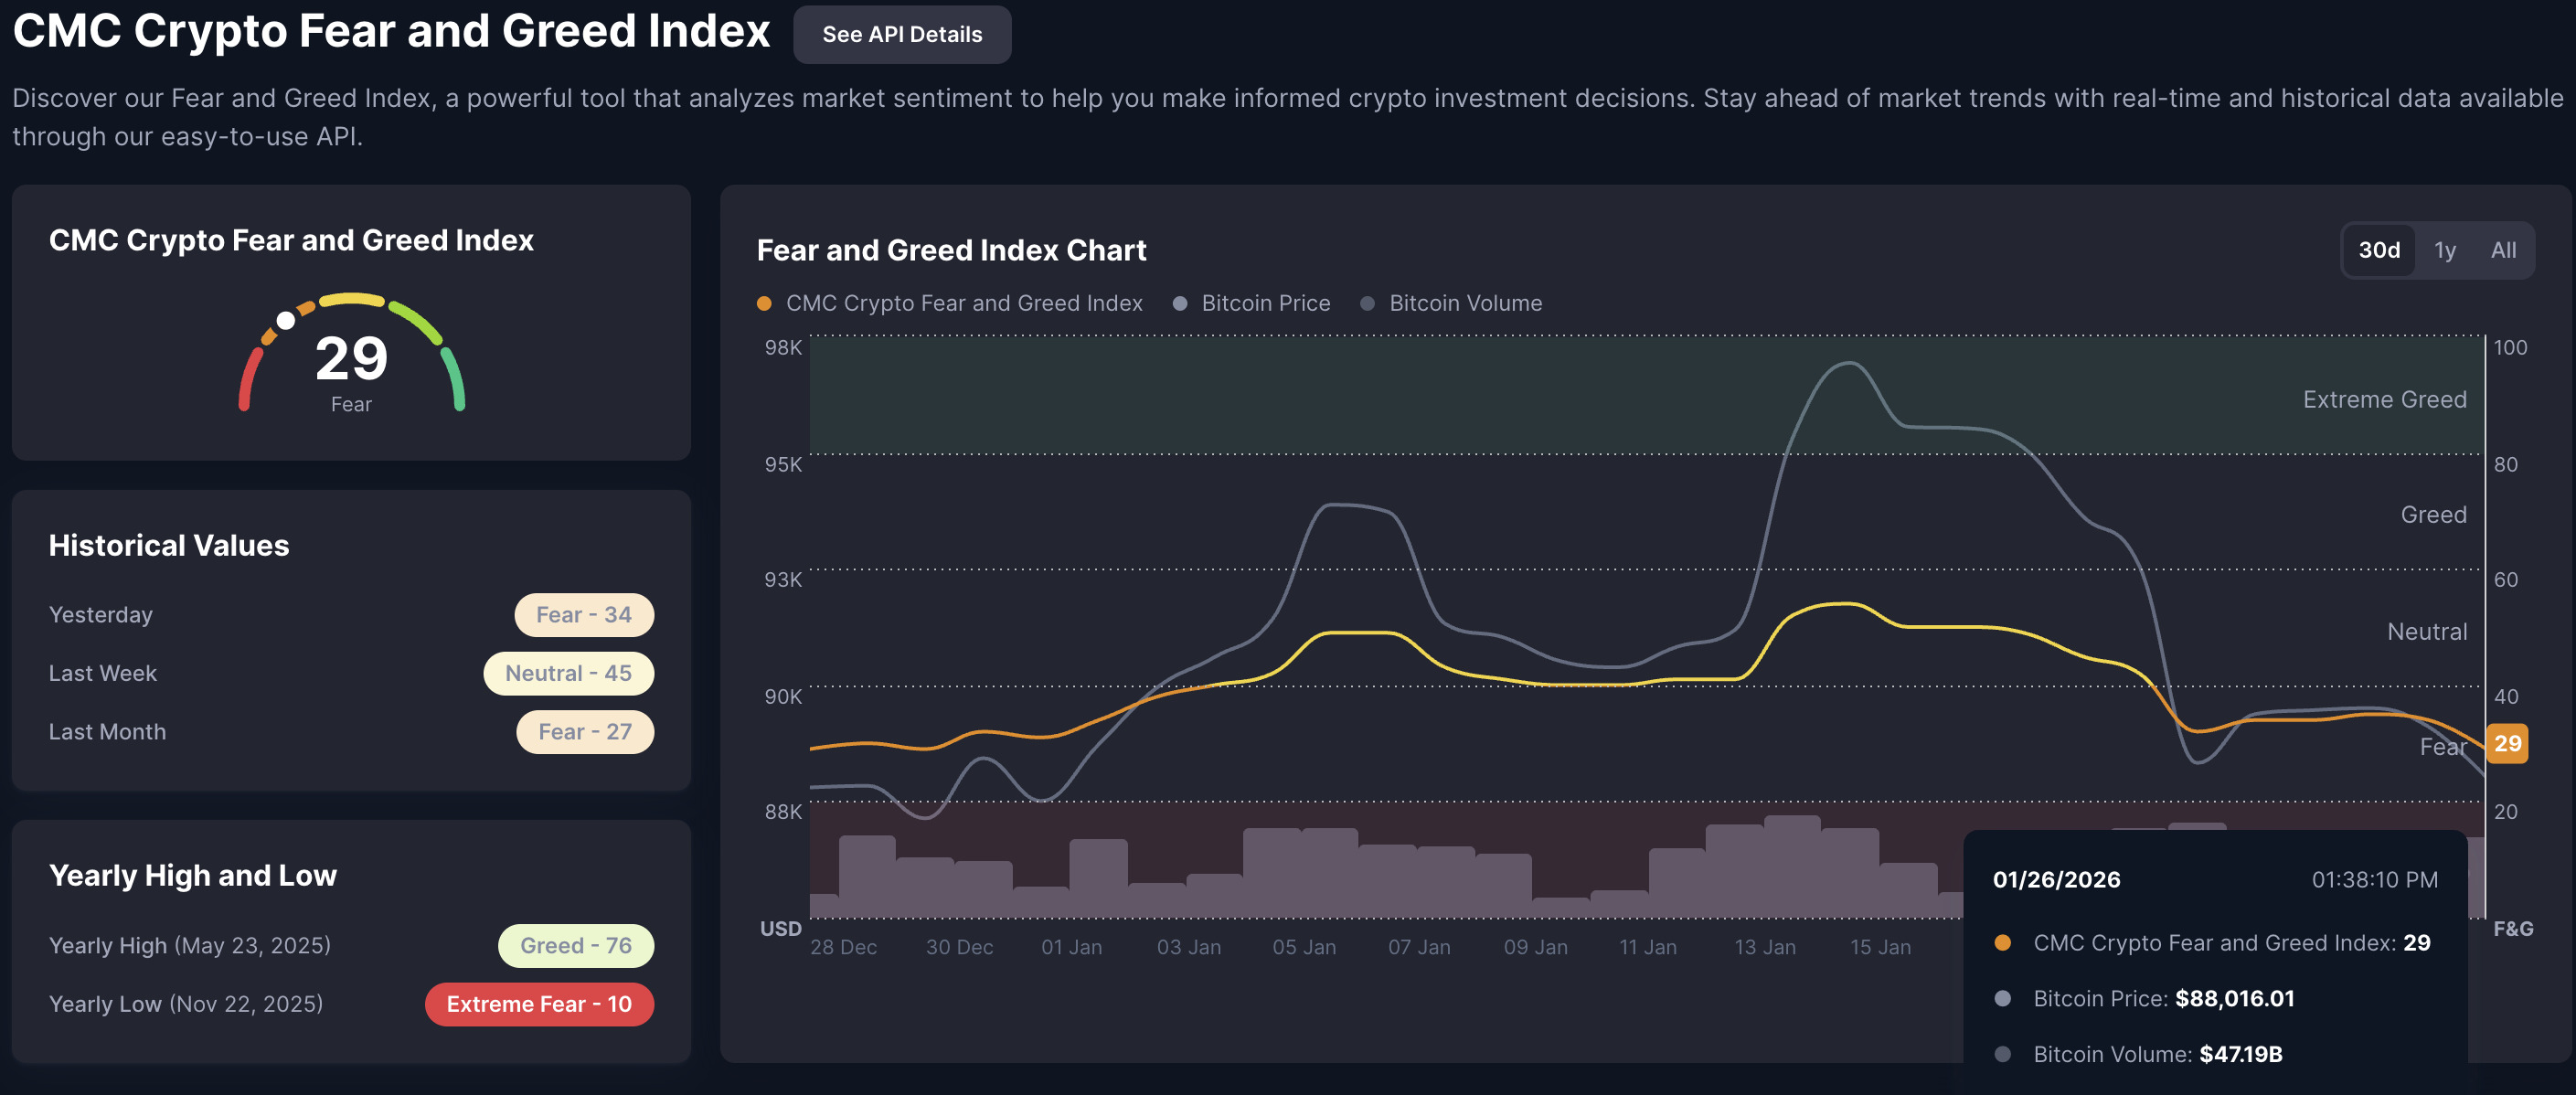
- Risk-averse sentiment rises in the broader cryptocurrency market, evidenced by the Fear and Greed Index.
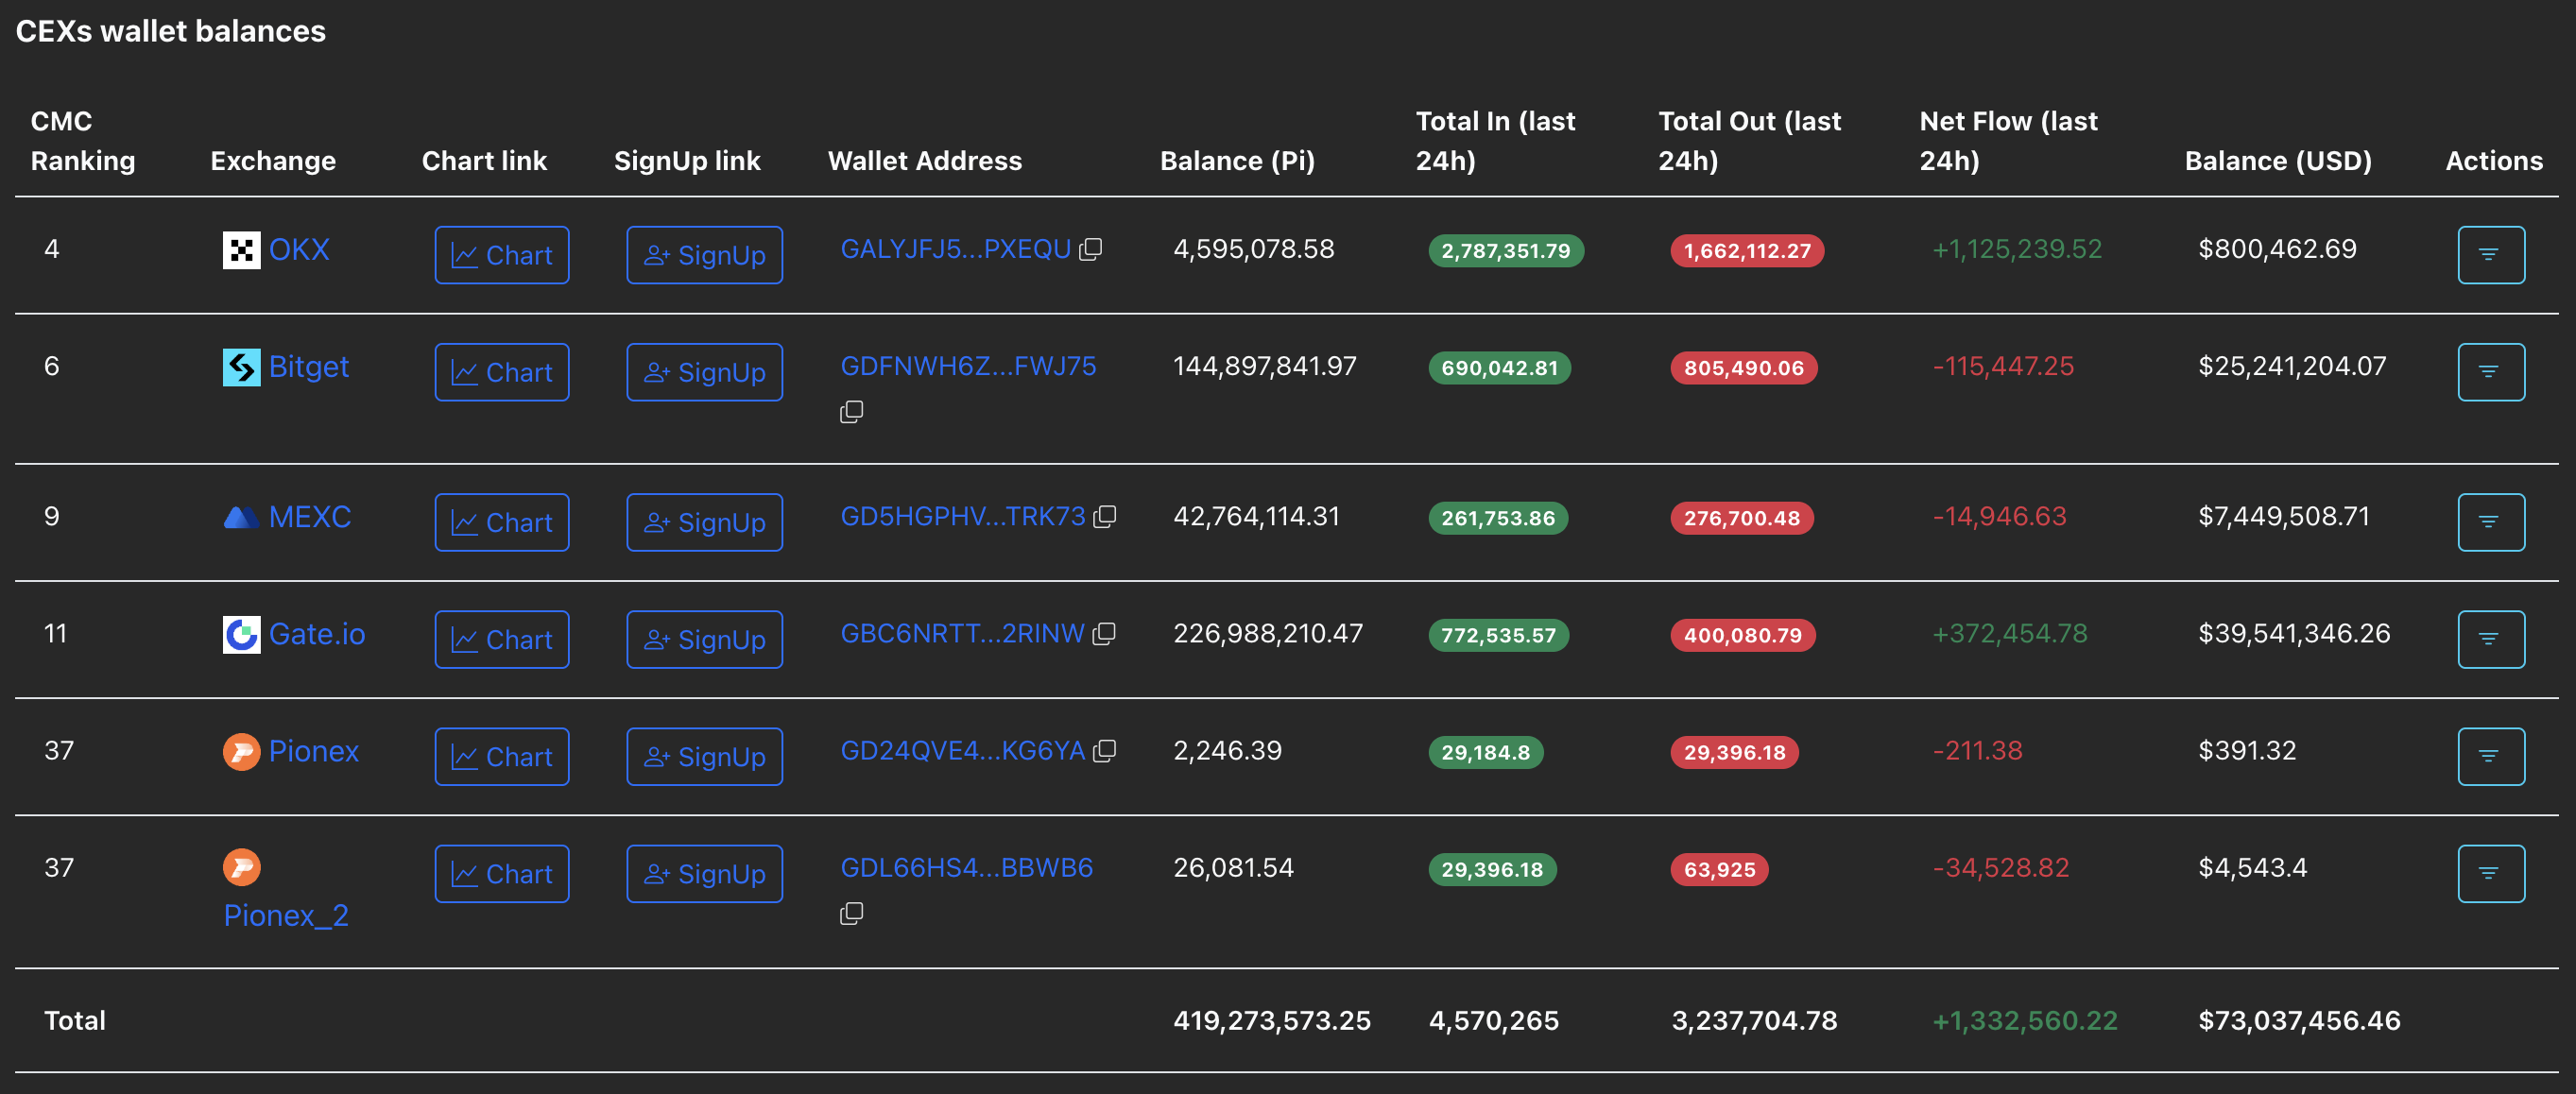
- PiScan data shows over 1.3 million PI tokens inflows on centralized exchanges in the last 24 hours, reflecting heightened selling pressure.
Pi Network (PI) hovers above $0.1700 at press time on Monday, stabilizing after the 5% decline on Sunday. The PI token remains under intense pressure amid risk-averse conditions in the broader cryptocurrency market and over 1.3 million tokens inflows on Centralized Exchanges (CEXs) in the last 24 hours.
Pi Network loses investors' interest as the market declines
CoinMarketCap’s fear and greed indicator at 29 suggests a risk-off sentiment among investors. A reading between 20 and 40 indicates fear, while a drop below 20 would flash extreme fear, signaling a massive selloff in the crypto market.
PiScan data shows a steady increase in deposits made across CEXs, totaling 1.33 million PI tokens over the last 24 hours. OKX exchange recorded 1.12 million in inflows, the largest among the Know-Your-Business (KYB) registered exchanges supporting the Pi token.
Sustained deposits on CEXs while fear grips the broader cryptocurrency market could lead to further losses for Pi Network.
Technical outlook: Will PI extend the decline to $0.15?
Pi Network is up 1% at the time of writing on Monday, recovering from the 5% decline on Sunday. Still, the PI token remains under pressure from an over 13% loss last week.
The Relative Strength Index (RSI) is at 22 on the daily chart, trending deep into the oversold zone, indicating intense supply pressure. The Moving Average Convergence Divergence (MACD) remains below the signal line and under the zero mark, suggesting persistent bearish momentum.
If sellers uphold control, PI is likely to extend the decline toward the January 19 low at $0.1502.
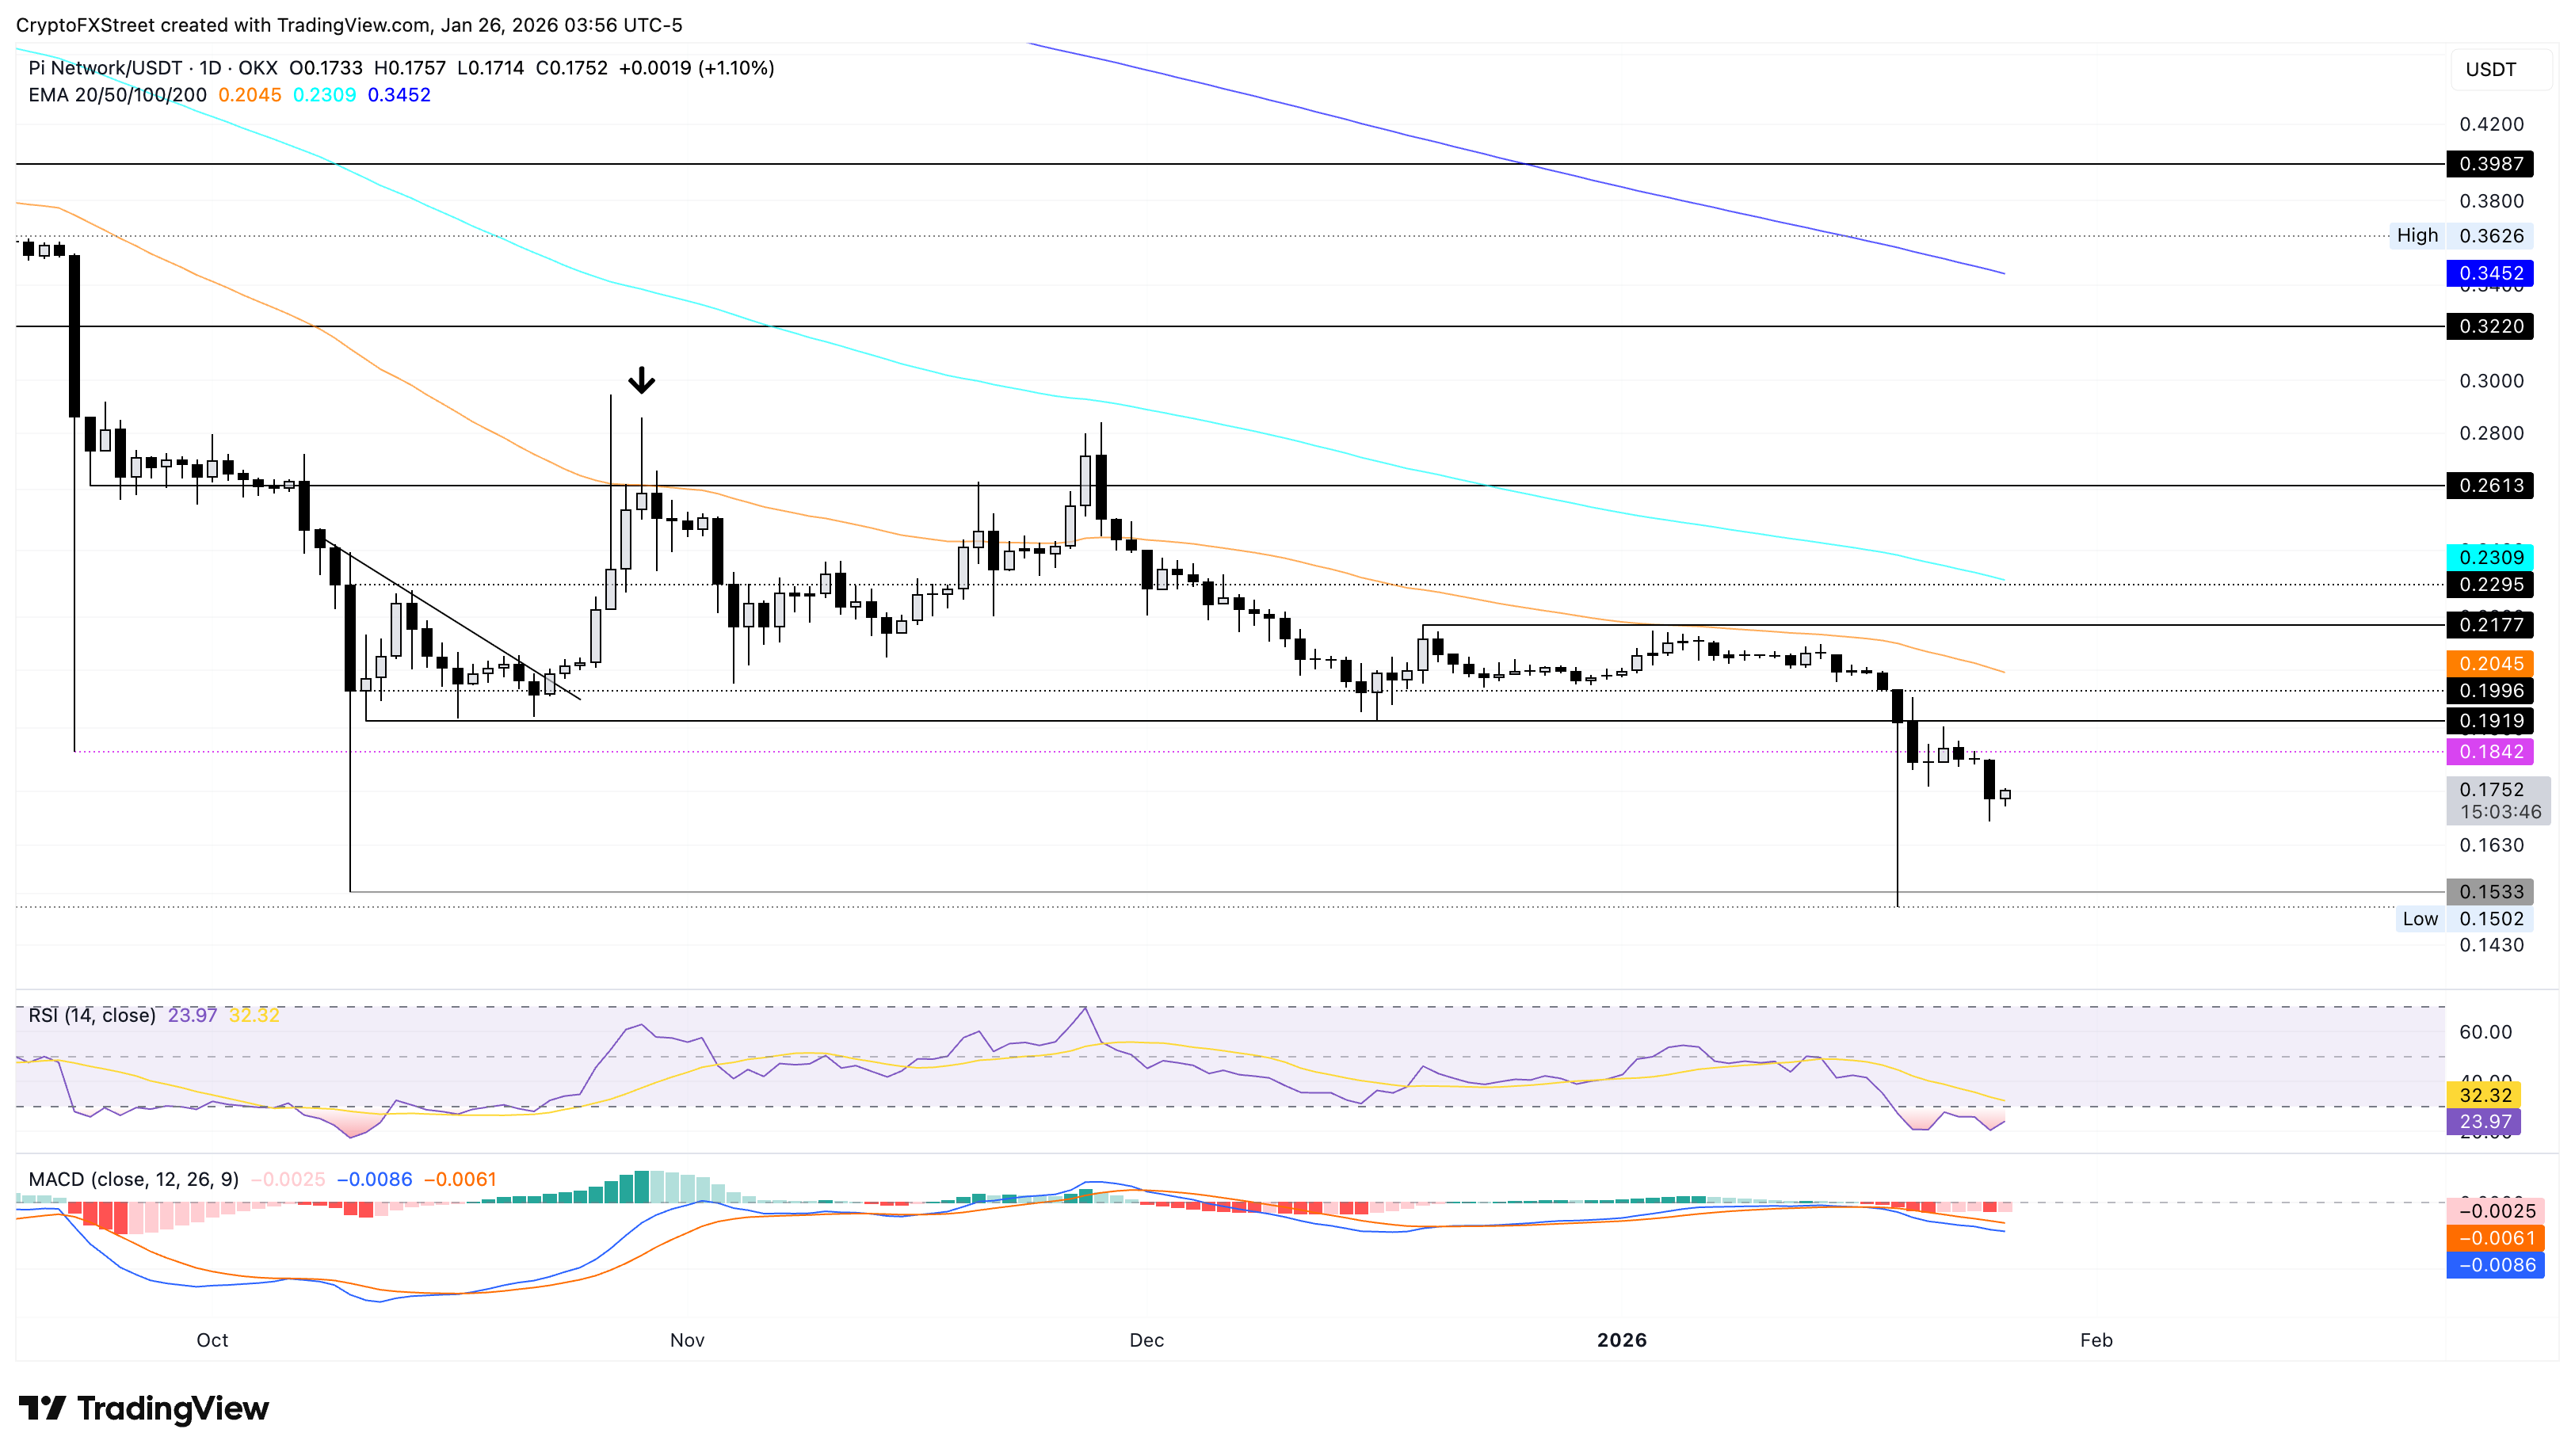
However, sustained recovery in PI could test the $0.2000 psychological milestone, which is close to the 50-day Exponential Moving Average (EMA) at $0.2045.

يعتمد أكثر من مليون مستخدم على FXStreet للحصول على بيانات سوقية لحظية، وأدوات رسوم بيانية، ورؤى خبراء، وأخبار الفوركس. يساعد تقويمهم الاقتصادي الشامل والندوات التعليمية عبر الويب المتداولين على البقاء على اطلاع واتخاذ قرارات محسوبة. لدى FXStreet فريق يضم حوالي 60 محترفًا موزعين بين مقر برشلونة ومناطق عالمية مختلفة.
اقرأ المزيد


