

Render Price Forecast: Four-day rally eyes breakout potential to $3
- Render is up 7% so far on Tuesday, extending its fourth consecutive day of recovery to a four-month high.
- On-chain data shows a surge in network activity and growth, supporting the price surge.
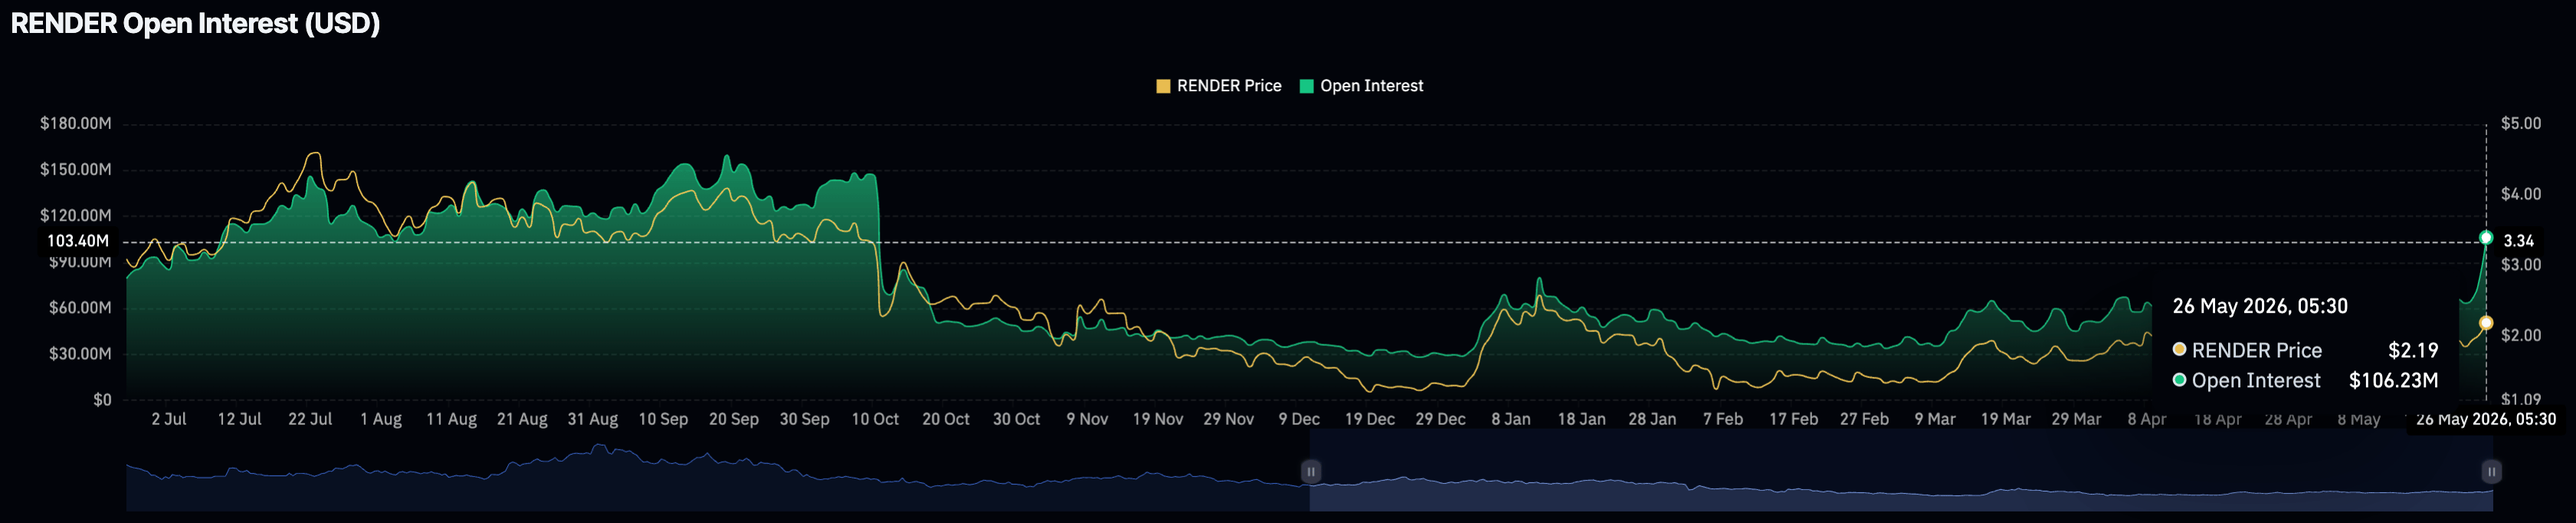
- Render Open Interest hits a seven-month high, reflecting intense retail demand.
Render (RENDER) is up 7% at press time on Tuesday, extending a four-day rally with over 25% gains so far. A surge in wallet- and leverage-driven trading activity bolsters the rally, reflecting increased retail demand for the AI token. Render should secure a daily close above $2.40 to confirm the bullish breakout of a rising channel pattern.

Render joins the AI craze
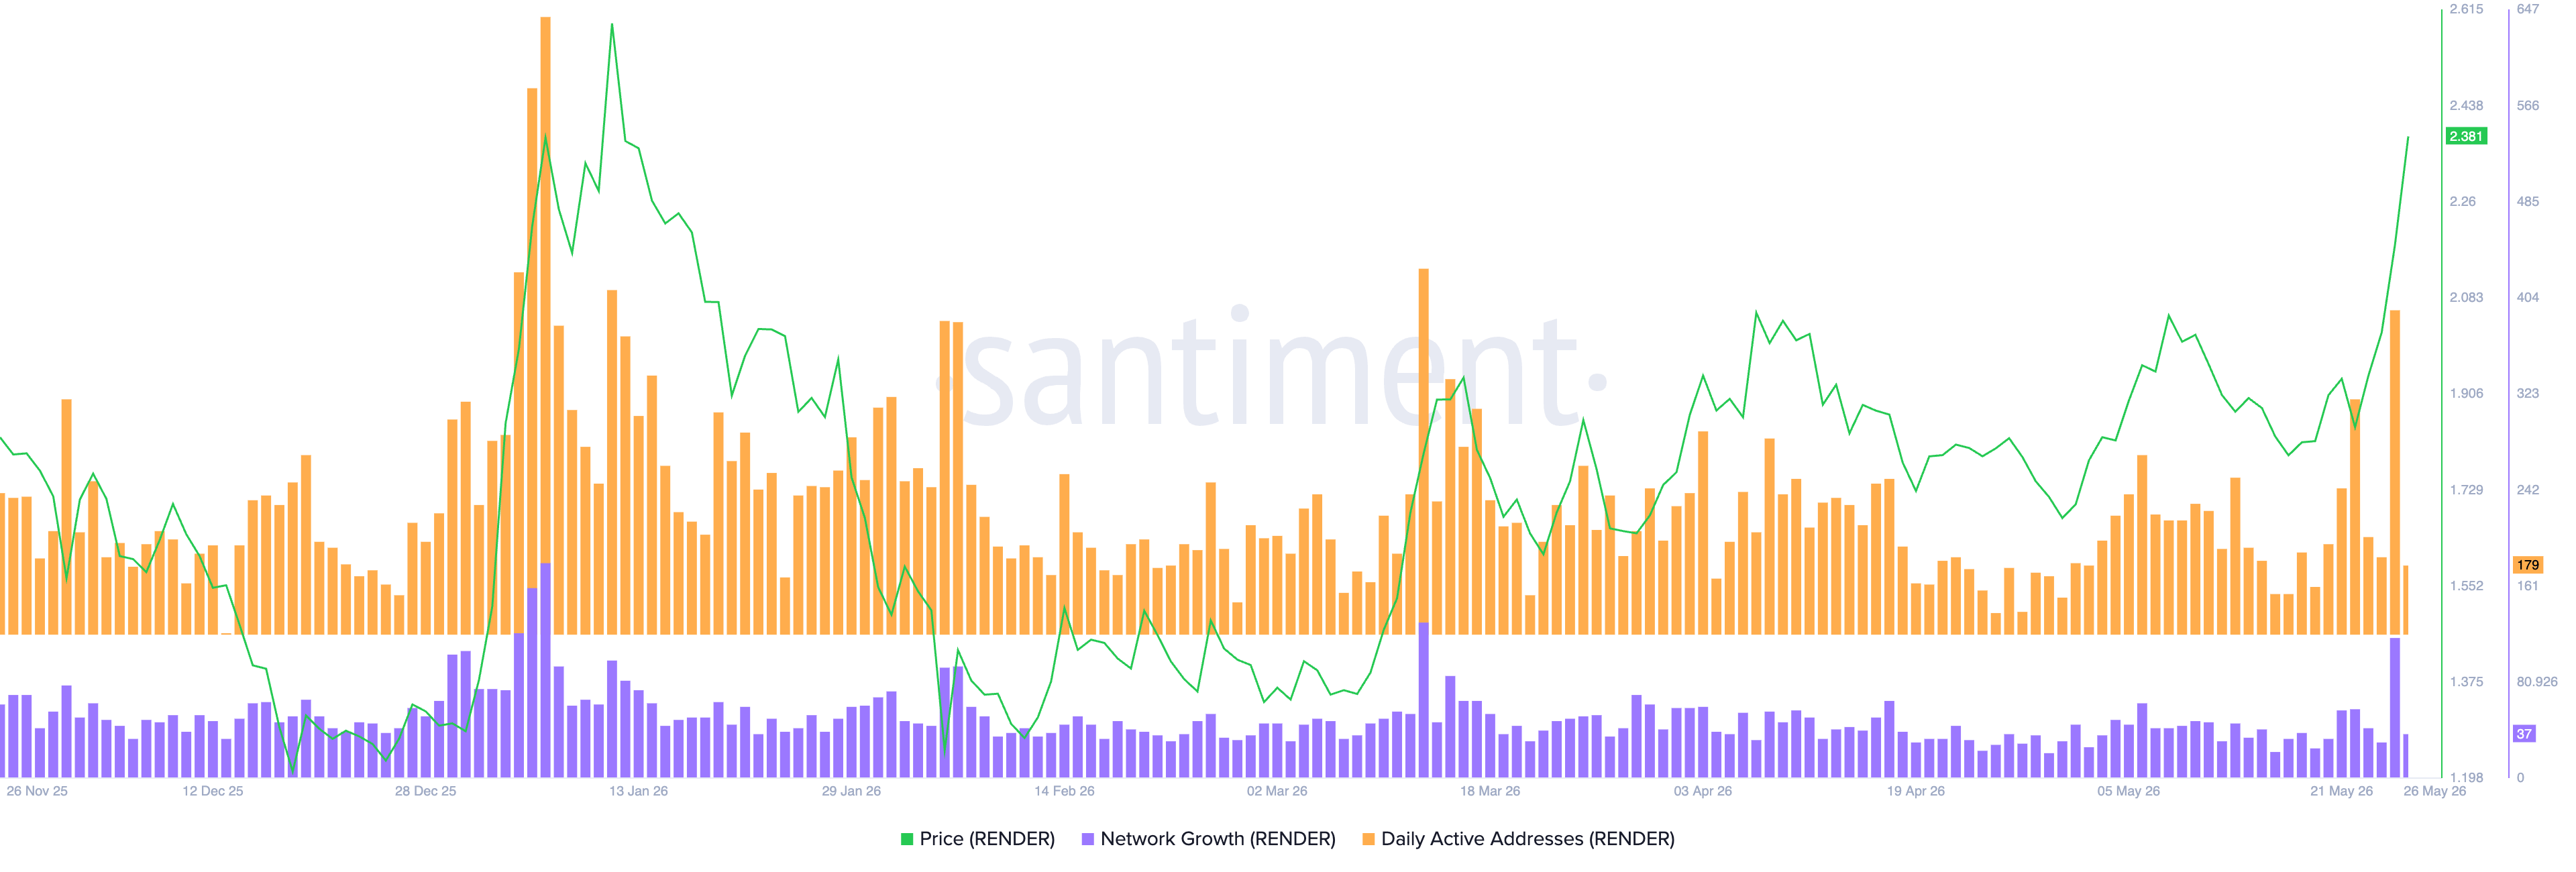
The Render network is heating up with a fresh surge in wallet activity as the broader market interest in AI crypto tokens rises. Santiment data shows the daily active addresses hit a two-month high of 394 on Monday, up from 186 addresses the previous day, suggesting a surge in user activity.
At the same time, network growth surged to 118, which reflects the number of new wallets joining Render. A surge in Render’s on-chain users implies its entry into the AI crypto rally.
On the derivatives side, the AI token is gaining traction among retail investors. CoinGlass data shows a spike in RENDER futures Open Interest (OI) to $106.23 million on Tuesday, up from $78.38 million the previous day. Typically, an increase in OI that coincides with a price surge reflects a positional buildup in anticipation of further upside.
Render eyes breakout potential to $3
Render trades above $2.35 at press time on Tuesday, extending a four-day bullish phase. The AI token holds well above the 50-, 100-, and 200-day Exponential Moving Averages (EMAs), reaffirming a bullish bias.
Render's four-day rally tests the 78.6% Fibonacci retracement level at $2.37, measured from the $2.71 high to $1.12 low. This level coincides with an ascending trendline connecting the January 31 and April 7 highs, near $2.40. A decisive close above this zone would open the path toward $2.71 and the 127.2% Fibonacci extension level at $3.14.
The Moving Average Convergence Divergence (MACD) rises above its signal line on the daily chart as buying pressure grows. At the same time, the Relative Strength Index at 74 signals strong but overbought momentum, suggesting the advance may be prone to a corrective pullback.
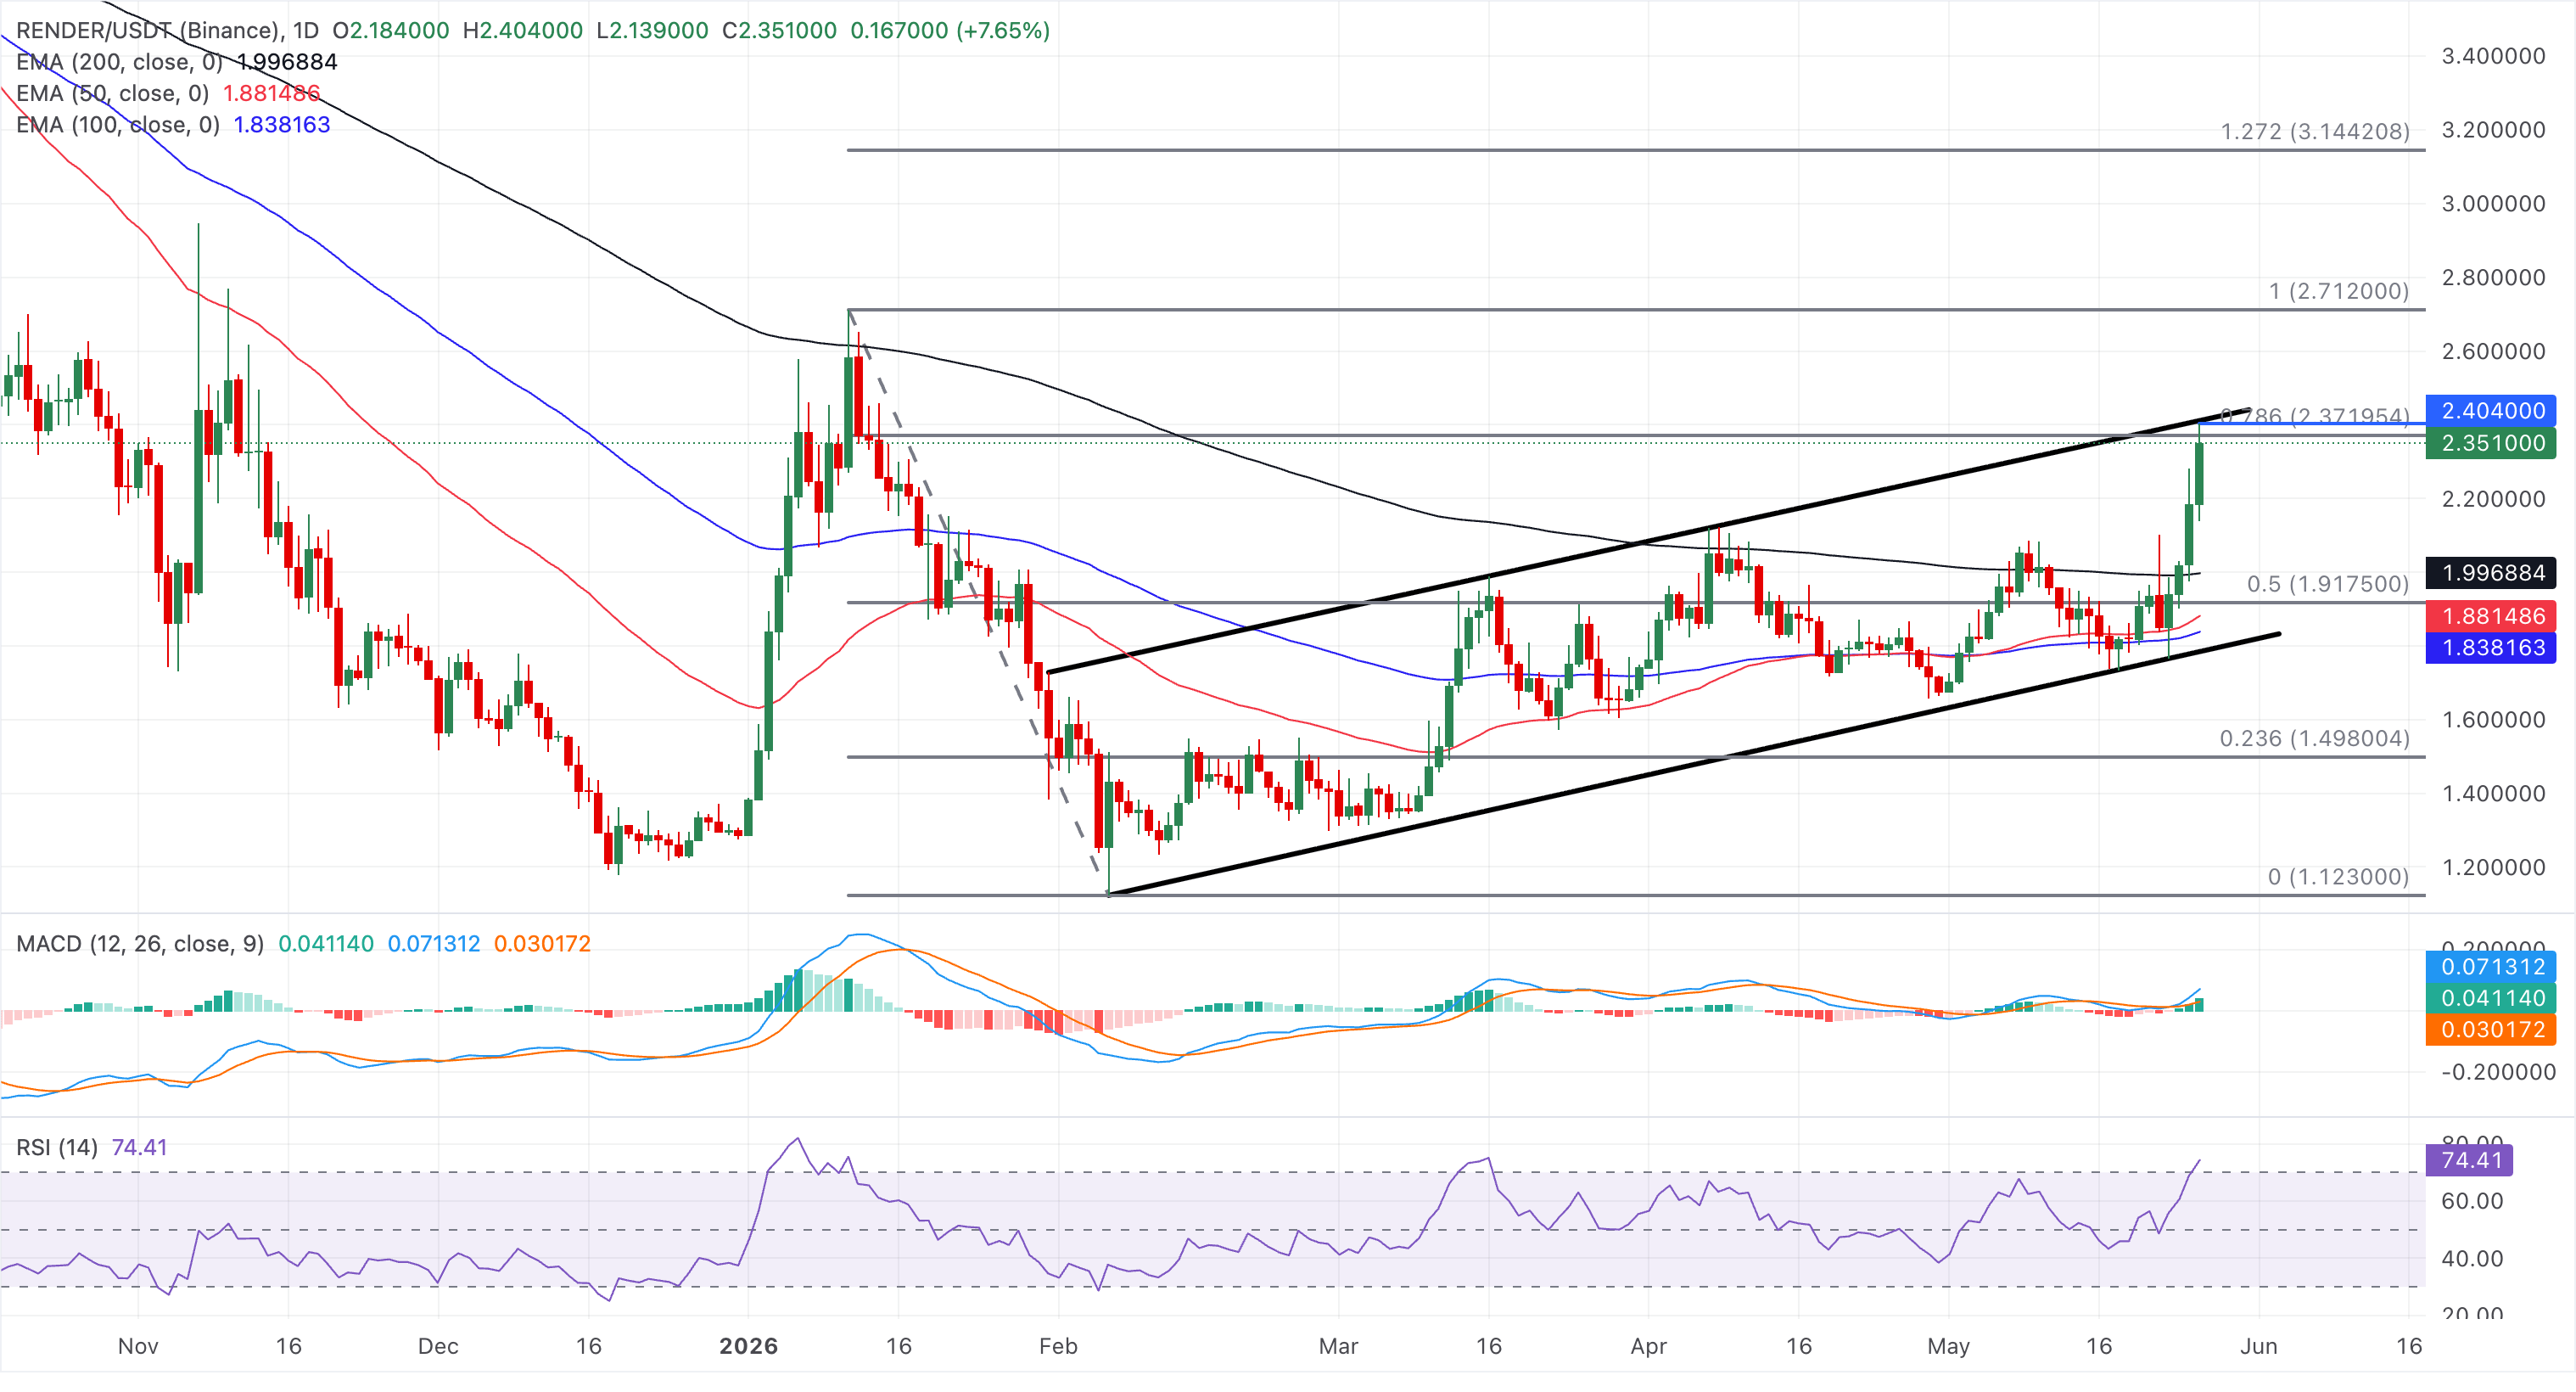
On the downside, initial support is seen around the 200-day EMA near $1.99 and the 50% retracement at $1.91, reinforcing the broader bullish structure.
(The technical analysis of this story was written with the help of an AI tool.)














