
XRP steadies near $2.10 as ETFs attract inflows, retail demand subdued
بواسطة John Isige
تاريخ النشر: 8 Dec 2025 | تاريخ التعديل: 8 Dec 2025


المقالات الشائعة

Ripple (XRP) is trading at around $2,10 at the time of writing on Monday, after bouncing off its short-term support at $2.00.
- XRP trades near $2.10 as bulls aim for a breakout above the 50-day EMA.
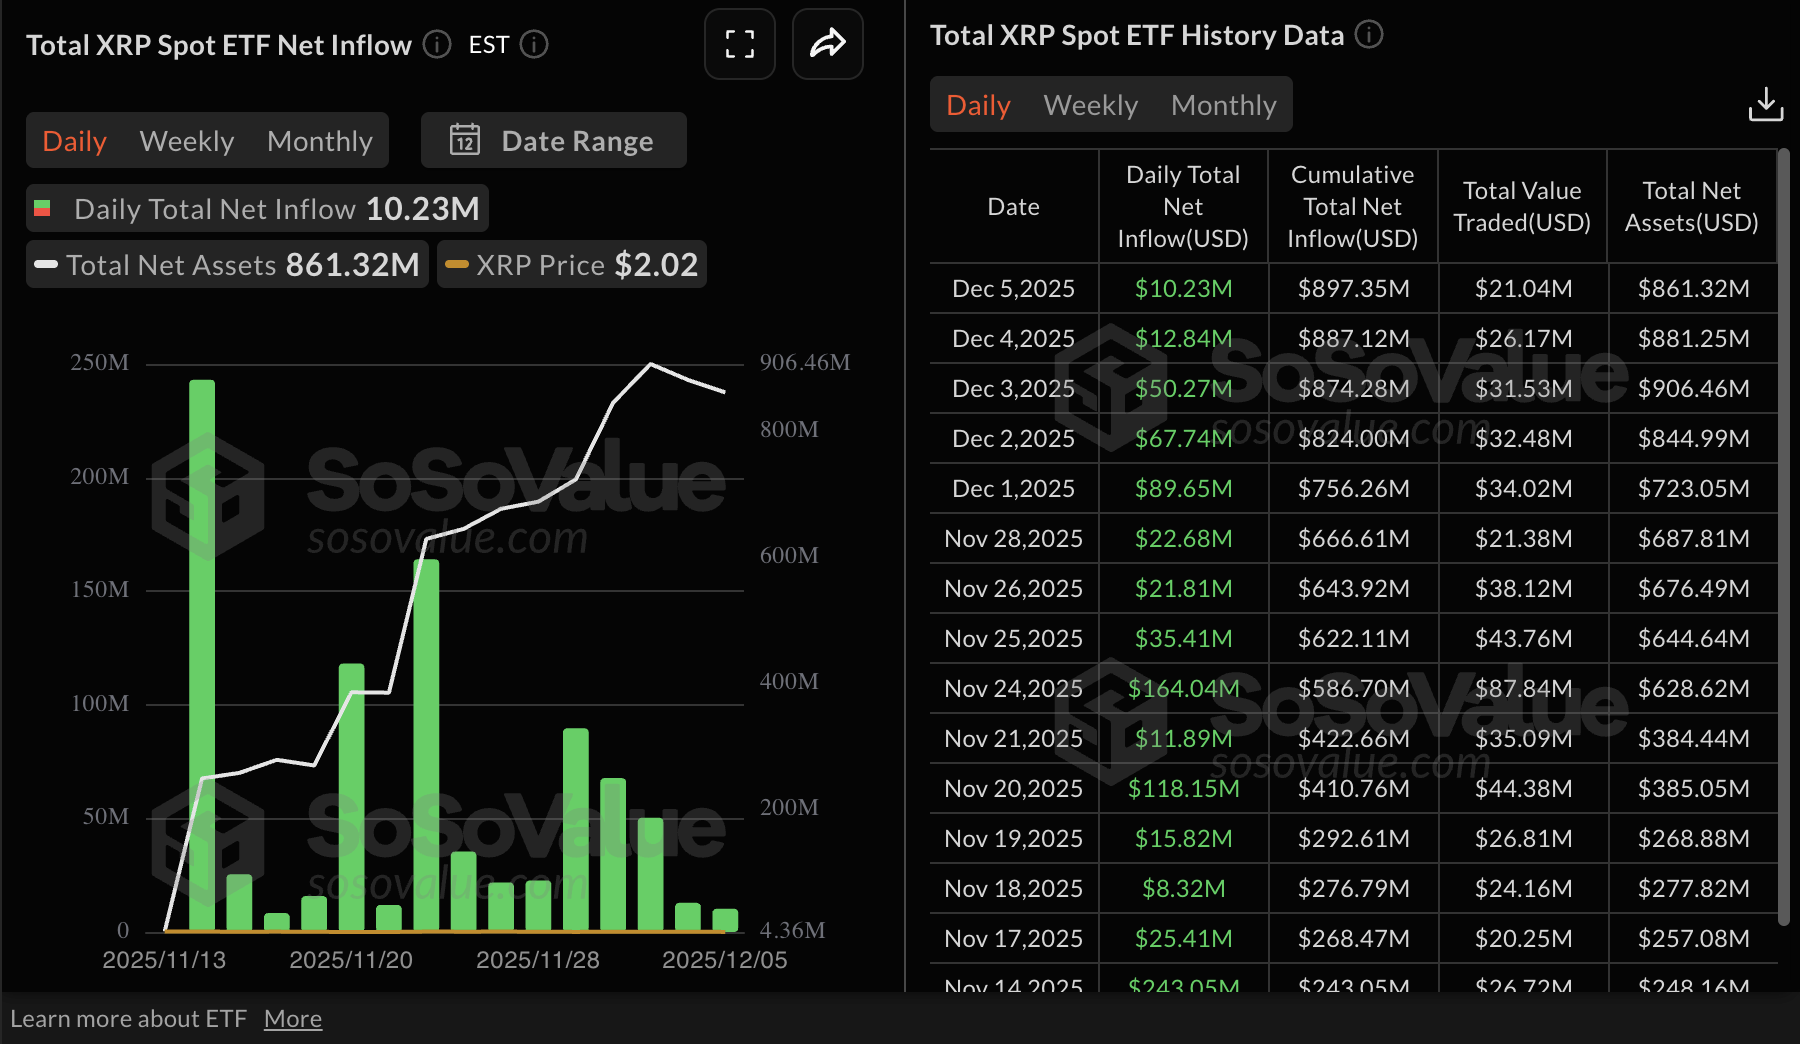
- XRP spot ETFs extend inflow streak for 15 consecutive days, signaling steady institutional demand.
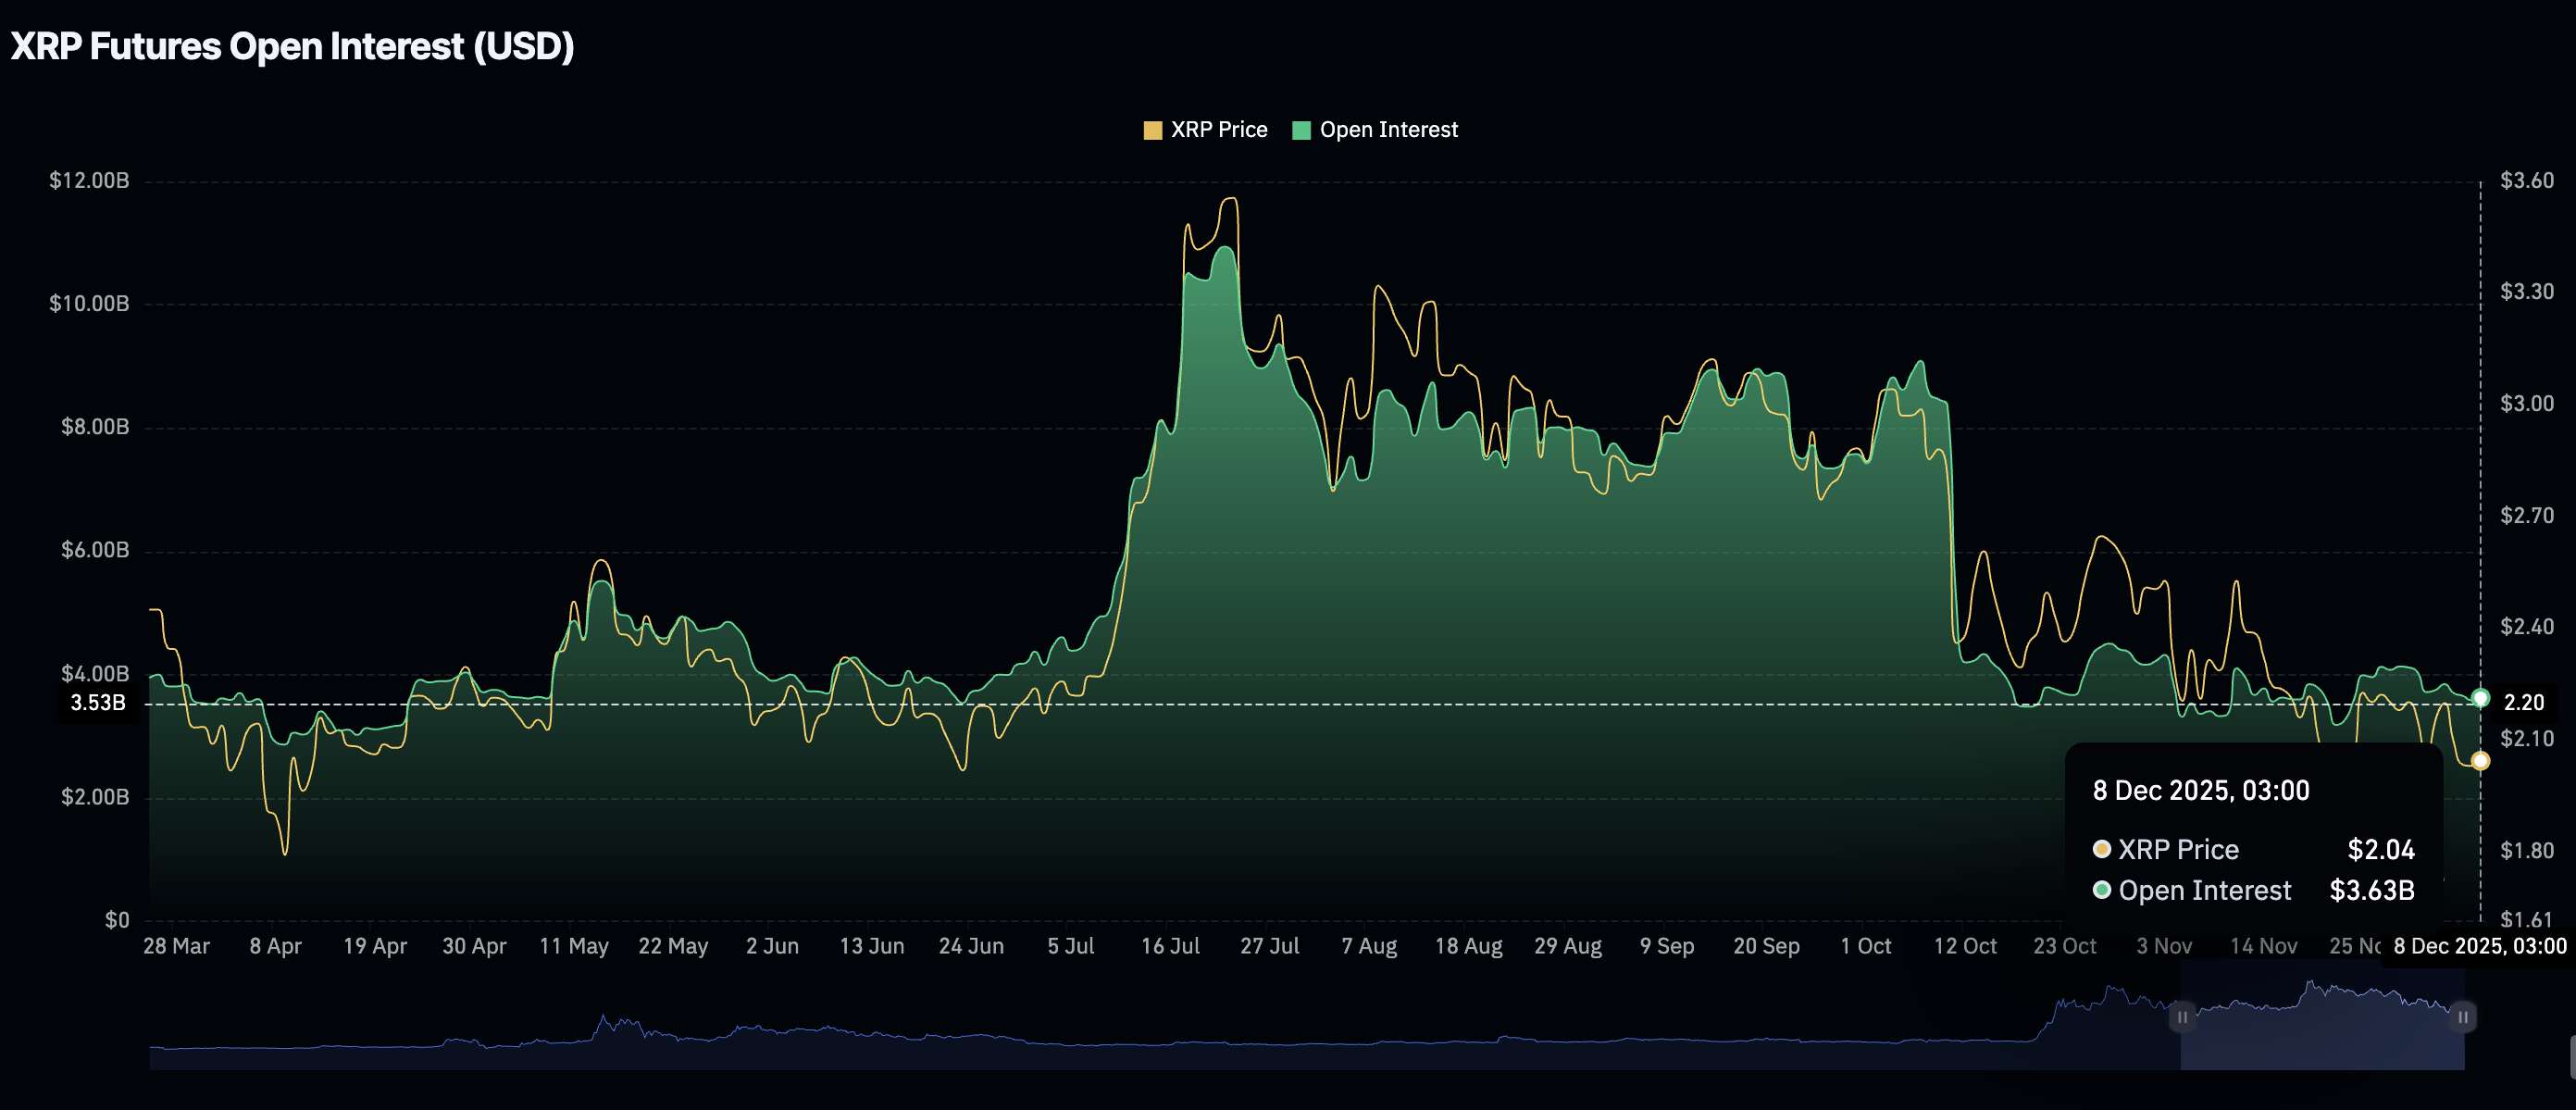
- Retail demand remains weak, with futures Open Interest averaging $3.63 billion.
Ripple (XRP) is trading at around $2,10 at the time of writing on Monday, after bouncing off its short-term support at $2.00. The cross-border remittance token has continued to receive steady support from institutional investors through spot Exchange Traded Funds (ETFs) listed in the United States (US), although this has failed to materialize into a substantial price increase for the token.
Traders should remain cautious considering XRP showcases a weak derivatives market.
XRP ETFs extend inflow streak
Demand for XRP spot ETFs has remained steady since their debut on November 13. SoSoValue data shows that US-listed XRP ETFs posted approximately $10 million in inflows on Friday. This extended the inflow streak to 15 days, bringing the cumulative inflow volume to $897 million and net assets to $861 million.
Steady ETF inflows increase buying pressure, bolstering the case for XRP and supporting a bullish outlook.
Four XRP ETFs operate in the US, including Canary Capital’s XRPC, Grayscale’s GXRP, Bitwise’s XRP and Franklin Templeton’s XRPZ.
Meanwhile, retail demand has remained significantly suppressed for almost two months. CoinGlass data shows that XRP futures Open Interest (OI) stands at $3.63 billion on Thursday, up slightly from $3.59 billion on Sunday.
Despite the minor increase in OI, which represents the notional value of outstanding futures contracts, the derivatives market is lagging those levels seen before the October 10 deleveraging event (OI of $8.36 billion) and its record high of July 22 ($10.94 billion).
This massive decline underscores the low retail interest. Investors are staying on the sidelines, not convinced that XRP can sustain an uptrend in the short term.
Technical outlook: XRP consolidating gains
XRP is trading at $2.09, with the price sitting below the falling 50-day Exponential Moving Average (EMA) at $2.27. The 100-day EMA at $2.43 and 200-day EMA at $2.47 also slope lower, maintaining a bearish bias and capping rebounds.
The Relative Strength Index's recent uptick on the daily chart suggests fading downside pressure, but the indicator remains at 45 (neutral-bearish). The descending trend line from XRP's record high of $3.66 also limits gains, with resistance at $2.60. The Parabolic SAR has flipped below price, placing a trailing support near $1.90, though bears retain control while the pair trades under the moving averages.
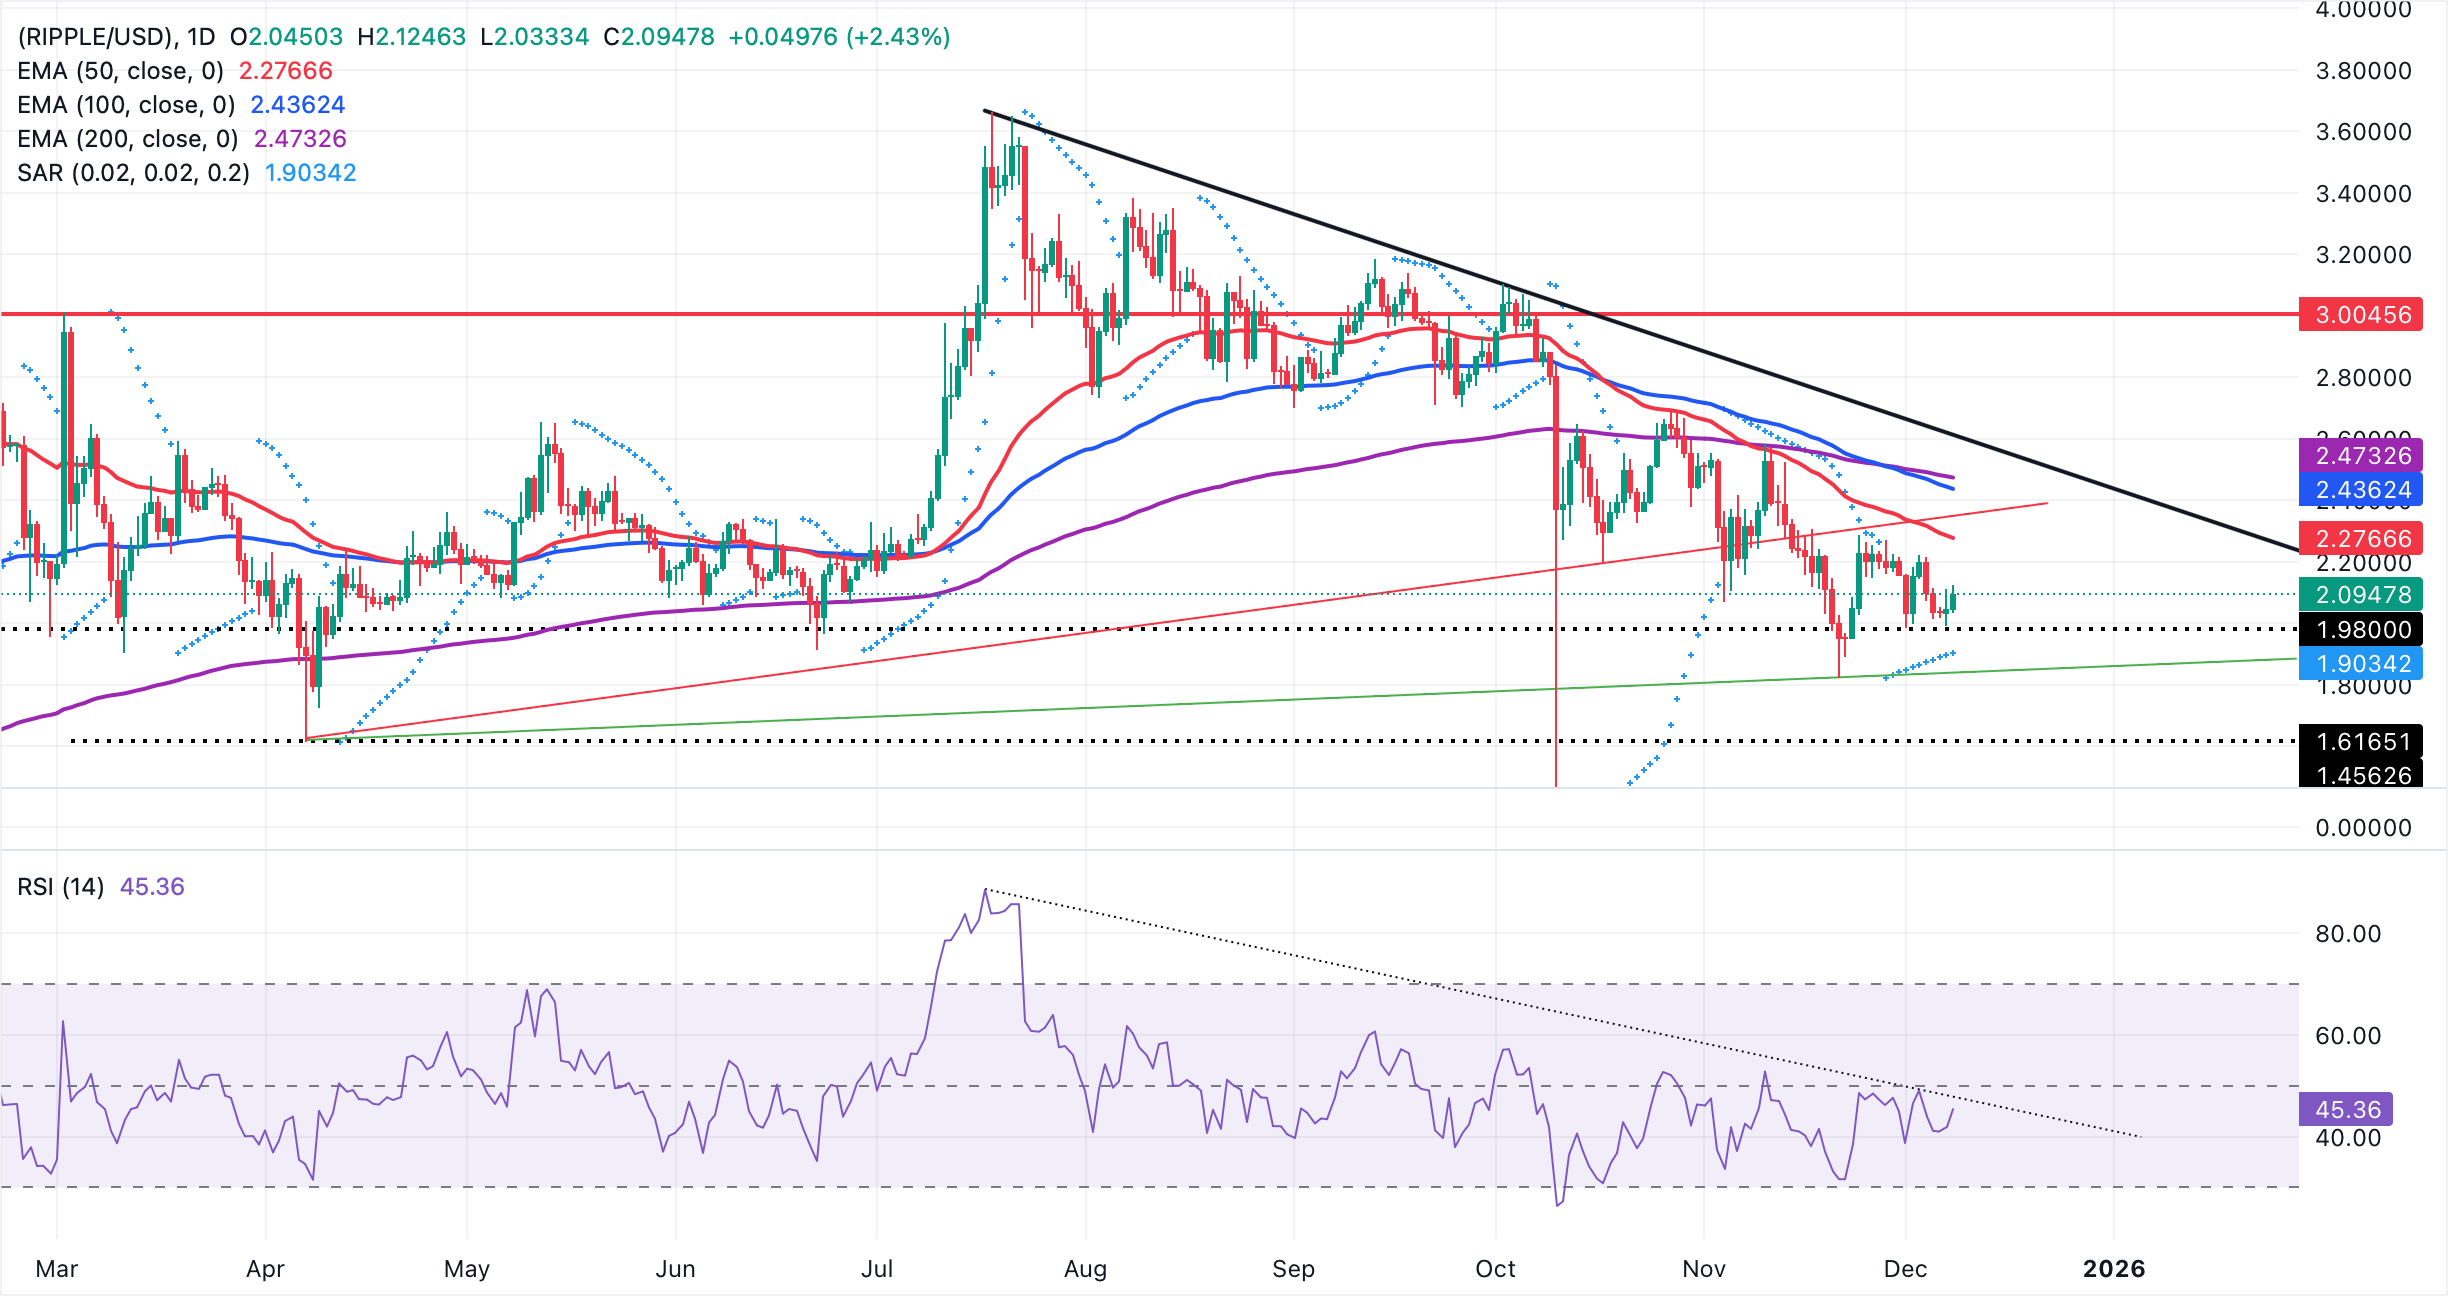
A close above the 50-EMA at $2.27 could open the path toward the descending trendline barrier at $2.60. The rising trend line (green) from $1.62 underpins the medium-term bias, offering support on dips. Holding the $1.90–$1.83 support band would allow a base to form a recovery, while a break below it would sustain the broader downtrend toward April's low of $1.61.
Open Interest, funding rate FAQs
Higher Open Interest is associated with higher liquidity and new capital inflow to the market. This is considered the equivalent of increase in efficiency and the ongoing trend continues. When Open Interest decreases, it is considered a sign of liquidation in the market, investors are leaving and the overall demand for an asset is on a decline, fueling a bearish sentiment among investors.
Funding fees bridge the difference between spot prices and prices of futures contracts of an asset by increasing liquidation risks faced by traders. A consistently high and positive funding rate implies there is a bullish sentiment among market participants and there is an expectation of a price hike. A consistently negative funding rate for an asset implies a bearish sentiment, indicating that traders expect the cryptocurrency’s price to fall and a bearish trend reversal is likely to occur.
(The technical analysis of this story was written with the help of an AI tool)

يعتمد أكثر من مليون مستخدم على FXStreet للحصول على بيانات سوقية لحظية، وأدوات رسوم بيانية، ورؤى خبراء، وأخبار الفوركس. يساعد تقويمهم الاقتصادي الشامل والندوات التعليمية عبر الويب المتداولين على البقاء على اطلاع واتخاذ قرارات محسوبة. لدى FXStreet فريق يضم حوالي 60 محترفًا موزعين بين مقر برشلونة ومناطق عالمية مختلفة.
اقرأ المزيد


