
Ripple Price Forecast: XRP recovers as markets brace for volatile week
بواسطة Vishal Dixit
تم التحديث: 6 Apr 2026


المقالات الشائعة

Ripple (XRP) hovers above $1.35 at press time on Monday, with 2% intraday gains, ahead of a volatile week as markets remain on edge amid the US attempts to force Iran into accepting a ceasefire deal.
- Ripple extends gains on Monday, crossing above $1.35, after rebounding from a crucial support zone.
- The outcome of Trump's deadline for Iran to reopen the Strait of Hormuz and last-minute ceasefire efforts could set the market tone in the short term.
- On-chain data flags XRP as being oversold in the long term, while derivatives data suggest bulls are gaining strength.
Ripple (XRP) hovers above $1.35 at press time on Monday, with 2% intraday gains, ahead of a volatile week as markets remain on edge amid the US attempts to force Iran into accepting a ceasefire deal. On-chain data shows XRP as oversold over the last year, while derivatives data shows the market anticipating a near-term recovery.
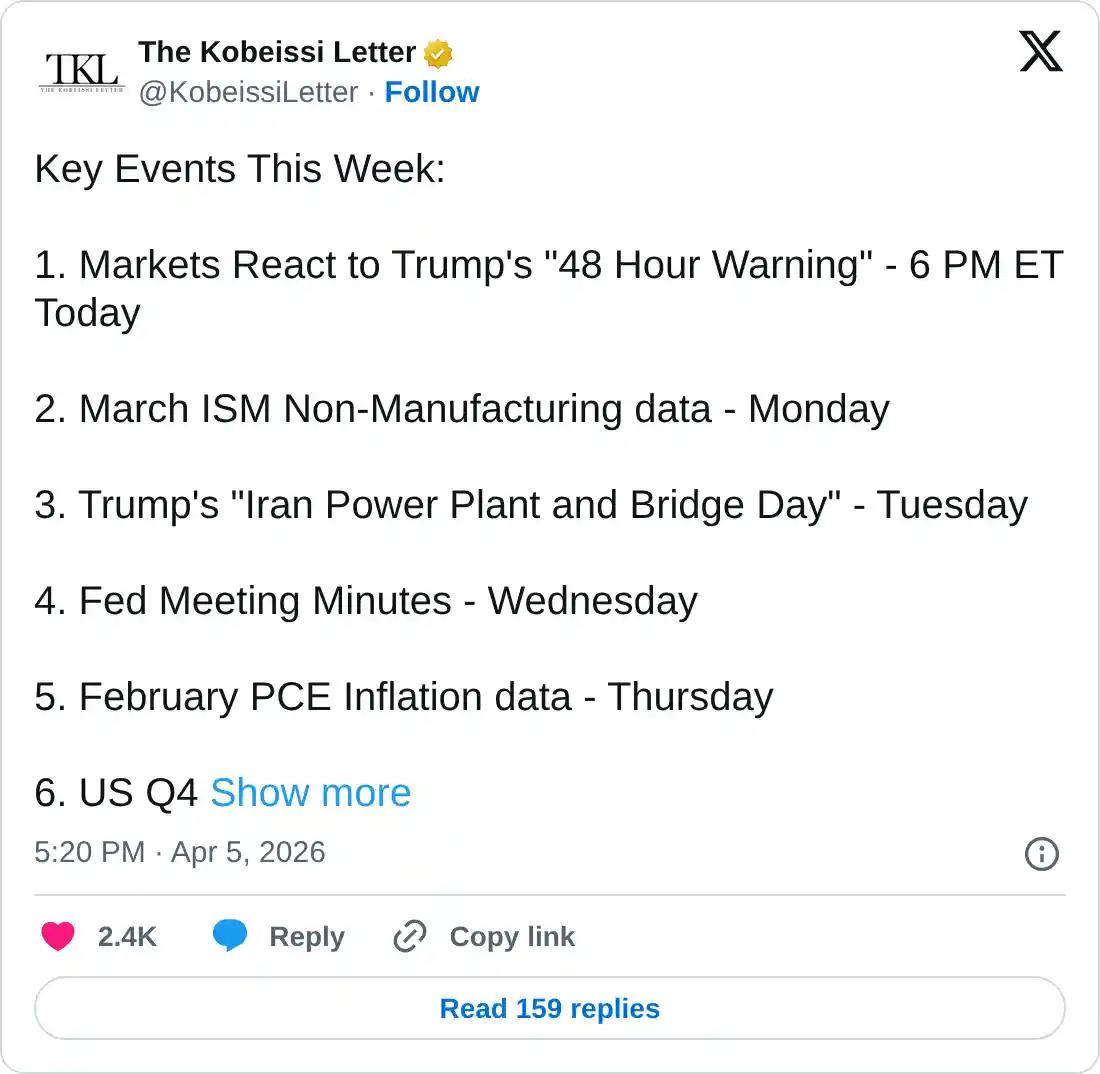
Trump, key US Data: A volatile week ahead
Ripple's 2% recovery at press time on Monday shows a bullish start to a volatile week, which includes Donald Trump's deadline to Iran on Tuesday, the Fed meeting minutes on Wednesday, US PCE Inflation for February with Q4 2025 GDP data on Thursday, and the US CPI inflation data for March on Friday. Traders are cautiously anticipating a potential ceasefire deal before Tuesday to stabilize the market, but failure to reach it could see a fresh spike in Oil prices and broader market volatility.
Derivatives show near-term strength amid oversold MVRV
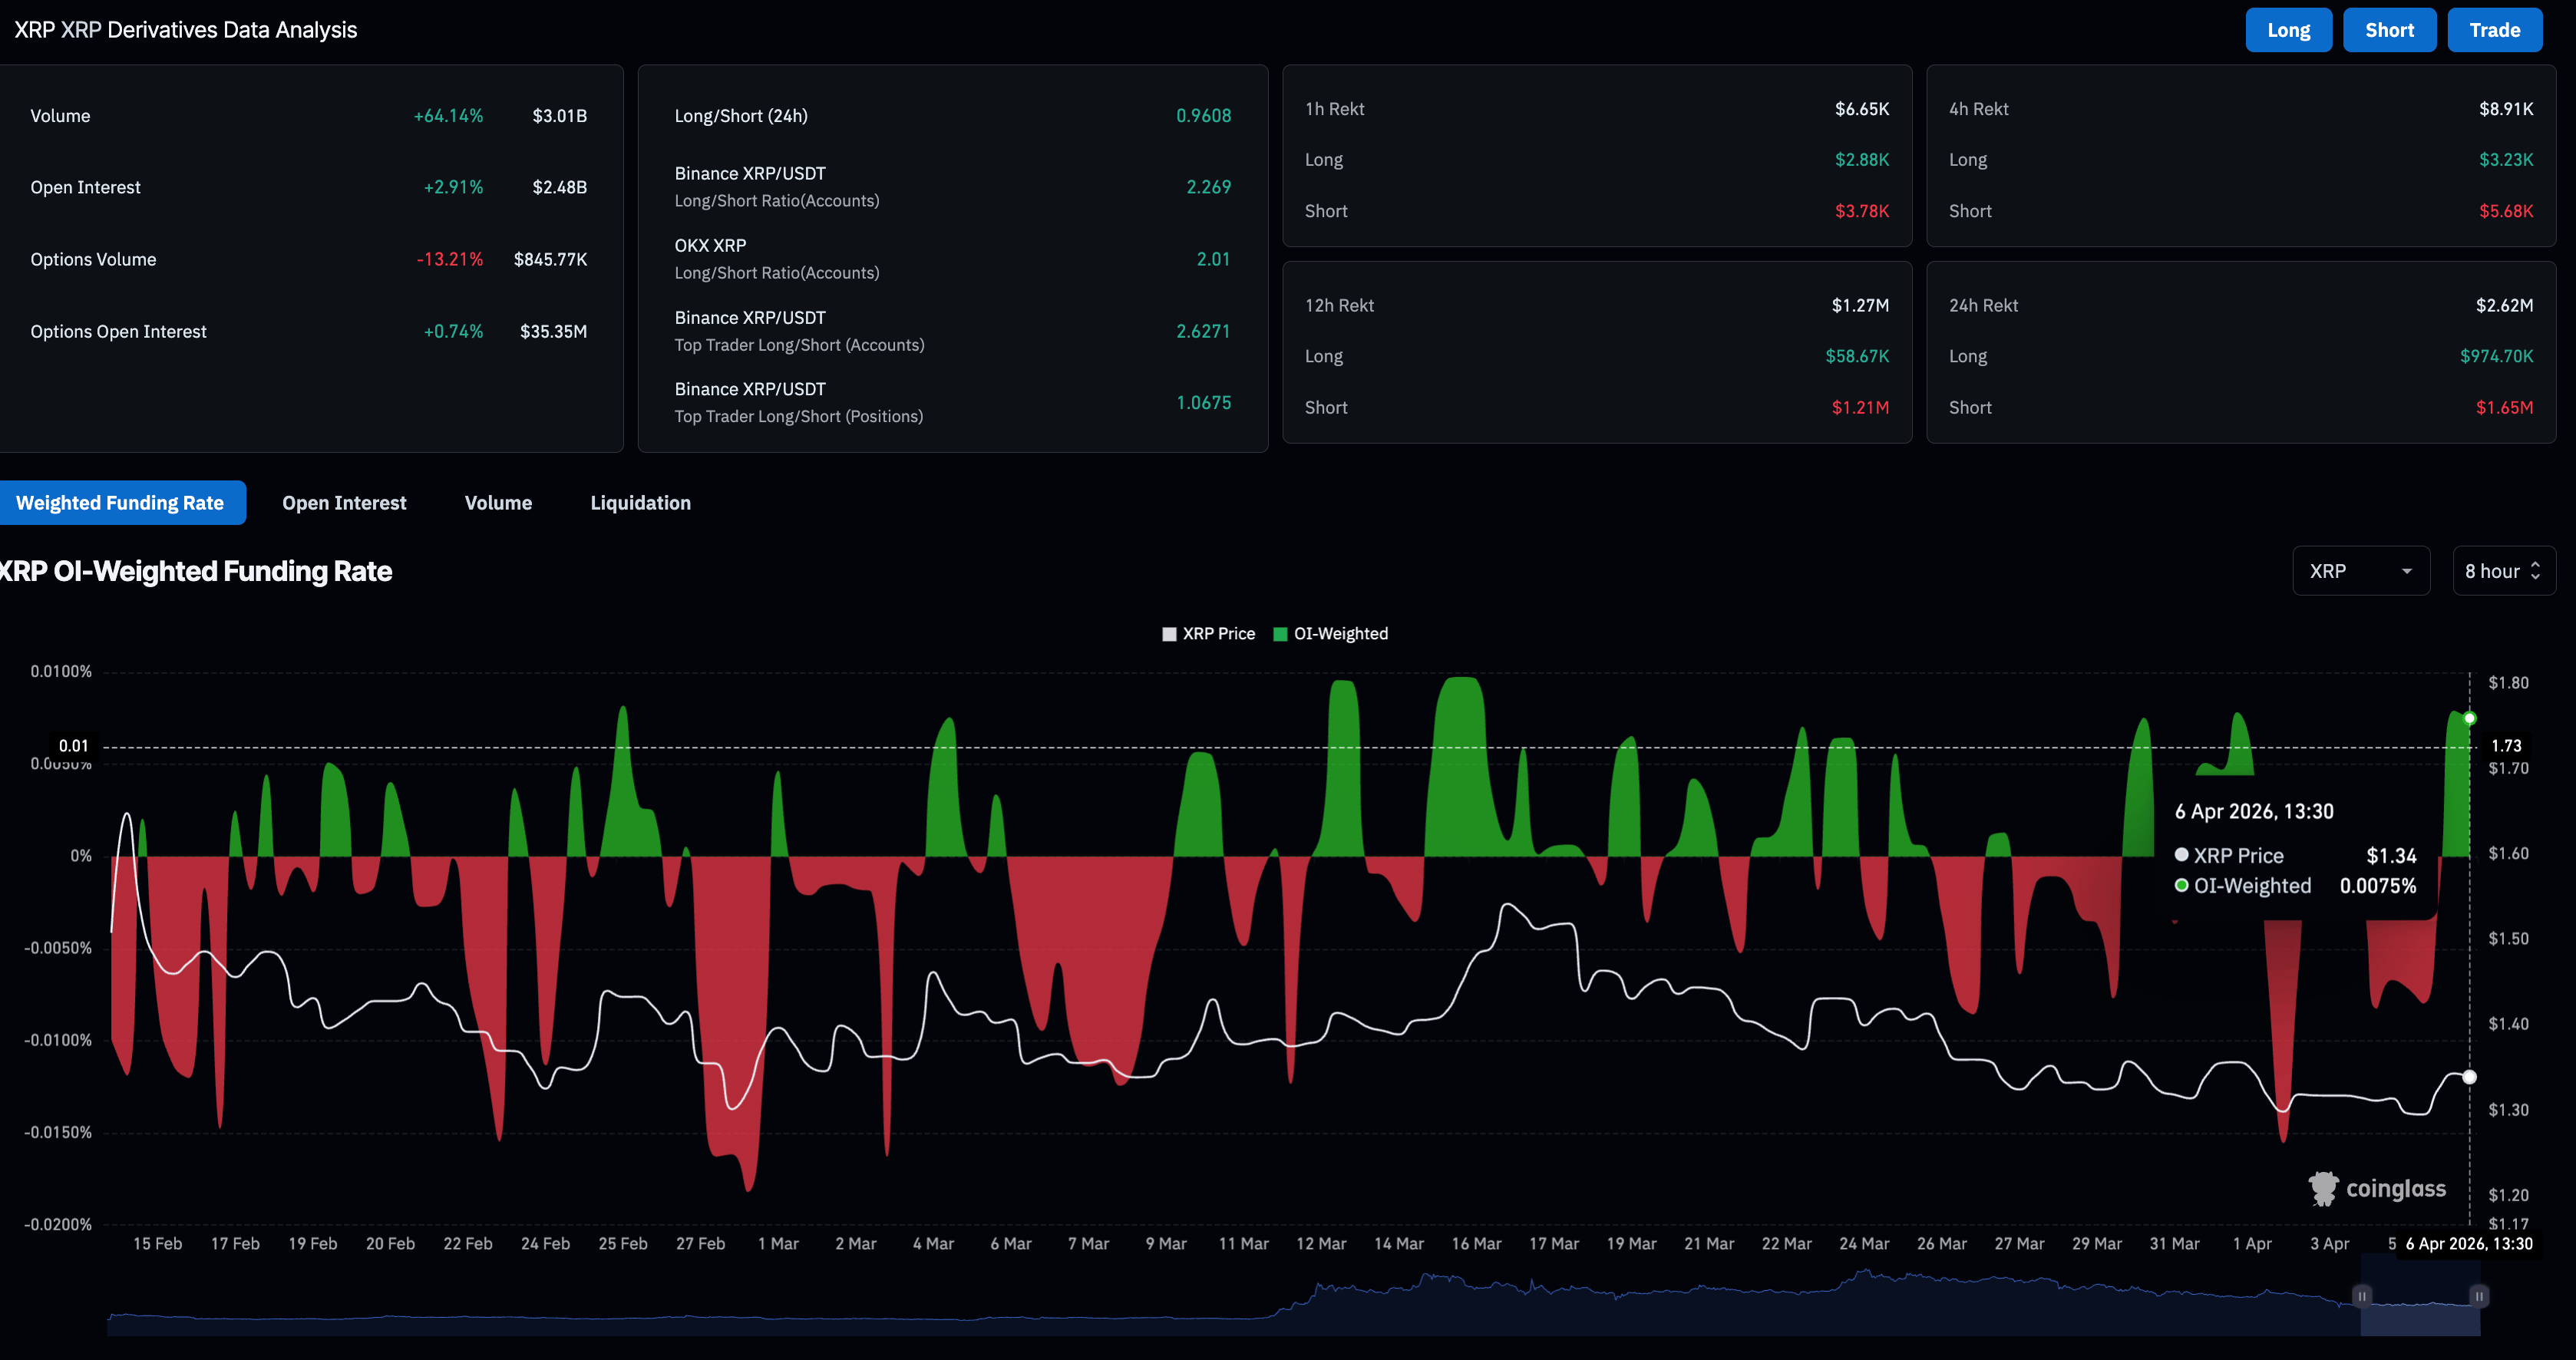
XRP gains strength on Monday as Bitcoin (BTC) rallies above $69,000 on hopes of a potential ceasefire in Iran. CoinGlass data shows the XRP futures Open Interest (OI) stands at $2.48 billion, up nearly 3% in the last 24 hours, indicating an increase in the notional value of outstanding XRP perpetuals linked to elevated leverage or positional buildup. Meanwhile, the OI-weighted funding rate at 0.0075% suggests that traders are inclined to hold long positions.
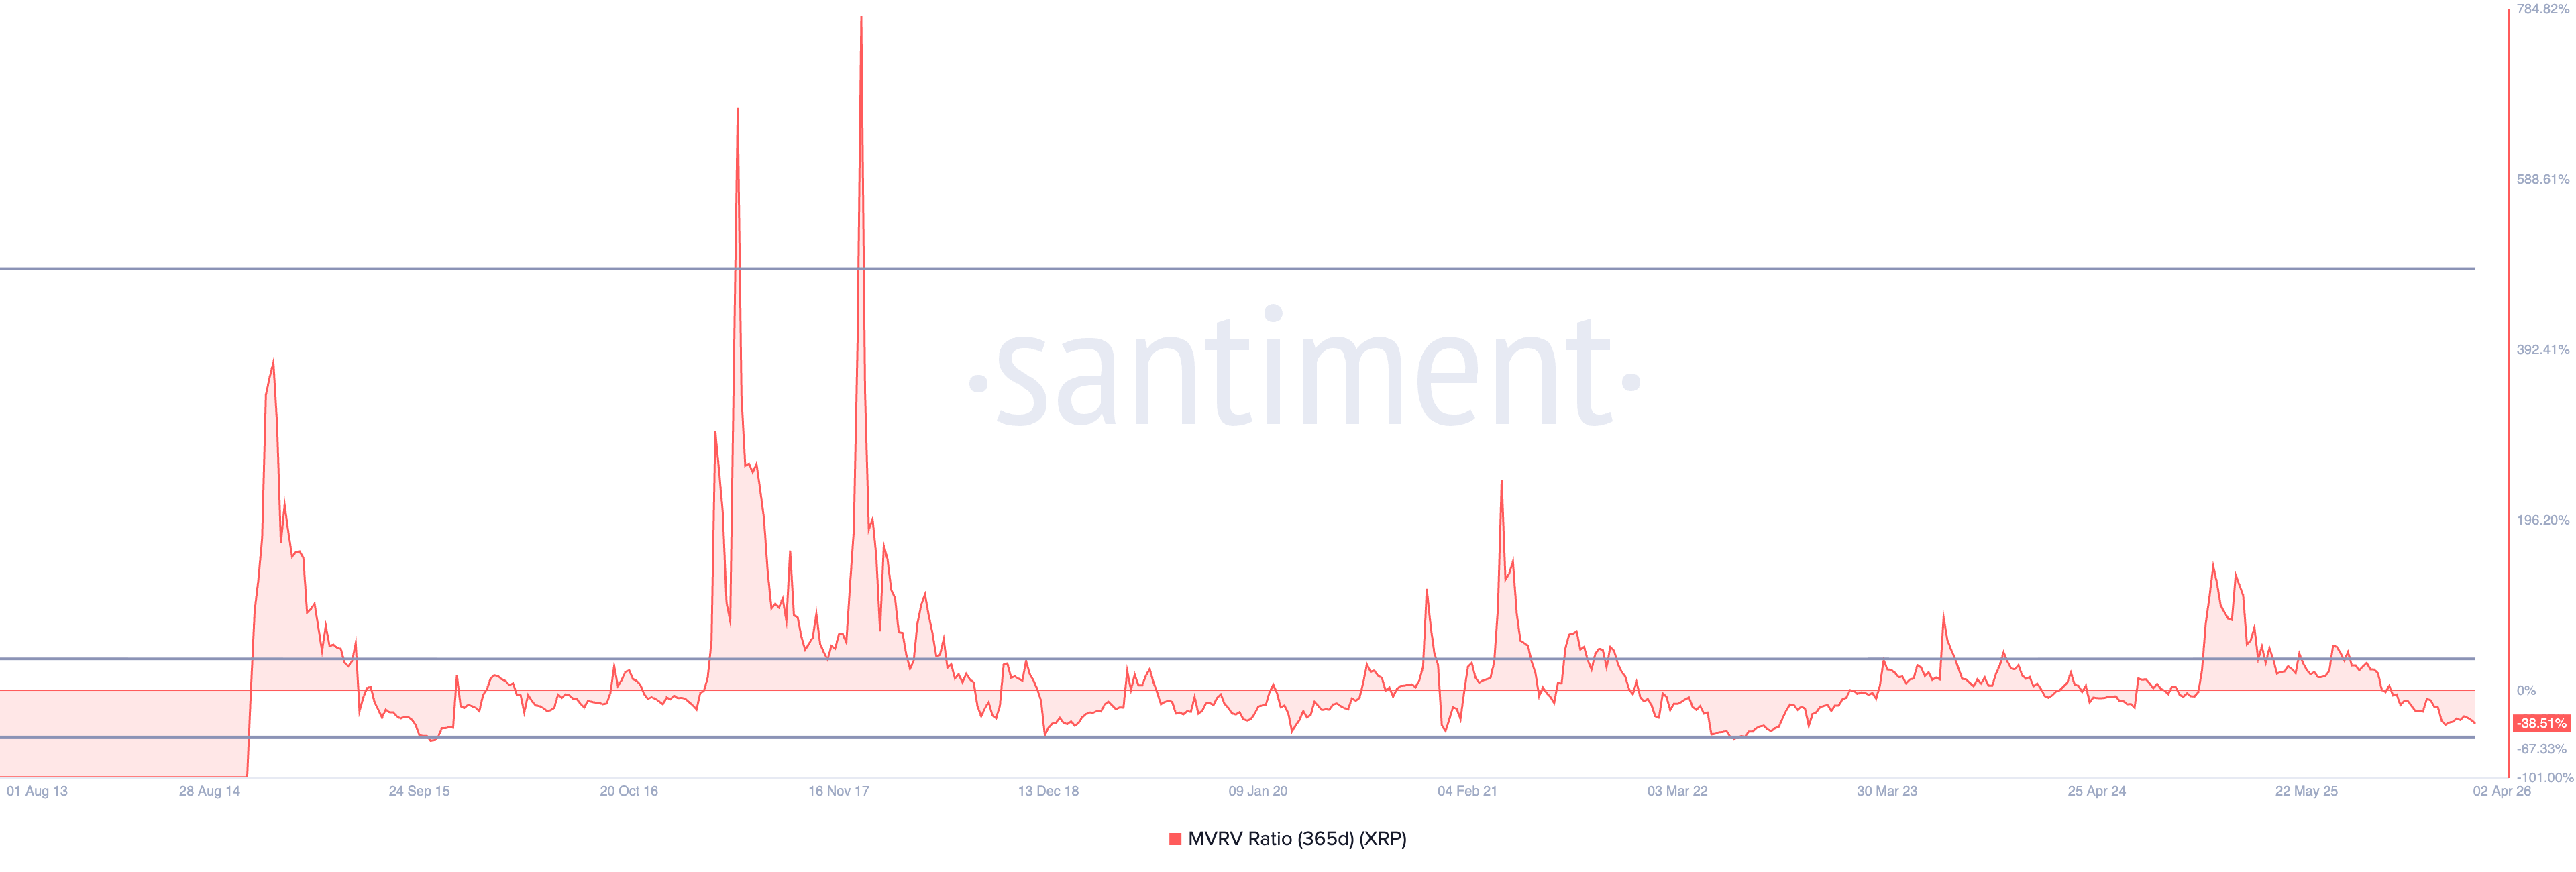
On the other hand, the Market Value to Realized Value (MVRV) ratio of XRP tokens – the ratio of market price to the average on-chain price of XRP – over the last 365 days is at -38.51%, suggesting that long-term investors are underwater. Typically, oversold conditions lead to a bounce back. Still, in the case of XRP, the ratio is still above the -53% figure that, since December 2018, has led to positive reversals.
XRP regains strength near key support level
Ripple shows a mildly bearish bias, as the intraday recovery remains well below the 50-day, 100-day, and 200-day EMAs, all of which are trending lower and reinforcing a downside-skewed backdrop.
The 50-day EMA at $1.42 coincides with a descending resistance trendline connecting the January 6 and March 17 highs. A decisive close above this cluster of resistance could bring the $1.50 psychological level and the 100-day EMA at $1.59 on the radar.
The Moving Average Convergence Divergence (MACD) approaches the signal line for a potential bullish crossover on the daily chart as the negative histogram contracts, suggesting fading bearish momentum. The Relative Strength Index (RSI) at 46 is rising toward the midline, suggesting a short-term rebound in bullish momentum amid a broader corrective phase.
Looking down, the immediate support for XRP is seen in the demand zone between $1.25-$1.27, which guards the February 6 low at $1.11.
(The technical analysis of this story was written with the help of an AI tool.)

يعتمد أكثر من مليون مستخدم على FXStreet للحصول على بيانات سوقية لحظية، وأدوات رسوم بيانية، ورؤى خبراء، وأخبار الفوركس. يساعد تقويمهم الاقتصادي الشامل والندوات التعليمية عبر الويب المتداولين على البقاء على اطلاع واتخاذ قرارات محسوبة. لدى FXStreet فريق يضم حوالي 60 محترفًا موزعين بين مقر برشلونة ومناطق عالمية مختلفة.
اقرأ المزيد


