
Ripple Price Forecast: XRP seeks higher support amid retail demand resurgence
بواسطة John Isige
تاريخ النشر: 17 Mar 2026 | تاريخ التعديل: 17 Mar 2026


المقالات الشائعة

Ripple (XRP) is easing from its daily high of $1.61, trading above $1.50 at the time of writing on Tuesday. The remittance token had maintained modest gains for four consecutive days, reflecting a broad increase in crypto prices led by Bitcoin (BTC), which touched $76,000 earlier in the day.
- XRP slides from daily highs around $1.61 as bulls eye higher support.
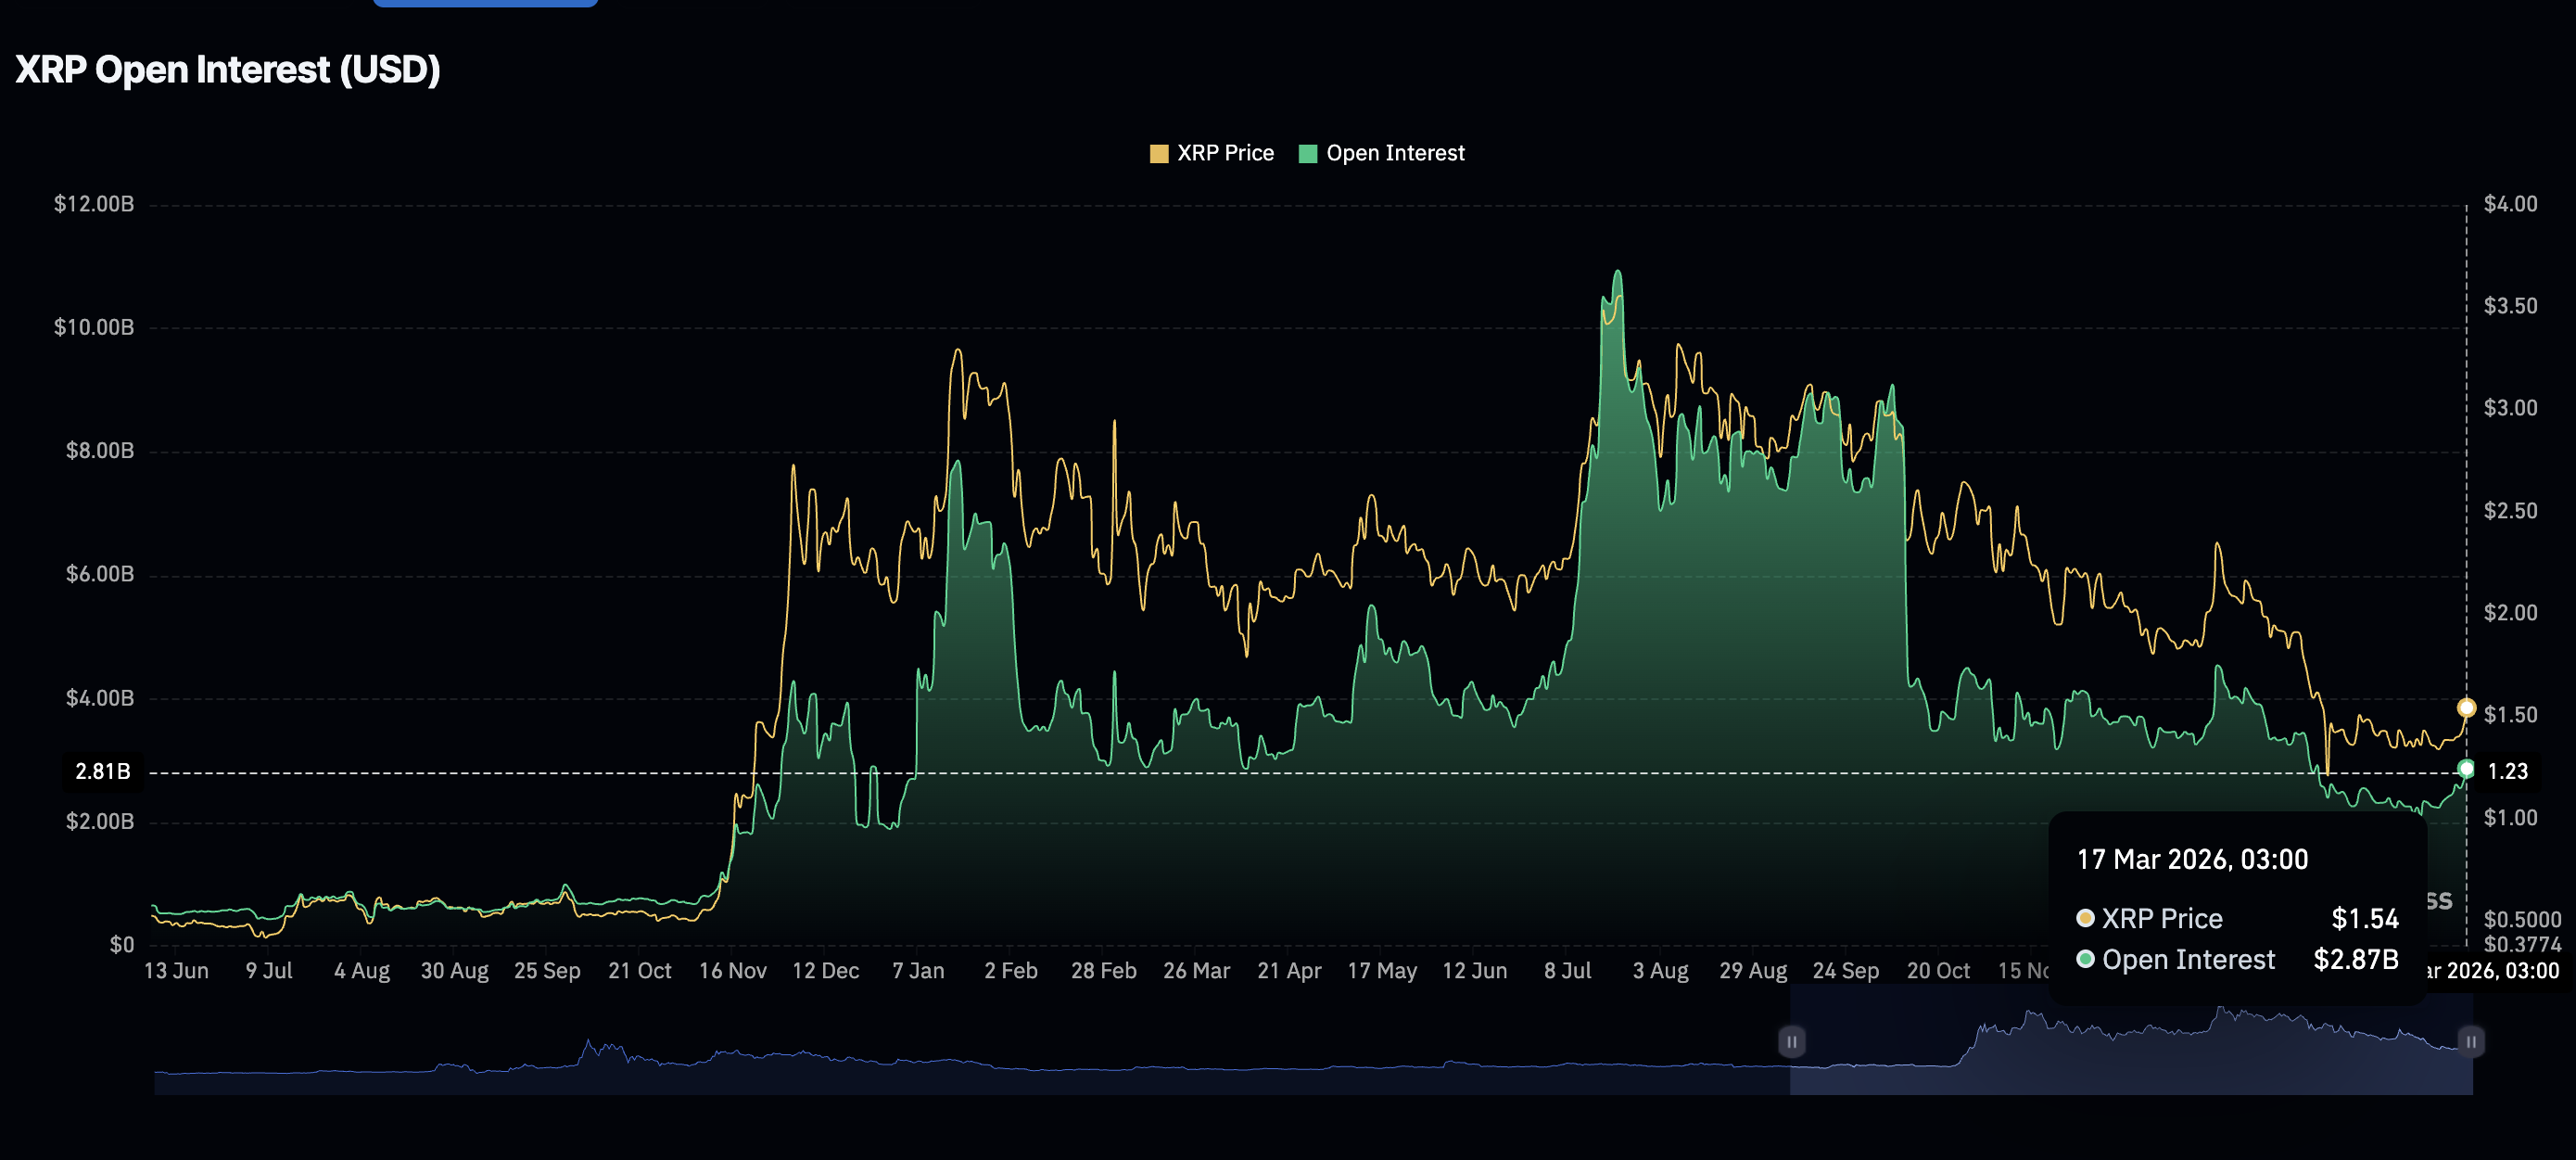
- XRP sees an increase in retail demand as futures Open Interest rises to $2.87 billion.
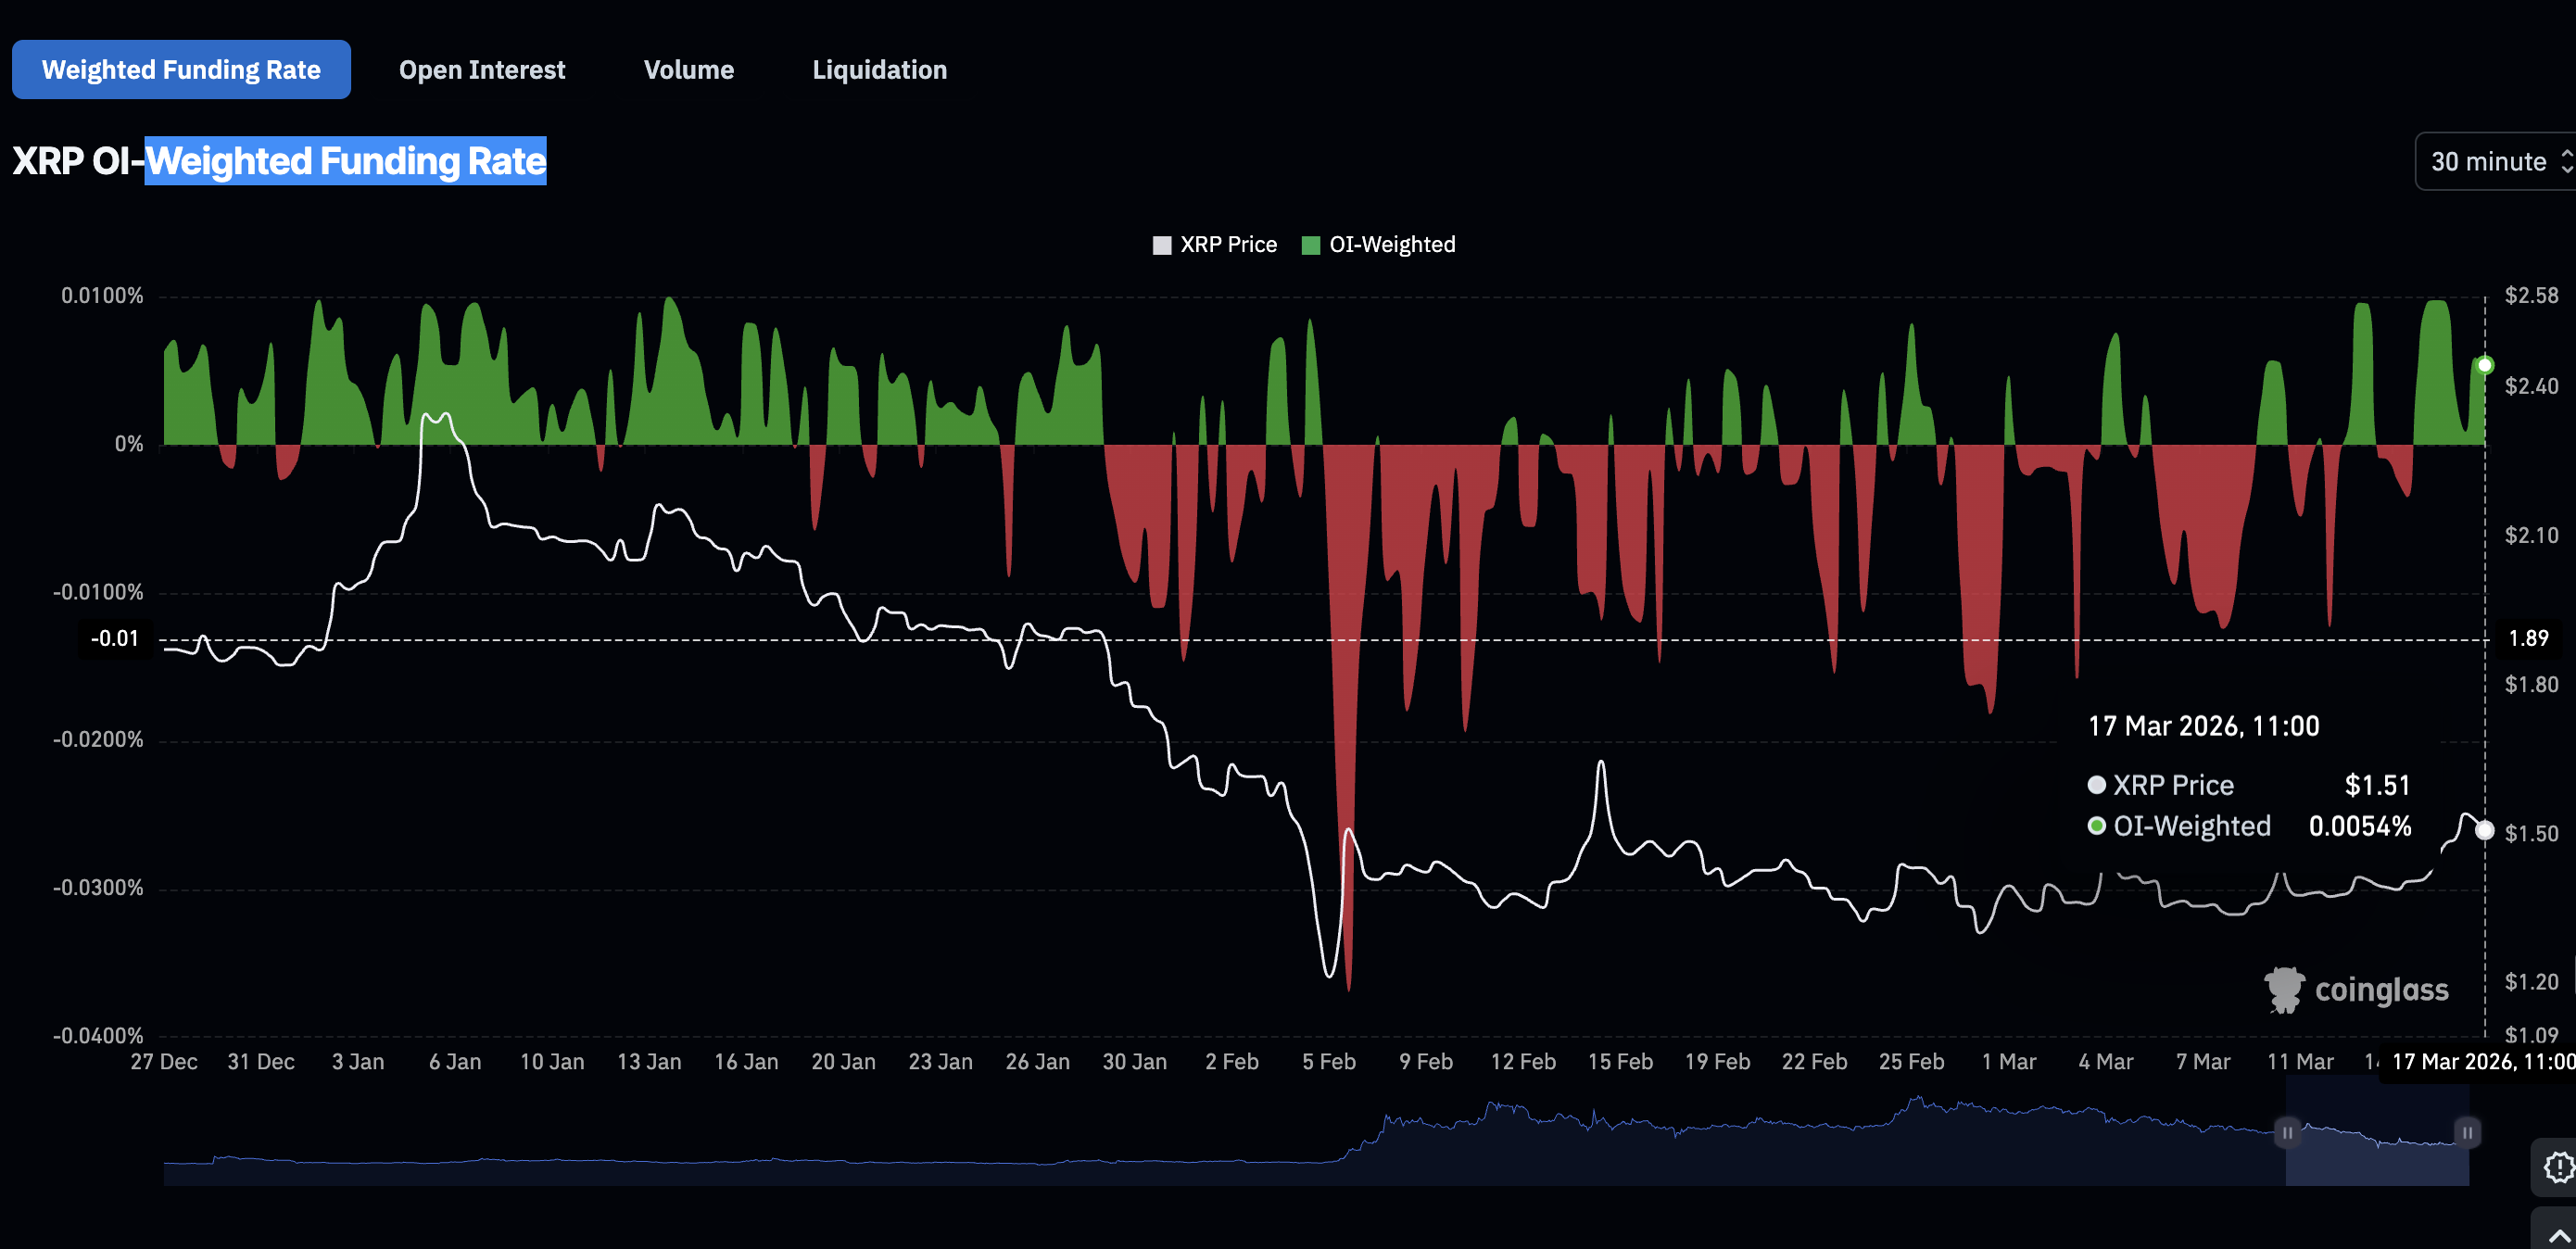
- Traders lean into risk with the Open Interest Weighted Funding Rate remaining positive for three consecutive days.
Ripple (XRP) is easing from its daily high of $1.61, trading above $1.50 at the time of writing on Tuesday. The remittance token had maintained modest gains for four consecutive days, reflecting a broad increase in crypto prices led by Bitcoin (BTC), which touched $76,000 earlier in the day.
XRP’s rebound cools as retail traders return
The steady increase in the XRP price from the monthly low of $1.32 on March 1 aligns with rising derivatives demand, as seen in futures Open Interest (OI) reaching $2.87 billion on Tuesday, up from $2.66 billion the previous day.
CoinGlass data shows that OI, which reflects the notional value of outstanding futures contracts, dropped to $2.11 billion on March 4, matching levels last seen in January 2025.
In contrast, the OI peaked at $10.94 billion in July, coinciding with XRP’s rally to a record high of $3.66. Higher or steadily increasing OI indicates that traders are confident in XRP and willing to increase their exposure, thereby helping sustain growth.
The OI-Weighted Funding Rate chart shows that traders are increasingly piling into XRP long positions. As observed, the weighted funding rate holds at 0.0054% on Tuesday and has remained positive for three consecutive days since Sunday.
Technical outlook: XRP stalls after recovering key technical levels
XRP is delicately holding onto support at $1.50 amid a modestly bullish outlook, which elevated the remittance token above the 50-day Exponential Moving Average (EMA). Despite a minor correction from the daily high of $1.61, the Moving Average Convergence Divergence (MACD) indicator remains above its signal line on the daily chart. The gradually expanding green histogram bars suggest strengthening bullish momentum.
A daily close above the short-term support at $1.50, which aligns with the 50-day EMA, could strengthen the near-term bullish bias and open the door for gains above the SuperTrend indicator, capping rebounds at $1.58. A sustained break past this supply zone would expose XRP to the 100-day EMA at $1.70.
-1773747924523-1773747924526.png)
Still, the Money Flow Index (MFI) climbs into overbought territory above 80, signalling strong buying pressure but also warning that the latest upswing may be running hot. A deeper correction below $1.50 could accelerate toward the weekly open at $1.45. Other levels of interest for traders are $1.40 and $1.35, respectively.
Open Interest, funding rate FAQs
Higher Open Interest is associated with higher liquidity and new capital inflow to the market. This is considered the equivalent of increase in efficiency and the ongoing trend continues. When Open Interest decreases, it is considered a sign of liquidation in the market, investors are leaving and the overall demand for an asset is on a decline, fueling a bearish sentiment among investors.
Funding fees bridge the difference between spot prices and prices of futures contracts of an asset by increasing liquidation risks faced by traders. A consistently high and positive funding rate implies there is a bullish sentiment among market participants and there is an expectation of a price hike. A consistently negative funding rate for an asset implies a bearish sentiment, indicating that traders expect the cryptocurrency’s price to fall and a bearish trend reversal is likely to occur.
(The technical analysis of this story was written with the help of an AI tool.)

يعتمد أكثر من مليون مستخدم على FXStreet للحصول على بيانات سوقية لحظية، وأدوات رسوم بيانية، ورؤى خبراء، وأخبار الفوركس. يساعد تقويمهم الاقتصادي الشامل والندوات التعليمية عبر الويب المتداولين على البقاء على اطلاع واتخاذ قرارات محسوبة. لدى FXStreet فريق يضم حوالي 60 محترفًا موزعين بين مقر برشلونة ومناطق عالمية مختلفة.
اقرأ المزيد


