
Silver Price Analysis: XAG/USD pressured below 50-day SMA, downside risks remain intact
بواسطة Vishal Chaturvedi
تاريخ النشر: 19 Mar 2026 | تاريخ التعديل: 19 Mar 2026


المقالات الشائعة

Silver (XAG/USD) rebounds from daily lows on Thursday as a pullback in the US Dollar (USD) and Treasury yields provides support, though the metal remains on the back foot as markets reassess global rate expectations following a wave of central bank decisions.
- Silver rebounds from intraday lows but remains under pressure, with prices still down nearly 5% on the day.
- Softer US Dollar and easing yields provide support to XAG/USD.
- Technically, silver maintains a bearish structure after failing below key moving averages.
Silver (XAG/USD) rebounds from daily lows on Thursday as a pullback in the US Dollar (USD) and Treasury yields provides support, though the metal remains on the back foot as markets reassess global rate expectations following a wave of central bank decisions. At the time of writing, XAG/USD trades near $71.50, down about 5% after touching a low of $65.51 earlier in the day, its weakest level since February 2.
The Federal Reserve (Fed), Bank of Japan (BoJ), Swiss National Bank (SNB), Bank of England (BoE) and European Central Bank (ECB) all kept interest rates unchanged, while highlighting upside inflation risks driven by surging Oil prices amid the ongoing US-Israel war with Iran.
This backdrop is reinforcing a “higher-for-longer” interest rate narrative, which continues to undermine demand for the non-yielding metal, overshadowing its safe-haven appeal despite elevated geopolitical tensions.
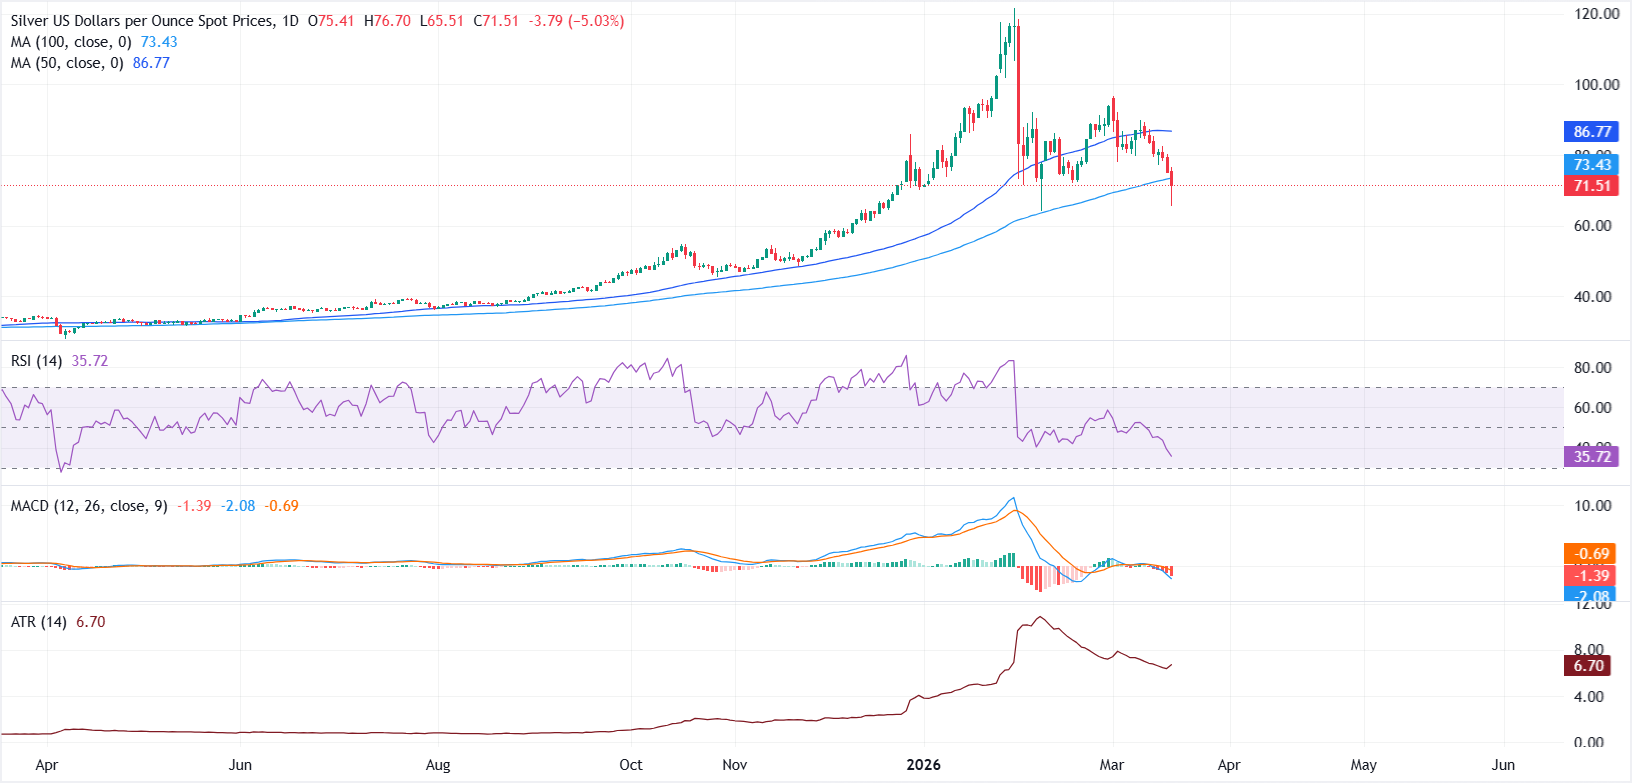
From a technical perspective, the daily chart shows XAG/USD under sustained downside pressure after peaking near $96.62 earlier this month, with prices slipping below the 50-day Simple Moving Average (SMA). The latest leg lower pushed prices below the 100-day SMA near $73.40, which is now acting as a near-term pivot as prices move back toward this level.
The Relative Strength Index (RSI) has dropped to around 34, approaching oversold territory and signaling persistent bearish momentum. Meanwhile, the Moving Average Convergence Divergence (MACD) remains below the signal line in negative territory, with a widening histogram reinforcing strengthening downside pressure in the near term. The Average True Range (ATR) has edged higher, pointing to rising volatility as sellers continue to dominate price action.
On the downside, a daily close below the 100-day SMA would keep the bias tilted to the downside, with the February 6 low at $64.08 acting as immediate support. A break below this level could open the door for deeper losses toward the $54-$55 region, a previous breakout zone.
On the upside, if buyers manage to reclaim the 100-day SMA, the near-term outlook could shift to neutral-to-mildly bullish, with the 50-day SMA likely capping recovery attempts. A sustained move above this level would bring the March peak at $96.62 into focus, with a break higher potentially paving the way for a retest of the all-time high near $121.66.
Gold FAQs
Gold has played a key role in human’s history as it has been widely used as a store of value and medium of exchange. Currently, apart from its shine and usage for jewelry, the precious metal is widely seen as a safe-haven asset, meaning that it is considered a good investment during turbulent times. Gold is also widely seen as a hedge against inflation and against depreciating currencies as it doesn’t rely on any specific issuer or government.
Central banks are the biggest Gold holders. In their aim to support their currencies in turbulent times, central banks tend to diversify their reserves and buy Gold to improve the perceived strength of the economy and the currency. High Gold reserves can be a source of trust for a country’s solvency. Central banks added 1,136 tonnes of Gold worth around $70 billion to their reserves in 2022, according to data from the World Gold Council. This is the highest yearly purchase since records began. Central banks from emerging economies such as China, India and Turkey are quickly increasing their Gold reserves.
Gold has an inverse correlation with the US Dollar and US Treasuries, which are both major reserve and safe-haven assets. When the Dollar depreciates, Gold tends to rise, enabling investors and central banks to diversify their assets in turbulent times. Gold is also inversely correlated with risk assets. A rally in the stock market tends to weaken Gold price, while sell-offs in riskier markets tend to favor the precious metal.
The price can move due to a wide range of factors. Geopolitical instability or fears of a deep recession can quickly make Gold price escalate due to its safe-haven status. As a yield-less asset, Gold tends to rise with lower interest rates, while higher cost of money usually weighs down on the yellow metal. Still, most moves depend on how the US Dollar (USD) behaves as the asset is priced in dollars (XAU/USD). A strong Dollar tends to keep the price of Gold controlled, whereas a weaker Dollar is likely to push Gold prices up.

يعتمد أكثر من مليون مستخدم على FXStreet للحصول على بيانات سوقية لحظية، وأدوات رسوم بيانية، ورؤى خبراء، وأخبار الفوركس. يساعد تقويمهم الاقتصادي الشامل والندوات التعليمية عبر الويب المتداولين على البقاء على اطلاع واتخاذ قرارات محسوبة. لدى FXStreet فريق يضم حوالي 60 محترفًا موزعين بين مقر برشلونة ومناطق عالمية مختلفة.
اقرأ المزيد


