
Silver Price Forecast: XAG/USD plunges near 5% on firm USD
بواسطة Christian Borjon Valencia
تاريخ النشر: 18 Feb 2026 | تاريخ التعديل: 18 Feb 2026


المقالات الشائعة

Silver prices (XAG/USD) collapsed for the first time in the week, down nearly 5% sponsored by steady US Treasury yields and a firm US Dollar, which weighed on the white metal. At the time of writing, XAG/USD trades at $73.49 after peaking at $76.87.
- Silver slides as strong Dollar and steady yields curb precious metals demand.
- Lower highs and bearish RSI point to downside risk toward $70.00 support.
- Break below $72.00 may target 100-day SMA near $64.70; $75.00 limits rebounds.
Silver prices (XAG/USD) collapsed for the first time in the week, down nearly 5% sponsored by steady US Treasury yields and a firm US Dollar, which weighed on the white metal. At the time of writing, XAG/USD trades at $73.49 after peaking at $76.87.
XAG/USD Price Forecast: Technical outlook
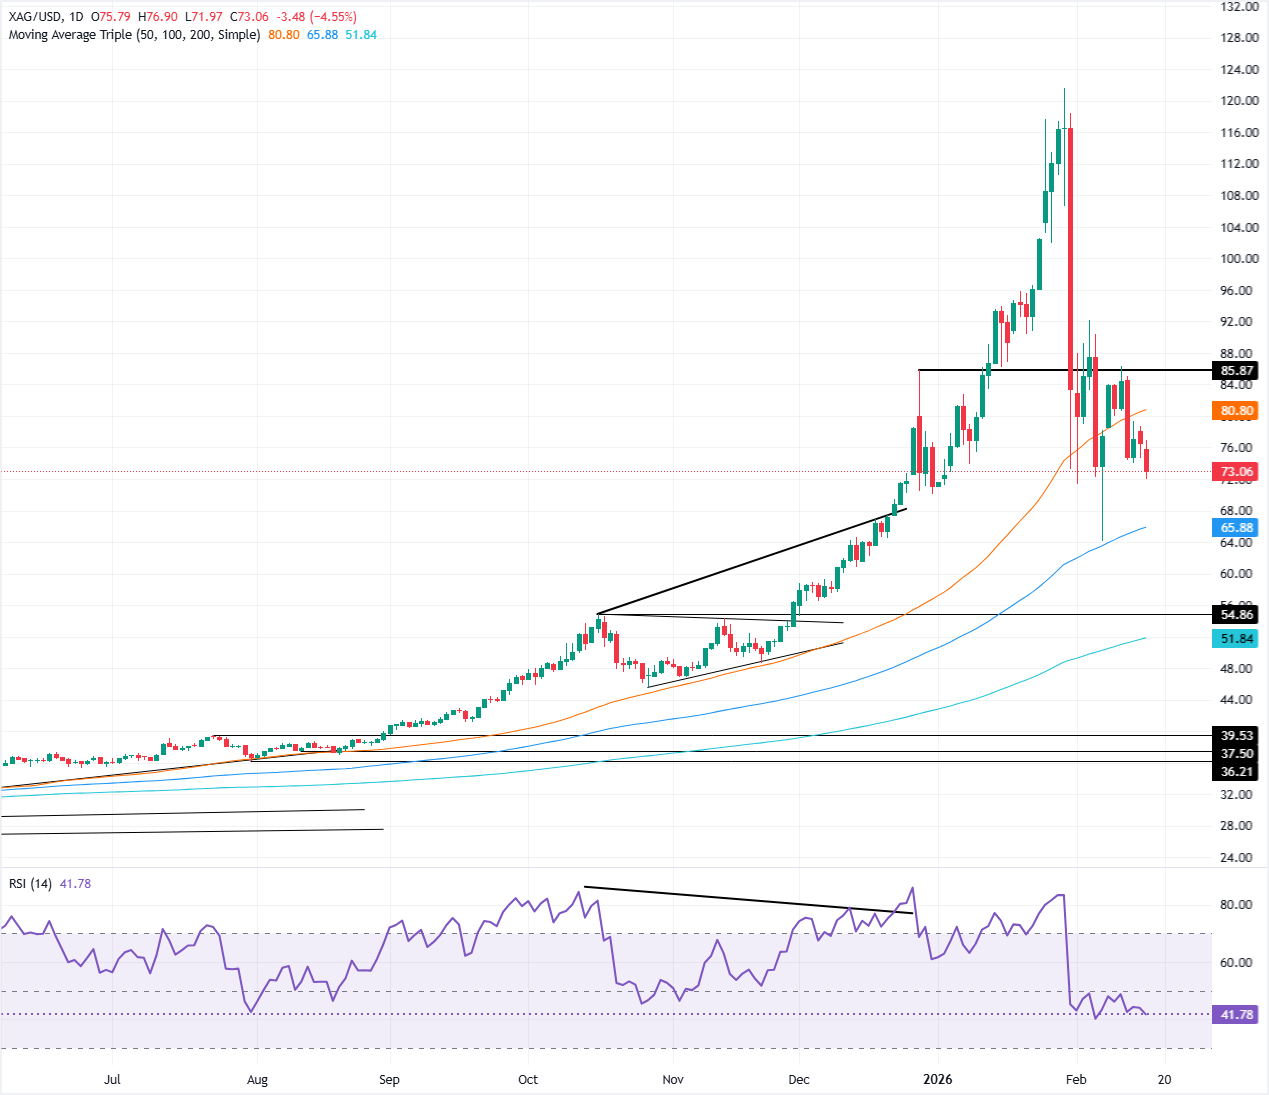
The technical picture shows Silver is neutral biased but tilted to the downside. Price action shows a successive series of lower highs, along with hitting a six-day low at $72.00, which once decisively surpassed, clears the door to test $70.00.
The Relative Strength Index (RSI) slope is downwards, along with remaining at bearish territory, hints that XAG/USD could continue its path towards testing the 100-day Simple Moving Average (SMA) at $64.71.
On further weakness, the next support would be the $60.00 milestone.
Conversely, if XAG/USD reclaims $75.00, buyers could remain hopeful of challenging the 50-day SMA at $79.39. A breach of the latter will expose $80.00.
XAG/USD Price Chart — Daily
Silver FAQs
Silver is a precious metal highly traded among investors. It has been historically used as a store of value and a medium of exchange. Although less popular than Gold, traders may turn to Silver to diversify their investment portfolio, for its intrinsic value or as a potential hedge during high-inflation periods. Investors can buy physical Silver, in coins or in bars, or trade it through vehicles such as Exchange Traded Funds, which track its price on international markets.
Silver prices can move due to a wide range of factors. Geopolitical instability or fears of a deep recession can make Silver price escalate due to its safe-haven status, although to a lesser extent than Gold's. As a yieldless asset, Silver tends to rise with lower interest rates. Its moves also depend on how the US Dollar (USD) behaves as the asset is priced in dollars (XAG/USD). A strong Dollar tends to keep the price of Silver at bay, whereas a weaker Dollar is likely to propel prices up. Other factors such as investment demand, mining supply – Silver is much more abundant than Gold – and recycling rates can also affect prices.
Silver is widely used in industry, particularly in sectors such as electronics or solar energy, as it has one of the highest electric conductivity of all metals – more than Copper and Gold. A surge in demand can increase prices, while a decline tends to lower them. Dynamics in the US, Chinese and Indian economies can also contribute to price swings: for the US and particularly China, their big industrial sectors use Silver in various processes; in India, consumers’ demand for the precious metal for jewellery also plays a key role in setting prices.
Silver prices tend to follow Gold's moves. When Gold prices rise, Silver typically follows suit, as their status as safe-haven assets is similar. The Gold/Silver ratio, which shows the number of ounces of Silver needed to equal the value of one ounce of Gold, may help to determine the relative valuation between both metals. Some investors may consider a high ratio as an indicator that Silver is undervalued, or Gold is overvalued. On the contrary, a low ratio might suggest that Gold is undervalued relative to Silver.

يعتمد أكثر من مليون مستخدم على FXStreet للحصول على بيانات سوقية لحظية، وأدوات رسوم بيانية، ورؤى خبراء، وأخبار الفوركس. يساعد تقويمهم الاقتصادي الشامل والندوات التعليمية عبر الويب المتداولين على البقاء على اطلاع واتخاذ قرارات محسوبة. لدى FXStreet فريق يضم حوالي 60 محترفًا موزعين بين مقر برشلونة ومناطق عالمية مختلفة.
اقرأ المزيد


