
Solana Price Forecast: SOL risks further decline as sell-side pressure dominates ETFs, derivatives
بواسطة Vishal Dixit
تم التحديث: 27 Mar 2026


المقالات الشائعة

Solana (SOL) trades around $86 at press time on Friday, after a 6% decline the previous day, in line with the broader market correction and over $1 million in outflows from SOL-focused Exchange Traded Funds.
- Solana hovers around $86 on Friday after a nearly 6% decline the previous day, weighing down on a short-term support trendline.
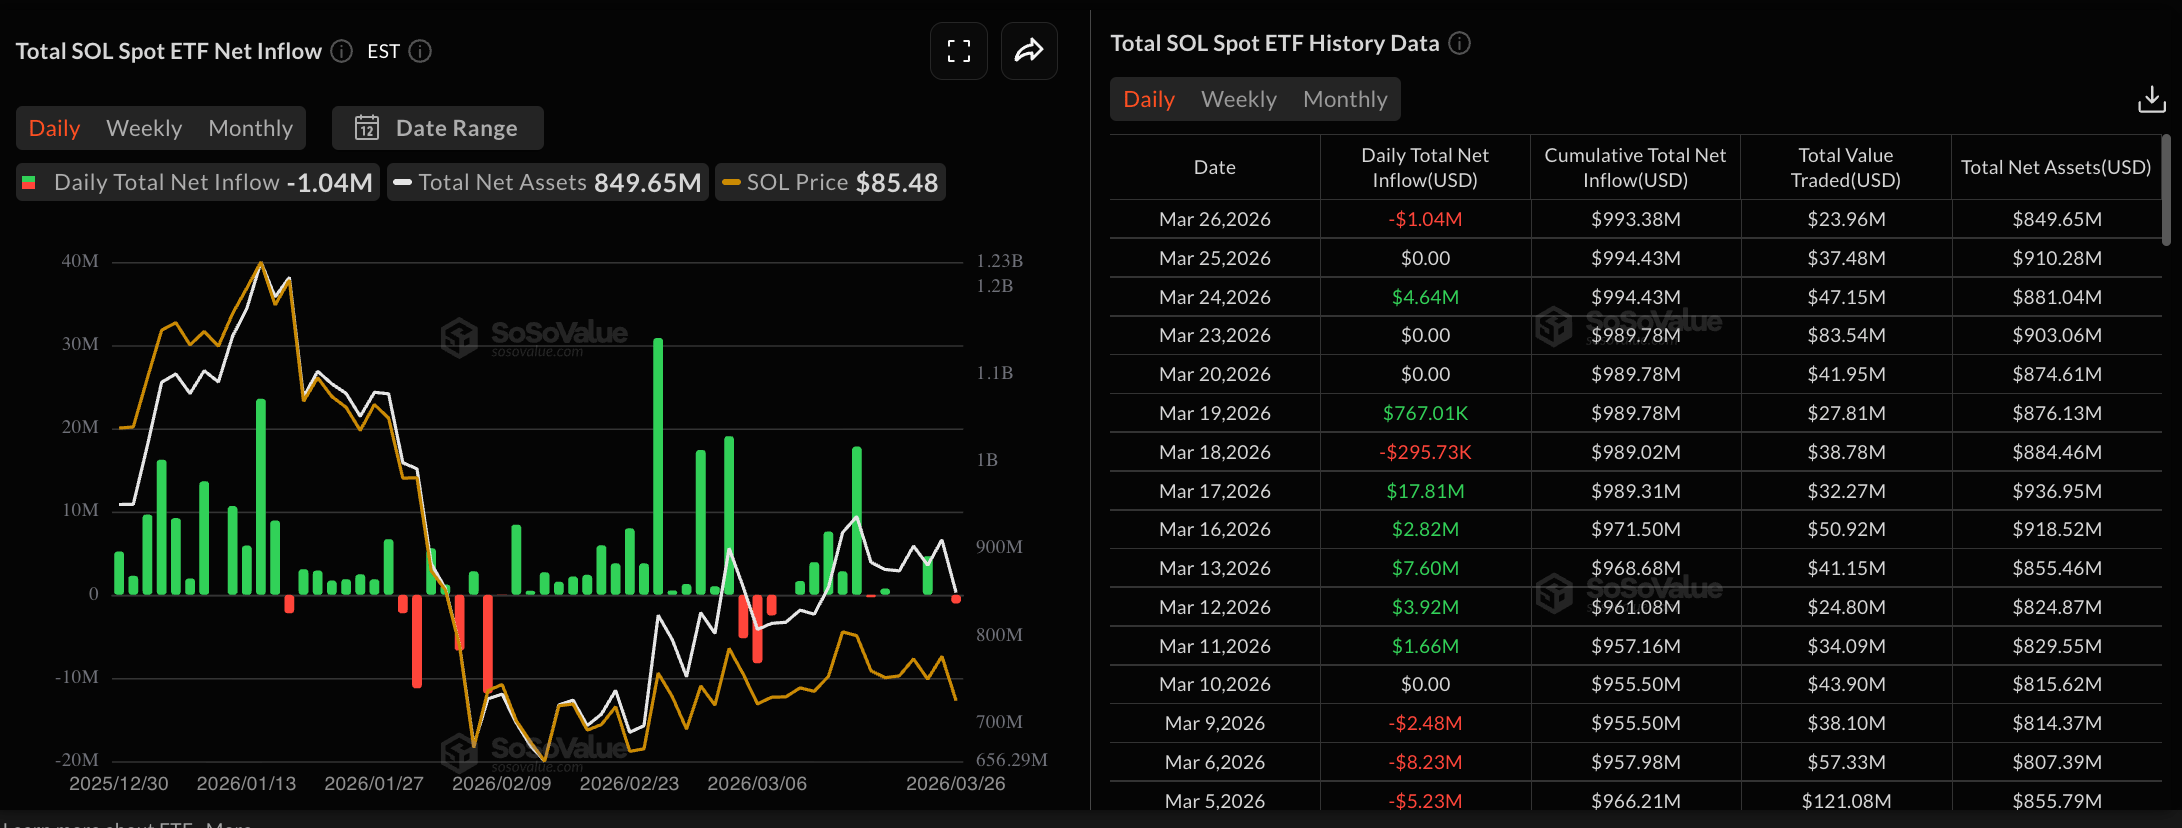
- US spot SOL ETFs recorded over $1 million in outflows on Thursday, aligning with the spot market correction.
- Derivatives data shows an increase in Open Interest amid negative funding rates and a long-to-short ratio of less than 1, suggesting sell-side dominance.
Solana (SOL) trades around $86 at press time on Friday, after a 6% decline the previous day, in line with the broader market correction and over $1 million in outflows from SOL-focused Exchange Traded Funds. Derivatives data signals a surge in sell-side dominance as heightened Open Interest suggests positional buildup amid negative funding rates.
The technical outlook for Solana focuses on the near-term, crucial support trendline, a breakout of which would expose the $75 support level.
Derivatives data signals bearish dominance
CoinGlass data shows an increase of over 3% in SOL futures Open Interest (OI) over the last 24 hours, reaching $5.39 billion, indicating a rise in the notional value of outstanding contracts. However, the negative funding rate of -0.0078 indicates a bearish interest among traders. Additionally, the long-to-short ratio is less than 1 at 0.9223, suggesting a greater number of active bearish positions.
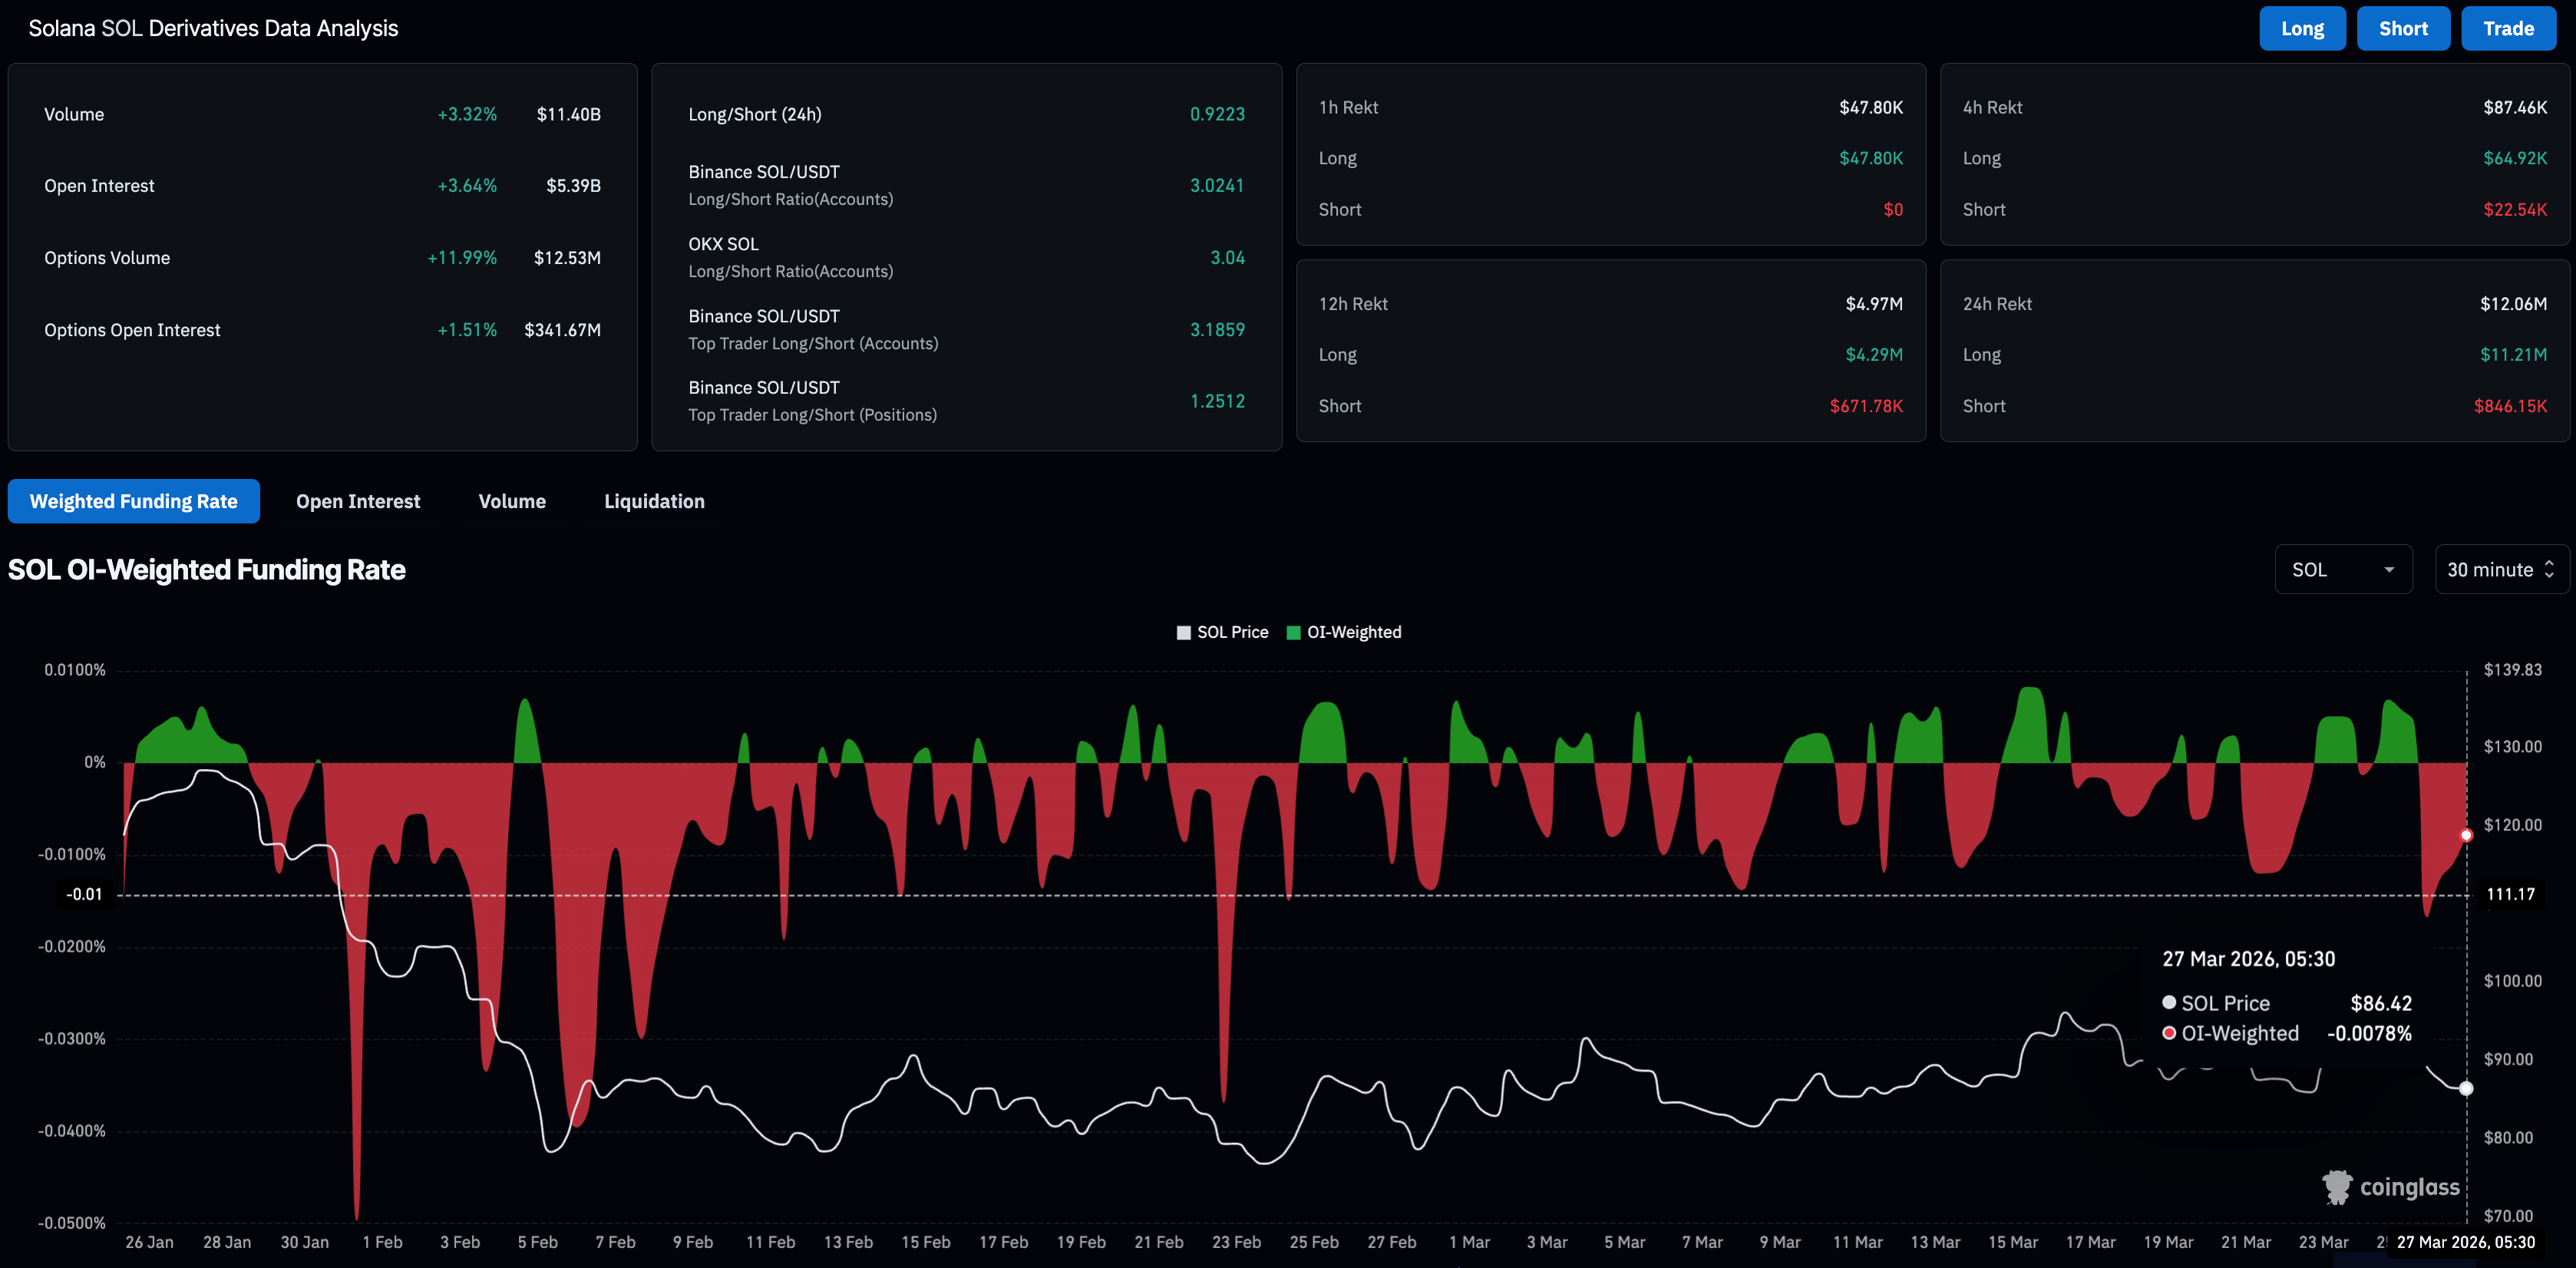
Overall, the derivatives market signals a sell-side dominance among retail traders.
On the institutional side, the Solana-focused ETFs recorded $1.04 million in outflows on Thursday, suggesting a minor hiccup in institutional confidence. Extended outflows from ETFs could fuel further selling in the spot market.
Will Solana extend losses below $80?
Solana hovers slightly above $85 at the time of writing on Friday, after a roughly 6% drop the previous day. The near-term bias is mildly bearish as SOL trades below the crucial daily 50, 100, and 200 Exponential Moving Averages (EMAs).
The Moving Average Convergence Divergence (MACD) line has slipped below the signal line, suggesting fading bullish momentum. The Relative Strength Index (RSI) at 46 remains below the midline, reinforcing a lack of firm buying pressure.
A decisive close below the support trendline would expose a downside to the recent swing low at $75.63, followed by the March 19 low of $67.50.
On the upside, Solana should reclaim the 50-day EMA at $92.51 to reinforce an upward trend.
(The technical analysis of this story was written with the help of an AI tool.)

يعتمد أكثر من مليون مستخدم على FXStreet للحصول على بيانات سوقية لحظية، وأدوات رسوم بيانية، ورؤى خبراء، وأخبار الفوركس. يساعد تقويمهم الاقتصادي الشامل والندوات التعليمية عبر الويب المتداولين على البقاء على اطلاع واتخاذ قرارات محسوبة. لدى FXStreet فريق يضم حوالي 60 محترفًا موزعين بين مقر برشلونة ومناطق عالمية مختلفة.
اقرأ المزيد


