
Sui Price Forecast: SUI rallies as Middle East tensions ease, CME Group to launch futures in May
بواسطة Manish Chhetri
تم التحديث: 8 Apr 2026


المقالات الشائعة
Sui (SUI) extends its upward move, trading above $0.95 on Wednesday after surging by more than 10% the previous day. Chicago Mercantile Exchange (CME) Group’s announcement to launch SUI futures in early May adds to the bullish narrative by signaling growing institutional interest.
- Sui price extends its gains on Wednesday, after surging over 10% in the previous day.
- CME Group announced on Tuesday that it will list SUI futures beginning May 4, expanding institutional access to the token.
- Improving risk sentiment, driven by a two-week US-Iran ceasefire, supports crypto markets and fuels gains in SUI.
Sui (SUI) extends its upward move, trading above $0.95 on Wednesday after surging by more than 10% the previous day. Chicago Mercantile Exchange (CME) Group’s announcement to launch SUI futures in early May adds to the bullish narrative by signaling growing institutional interest. Meanwhile, easing geopolitical tensions between the US and Iran following the announcement of a two-week ceasefire continues to support broader crypto market sentiment, further fueling SUI’s upward momentum.
Iran-US ceasefire boosts risk appetite
Risk sentiment across markets was boosted by news that the US and Iran brokered a two-week ceasefire and agreed to enter negotiations on April 10, potentially paving the way for lasting peace in the Middle East and the resumption of Gulf oil and gas exports through the vital Strait of Hormuz.
This easing of geopolitical tensions in the prolonged Middle East war supports broader crypto market sentiment, with Bitcoin surging over 4% on Tuesday and altcoins such as Sui following BTC’s lead, surging more than 10% that day. SUI continues its gains when writing on Wednesday, building on the previous day’s double-digit rally as improving geopolitical conditions lift risk assets.
CME Group to launch SUI futures
CME Group announced on Tuesday that it will list SUI futures beginning May 4, providing CFTC-regulated access for institutional and large-scale investors seeking exposure to the Sui ecosystem.
This news is bullish for SUI in the long term, as it brings regulated, institutional-grade access to Sui’s ecosystem for institutional investors, asset managers and hedge funds, boosting exposure, liquidity and credibility for the token.
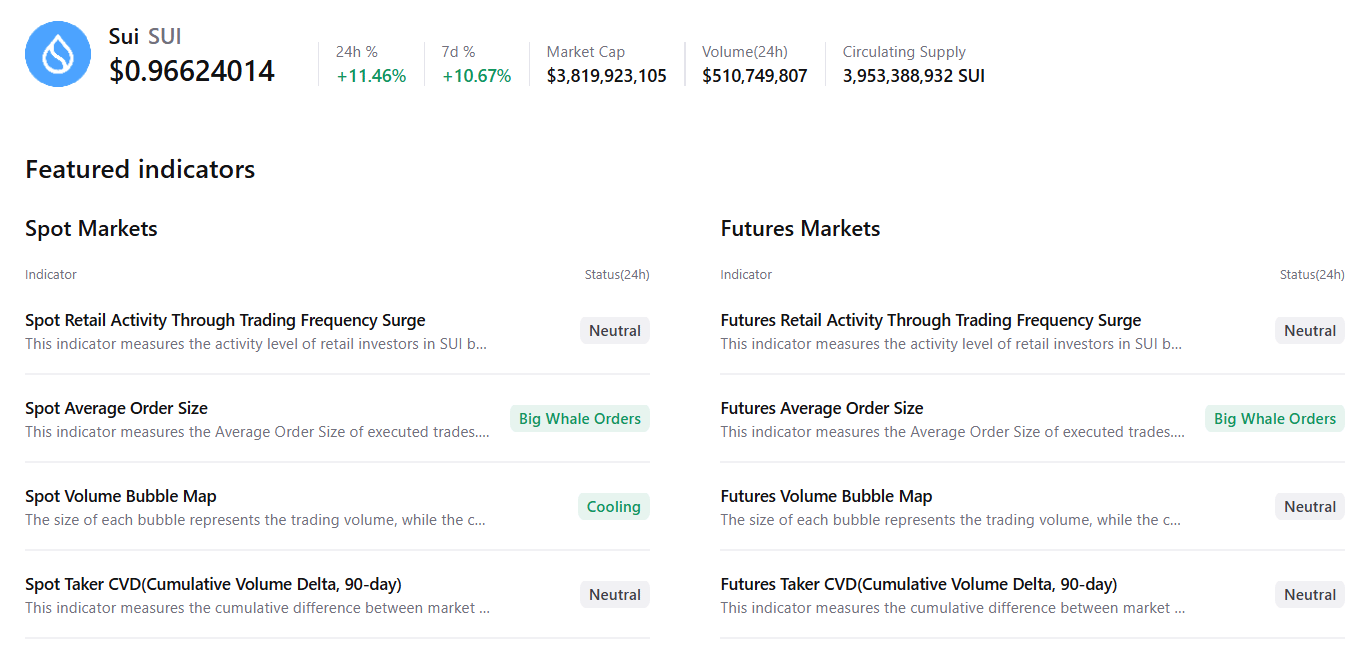
CryptoQuant’s summary data also supports a bullish outlook as SUI’s spot and futures markets show large whale orders with mostly neutral conditions across other metrics, suggesting a potential upside move.
Sui Price Forecast: SUI bulls aiming for the $1.00 mark
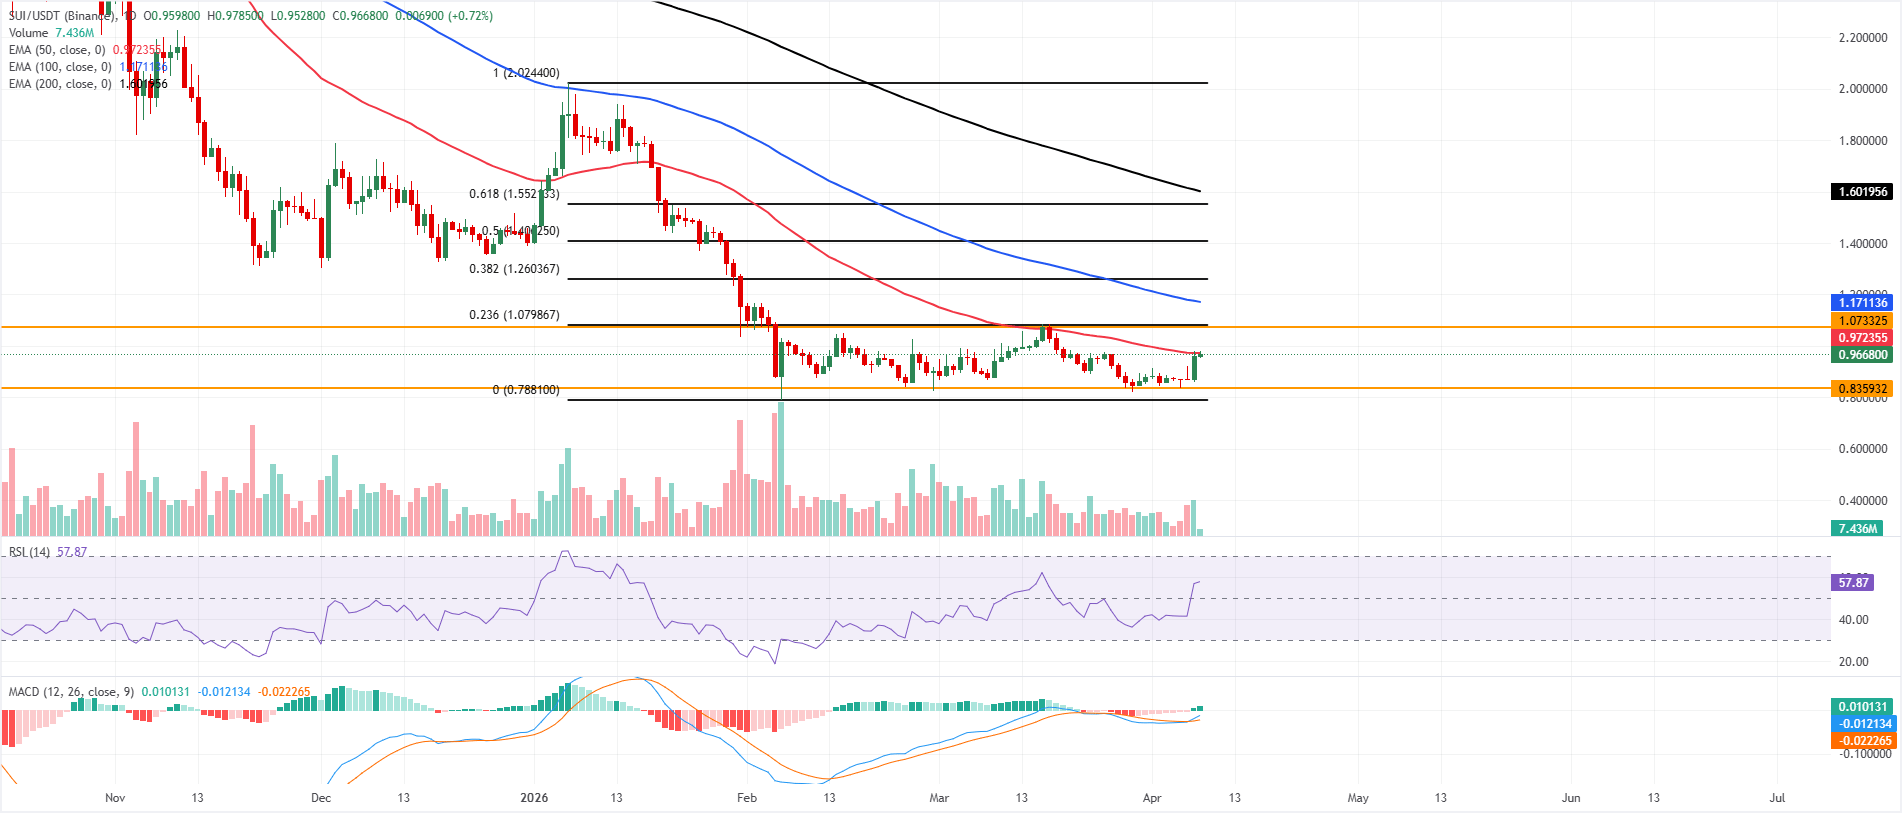
Sui price is trading at $0.96 on Wednesday. The near-term bias is neutral, with a mild upside tilt, as price stabilizes below the 50-day Exponential Moving Average (EMA) at $0.97 after rebounding from recent lows.
The Relative Strength Index (RSI) on the daily chart at 57 moves above the midline, indicating recovering bullish momentum, while the Moving Average Convergence Divergence (MACD) line has crossed above the signal line and turned positive, suggesting buying pressure is rebuilding, though still within a broader corrective context beneath the higher EMAs.
Initial resistance stands at the horizontal barrier near $1.07, aligned with the 23.6% Fibonacci retracement at $1.07 measured from the $0.78 low to the $2.02 high, and a daily close above this zone would open the way toward the 38.2% retracement at $1.26.
On the downside, immediate support lies at the recent swing area around $0.87, followed by the horizontal support at $0.83, where a break lower would weaken the nascent recovery and expose the prior base near $0.79.
(The technical analysis of this story was written with the help of an AI tool.)

يعتمد أكثر من مليون مستخدم على FXStreet للحصول على بيانات سوقية لحظية، وأدوات رسوم بيانية، ورؤى خبراء، وأخبار الفوركس. يساعد تقويمهم الاقتصادي الشامل والندوات التعليمية عبر الويب المتداولين على البقاء على اطلاع واتخاذ قرارات محسوبة. لدى FXStreet فريق يضم حوالي 60 محترفًا موزعين بين مقر برشلونة ومناطق عالمية مختلفة.
اقرأ المزيد


