
Top Crypto Gainers: River faces resistance, Humanity Protocol steadies, Polygon rebounds
بواسطة Vishal Dixit
تاريخ النشر: 13 Feb 2026 | تاريخ التعديل: 13 Feb 2026


المقالات الشائعة

Altcoins, including River (RIVER), Humanity Protocol (H) and Polygon (POL), rank as top-performing cryptocurrencies in the last 24 hours, defying the broader market pullback as Bitcoin (BTC) dropped below $67,000.
- River approaches a key resistance level on Friday, after a 40% rally the previous day.
- Humanity Protocol hovers above $0.1680 on Friday after rising roughly 55% in the last seven days.
- Polygon approaches $0.10 after an 8% jump on Thursday, ending the four-day decline.
Altcoins, including River (RIVER), Humanity Protocol (H) and Polygon (POL), rank as top-performing cryptocurrencies in the last 24 hours, defying the broader market pullback as Bitcoin (BTC) dropped below $67,000. The technical outlook indicates that the recovery in River faces resistance, whereas Humanity Protocol and Polygon have held steady on Friday following a rebound.
River extends rebound above $20
River is trading near $21.50 at press time on Friday, with resistance at the 50-day Exponential Moving Average (EMA) at $22.59 following Thursday's 40% rally. The U-shaped recovery in RIVER records more than 70% gains so far this week.
If the altcoin clears above $22.59, it could test the 50% retracement level at $30.08, measured from the January 26 high of $88.72 to the February 1 low of $10.19.
Technical indicators on the daily chart indicate a bullish shift in trend momentum. The Moving Average Convergence Divergence (MACD) rises toward the signal line, potentially indicating a bullish crossover as negative histograms contract, indicating a decline in selling pressure. At the same time, the Relative Strength Index (RSI) is at 48, hovering near the midline and indicating a neutral stance.
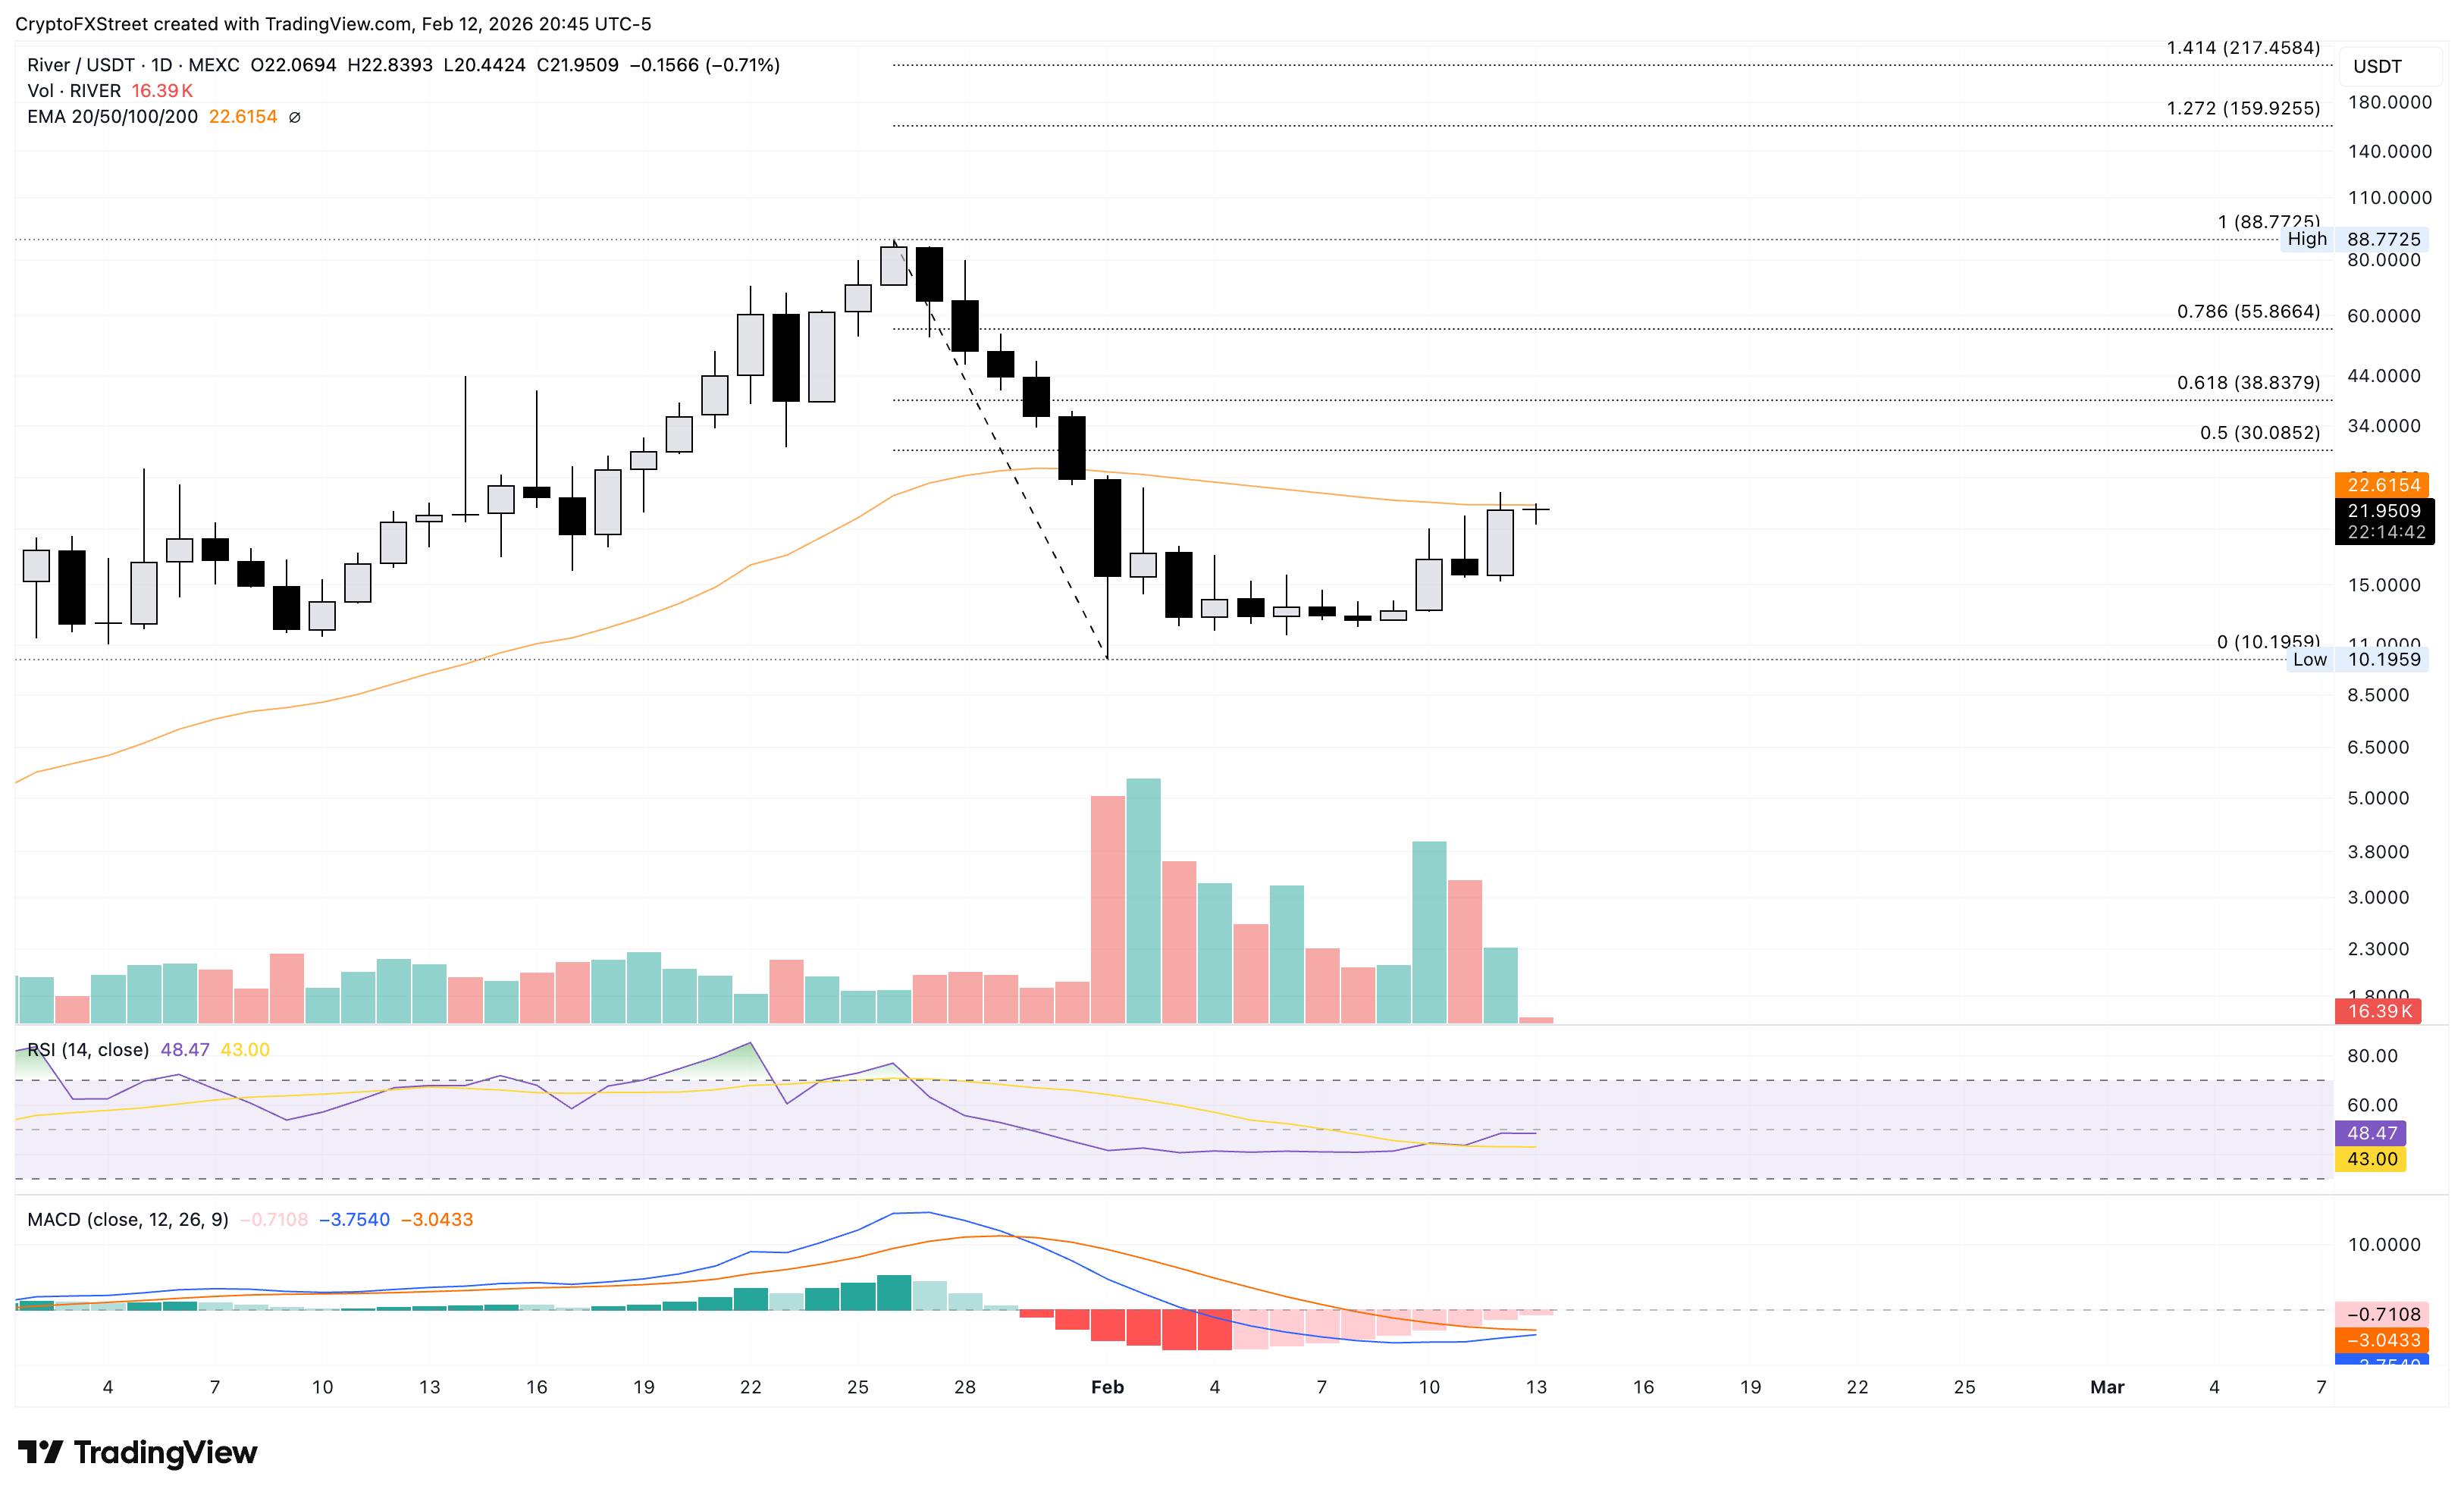
On the downside, a reversal from the 50-day EMA at $22.59 could retest the $10.19 support level.
Humanity Protocol rally targets $0.20 resistance
Humanity Protocol extended its rebound from the 200-day EMA at $0.1125 for the seventh consecutive day, accounting for over 75% gains. At the time of writing, H is trading above $0.175, crossing the 50-day EMA at $0.1464.
The altcoin is approaching the 61.8% Fibonacci retracement level at $0.1764, measured from the October 24 high at $0.4010 to the December 7 low at $0.0467. A decisive close above this level could challenge the $0.2077 resistance, which has previously capped gains twice since late December.
Beyond this, the 78.6% Fibonacci retracement level at $0.2532 could serve as the upper resistance level.
The RSI on the daily chart is at 61, indicating a steady recovery above the midline, with further upside before reaching overbought levels, confirming a bullish bias. The MACD line on the same chart crosses above the zero line as positive histograms expand, indicating rising bullish momentum.
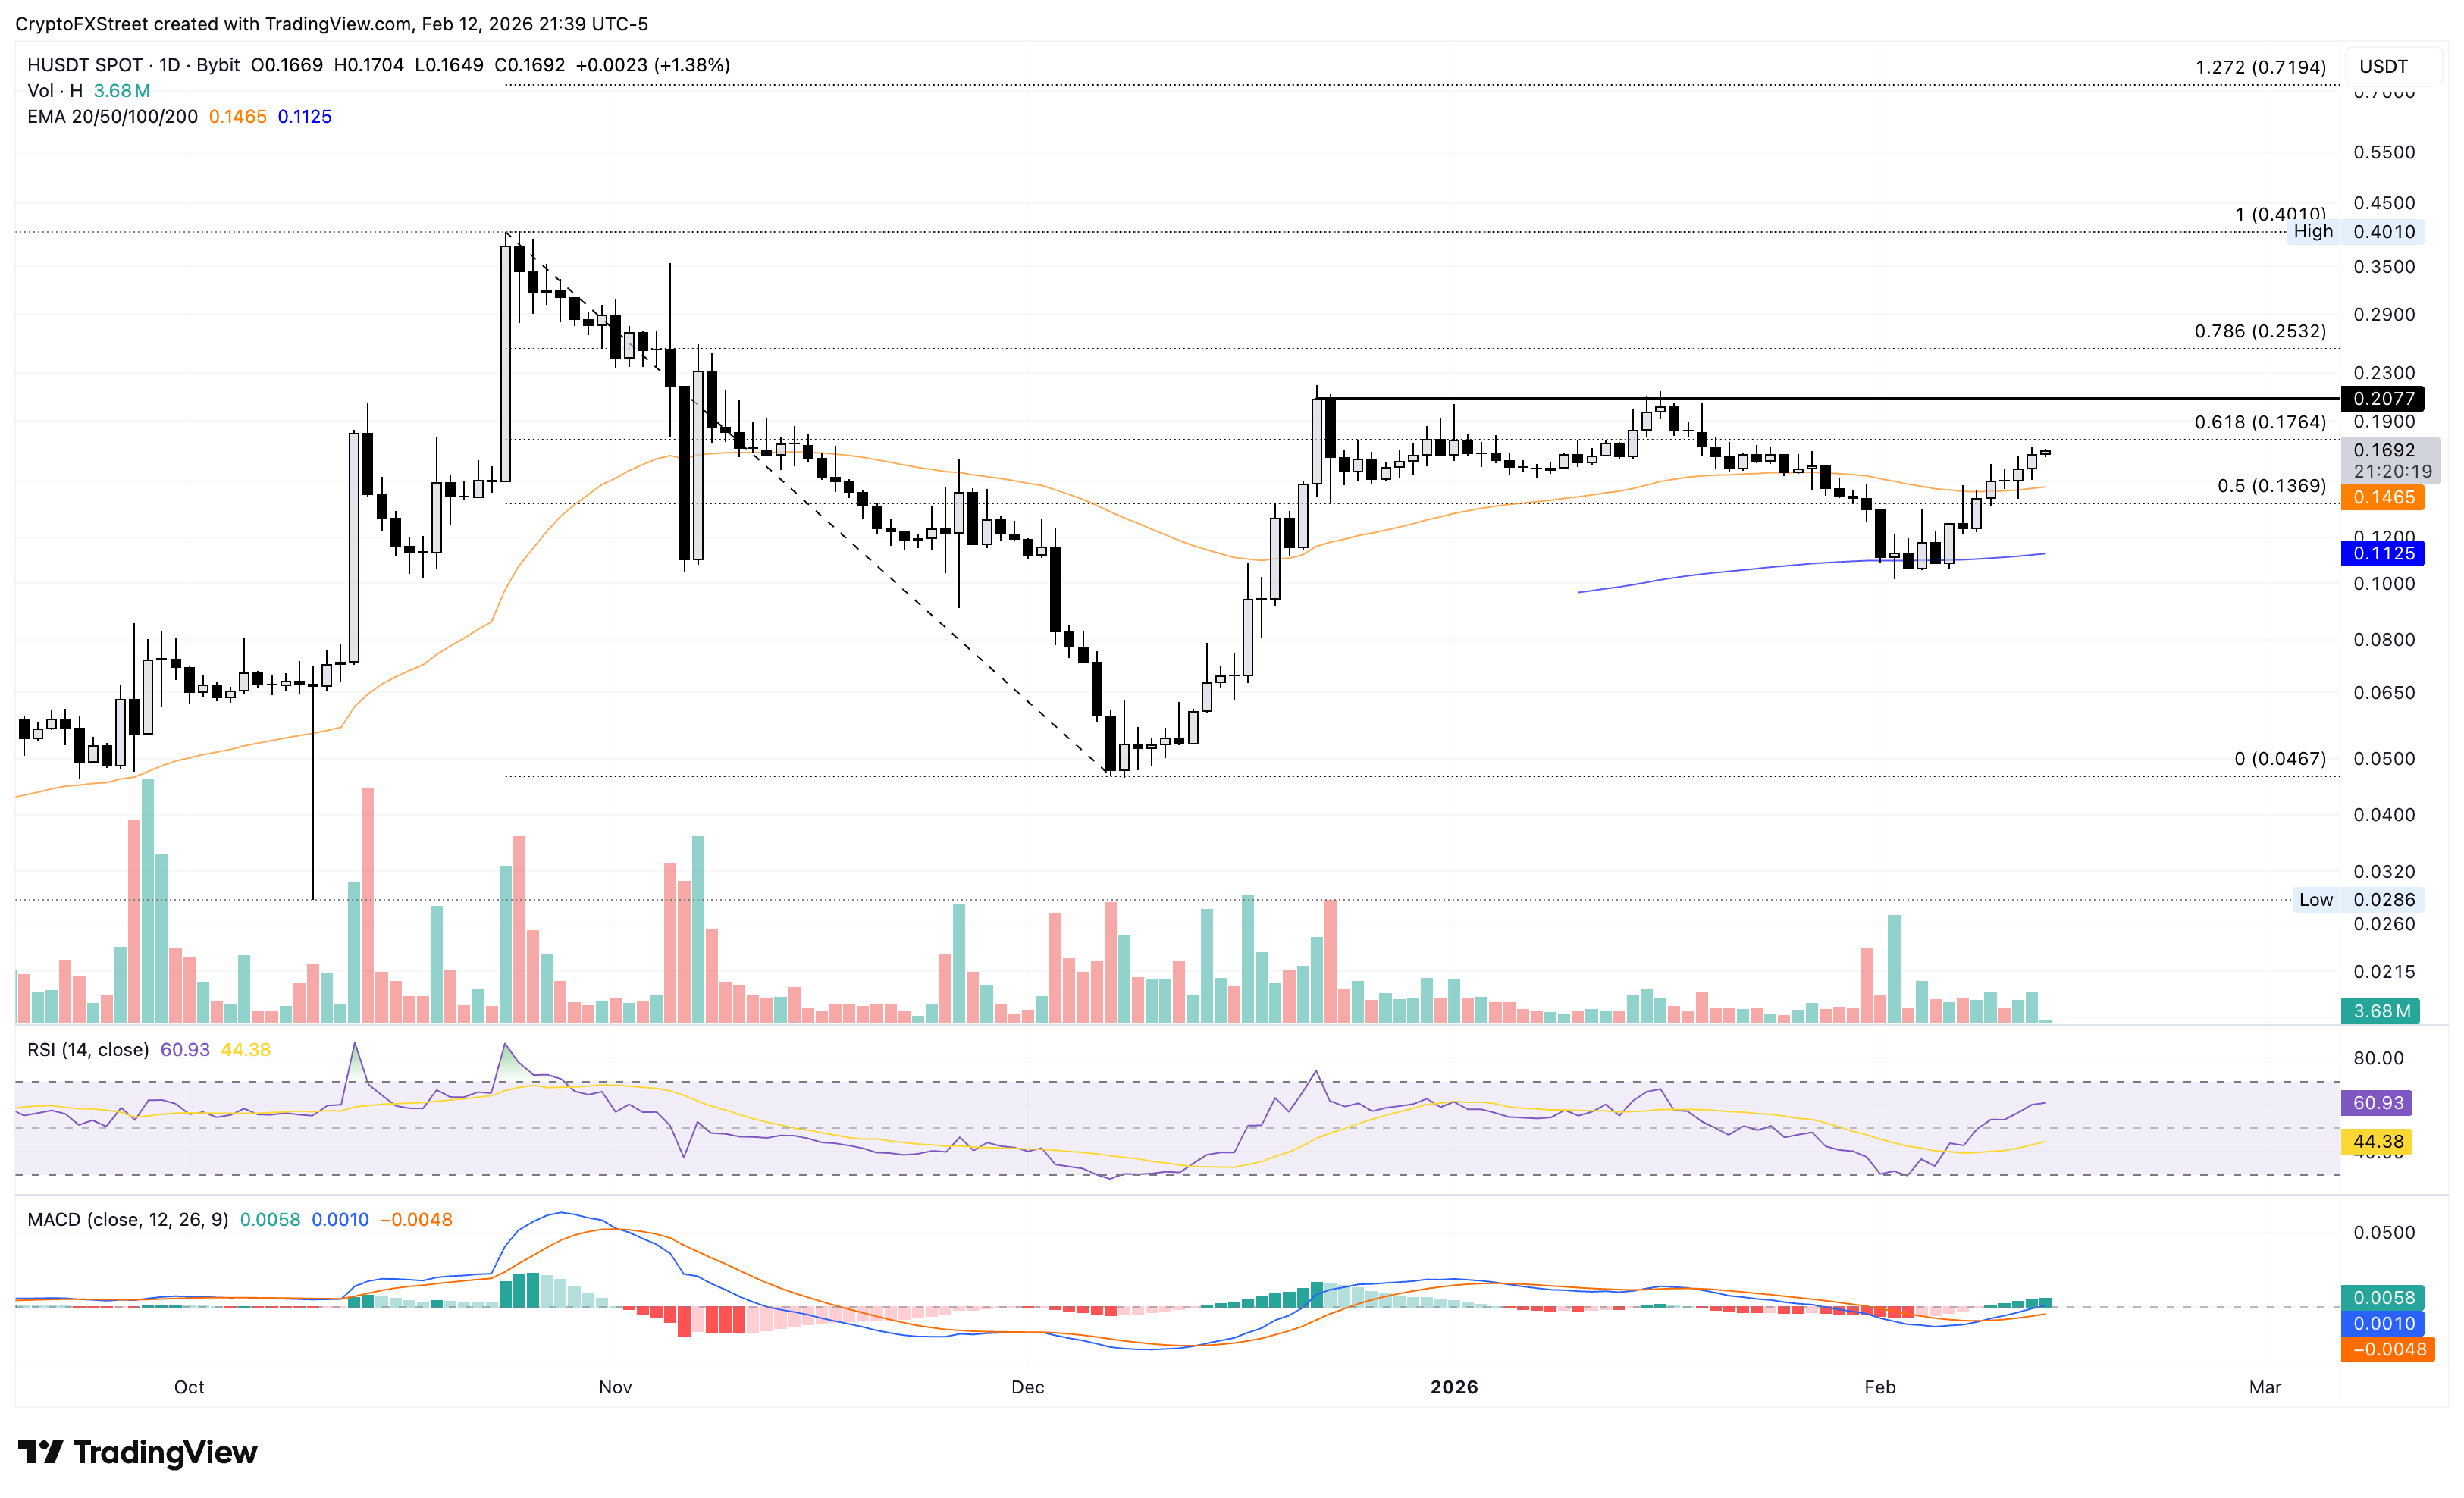
On the flip side, the 50-day EMA at $0.1465 and the 50% retracement level at $0.1369 could serve as crucial support levels.
Polygon recovery suggests a double-bottom reversal
Polygon is up over 1% at press time on Friday, extending its 8% recovery from the previous day. The altcoin is approaching the $0.10 psychological level, extending its rebound after a four-day decline. However, the declining trend in the 50- and 200-day EMAs confirms the prevailing bearish bias.
The renewed recovery in POL suggests a potential double-bottom reversal, with the psychological level serving as the neckline. A decisive close above $0.10 could extend the recovery to the 50-day EMA at $0.1167.
The technical indicators on the daily chart confirm the short-term recovery in bullish momentum. The RSI at 40 bounces off the oversold boundary, indicating reduced selling pressure. Meanwhile, the MACD line converges with the signal line, suggesting a bullish crossover as negative histograms decline, thereby reaffirming the decline in bearish momentum.
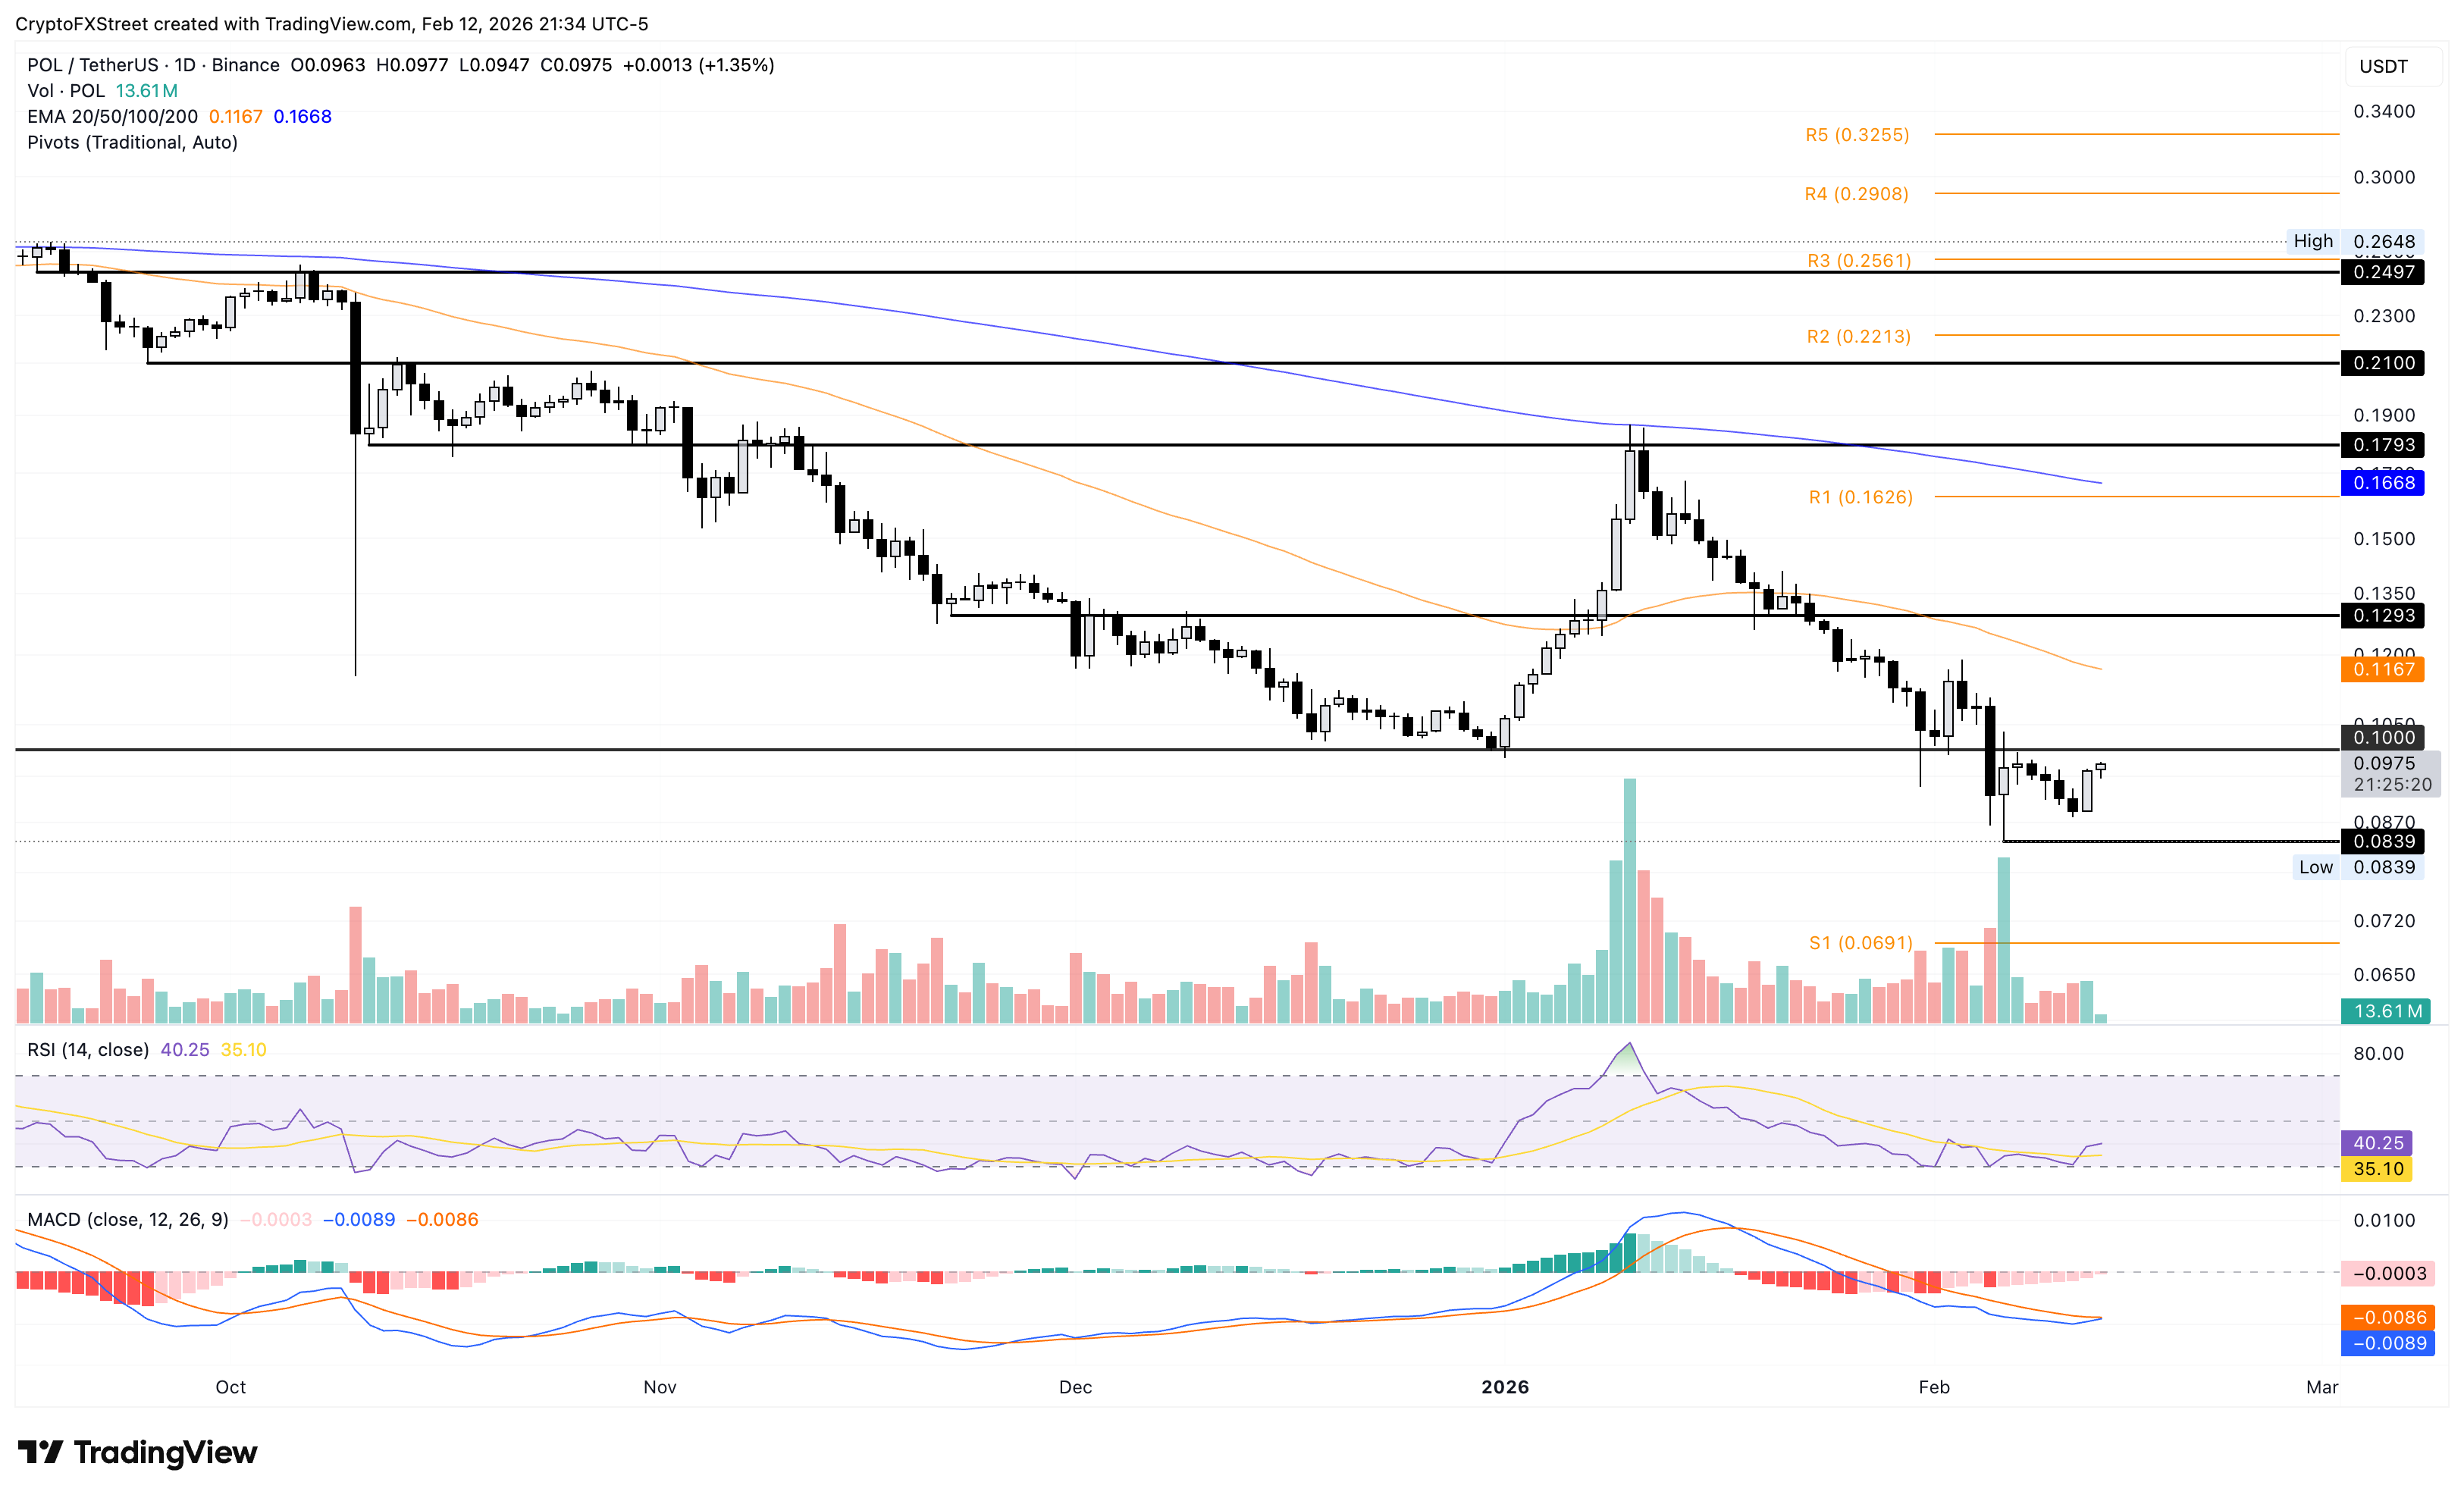
On the flip side, the crucial support for Polygon remains the February 6 low at $0.0839 and a deeper zone at the S1 pivot point at $0.0691.

يعتمد أكثر من مليون مستخدم على FXStreet للحصول على بيانات سوقية لحظية، وأدوات رسوم بيانية، ورؤى خبراء، وأخبار الفوركس. يساعد تقويمهم الاقتصادي الشامل والندوات التعليمية عبر الويب المتداولين على البقاء على اطلاع واتخاذ قرارات محسوبة. لدى FXStreet فريق يضم حوالي 60 محترفًا موزعين بين مقر برشلونة ومناطق عالمية مختلفة.
اقرأ المزيد


