
Top Crypto Gainers: Terra surges 40% as MemeCore, XDC Network holds gains
بواسطة Vishal Dixit
تاريخ النشر: 11 Dec 2025 | تاريخ التعديل: 11 Dec 2025


المقالات الشائعة

Terra (LUNA), MemeCore (M), and XDC Network (XDC) emerge as top performers over the last 24 hours. LUNA leads the rally with 40% gains while MemeCore and XDC hold steady on Thursday after 6% and 3% rise, respectively, on the previous day.
- Terra soars over 40% in the last 24 hours, likely on a new network update ahead of Do Kwon’s hearing.
- MemeCore holds steady on Thursday after three days of recovery, signaling a potential double-bottom reversal.
- XDC Network eyes reclaiming the $0.05000 psychological level after Wednesday's 3% gains.
Terra (LUNA), MemeCore (M), and XDC Network (XDC) emerge as top performers over the last 24 hours. LUNA leads the rally with 40% gains while MemeCore and XDC hold steady on Thursday after 6% and 3% rise, respectively, on the previous day. Technically, the altcoins are close to resistance levels, which could halt the recovery.
Terra’s rally hits key resistance levels
Terra trades at $0.2002 at press time on Thursday, up by almost 100% so far this week. The sudden recovery run aims to hold a decisive close above the July high at $0.1990, which would improve the breakout odds of the $0.2490 level (May’s high).
Terra’s and Luna Classic’s recovery week is likely driven by Do Kwon’s sentence hearing on Thursday and the fresh network upgrade to bolster the security, functionality, and reliability of the Terra ecosystem.
The Relative Strength Index (RSI) at 79 on the daily chart suggests overbought conditions, indicating potentially unreliable buying pressure. Meanwhile, the Moving Average Convergence Divergence (MACD) continues to rise, with successively higher green histogram bars, indicating a strengthening bullish momentum.
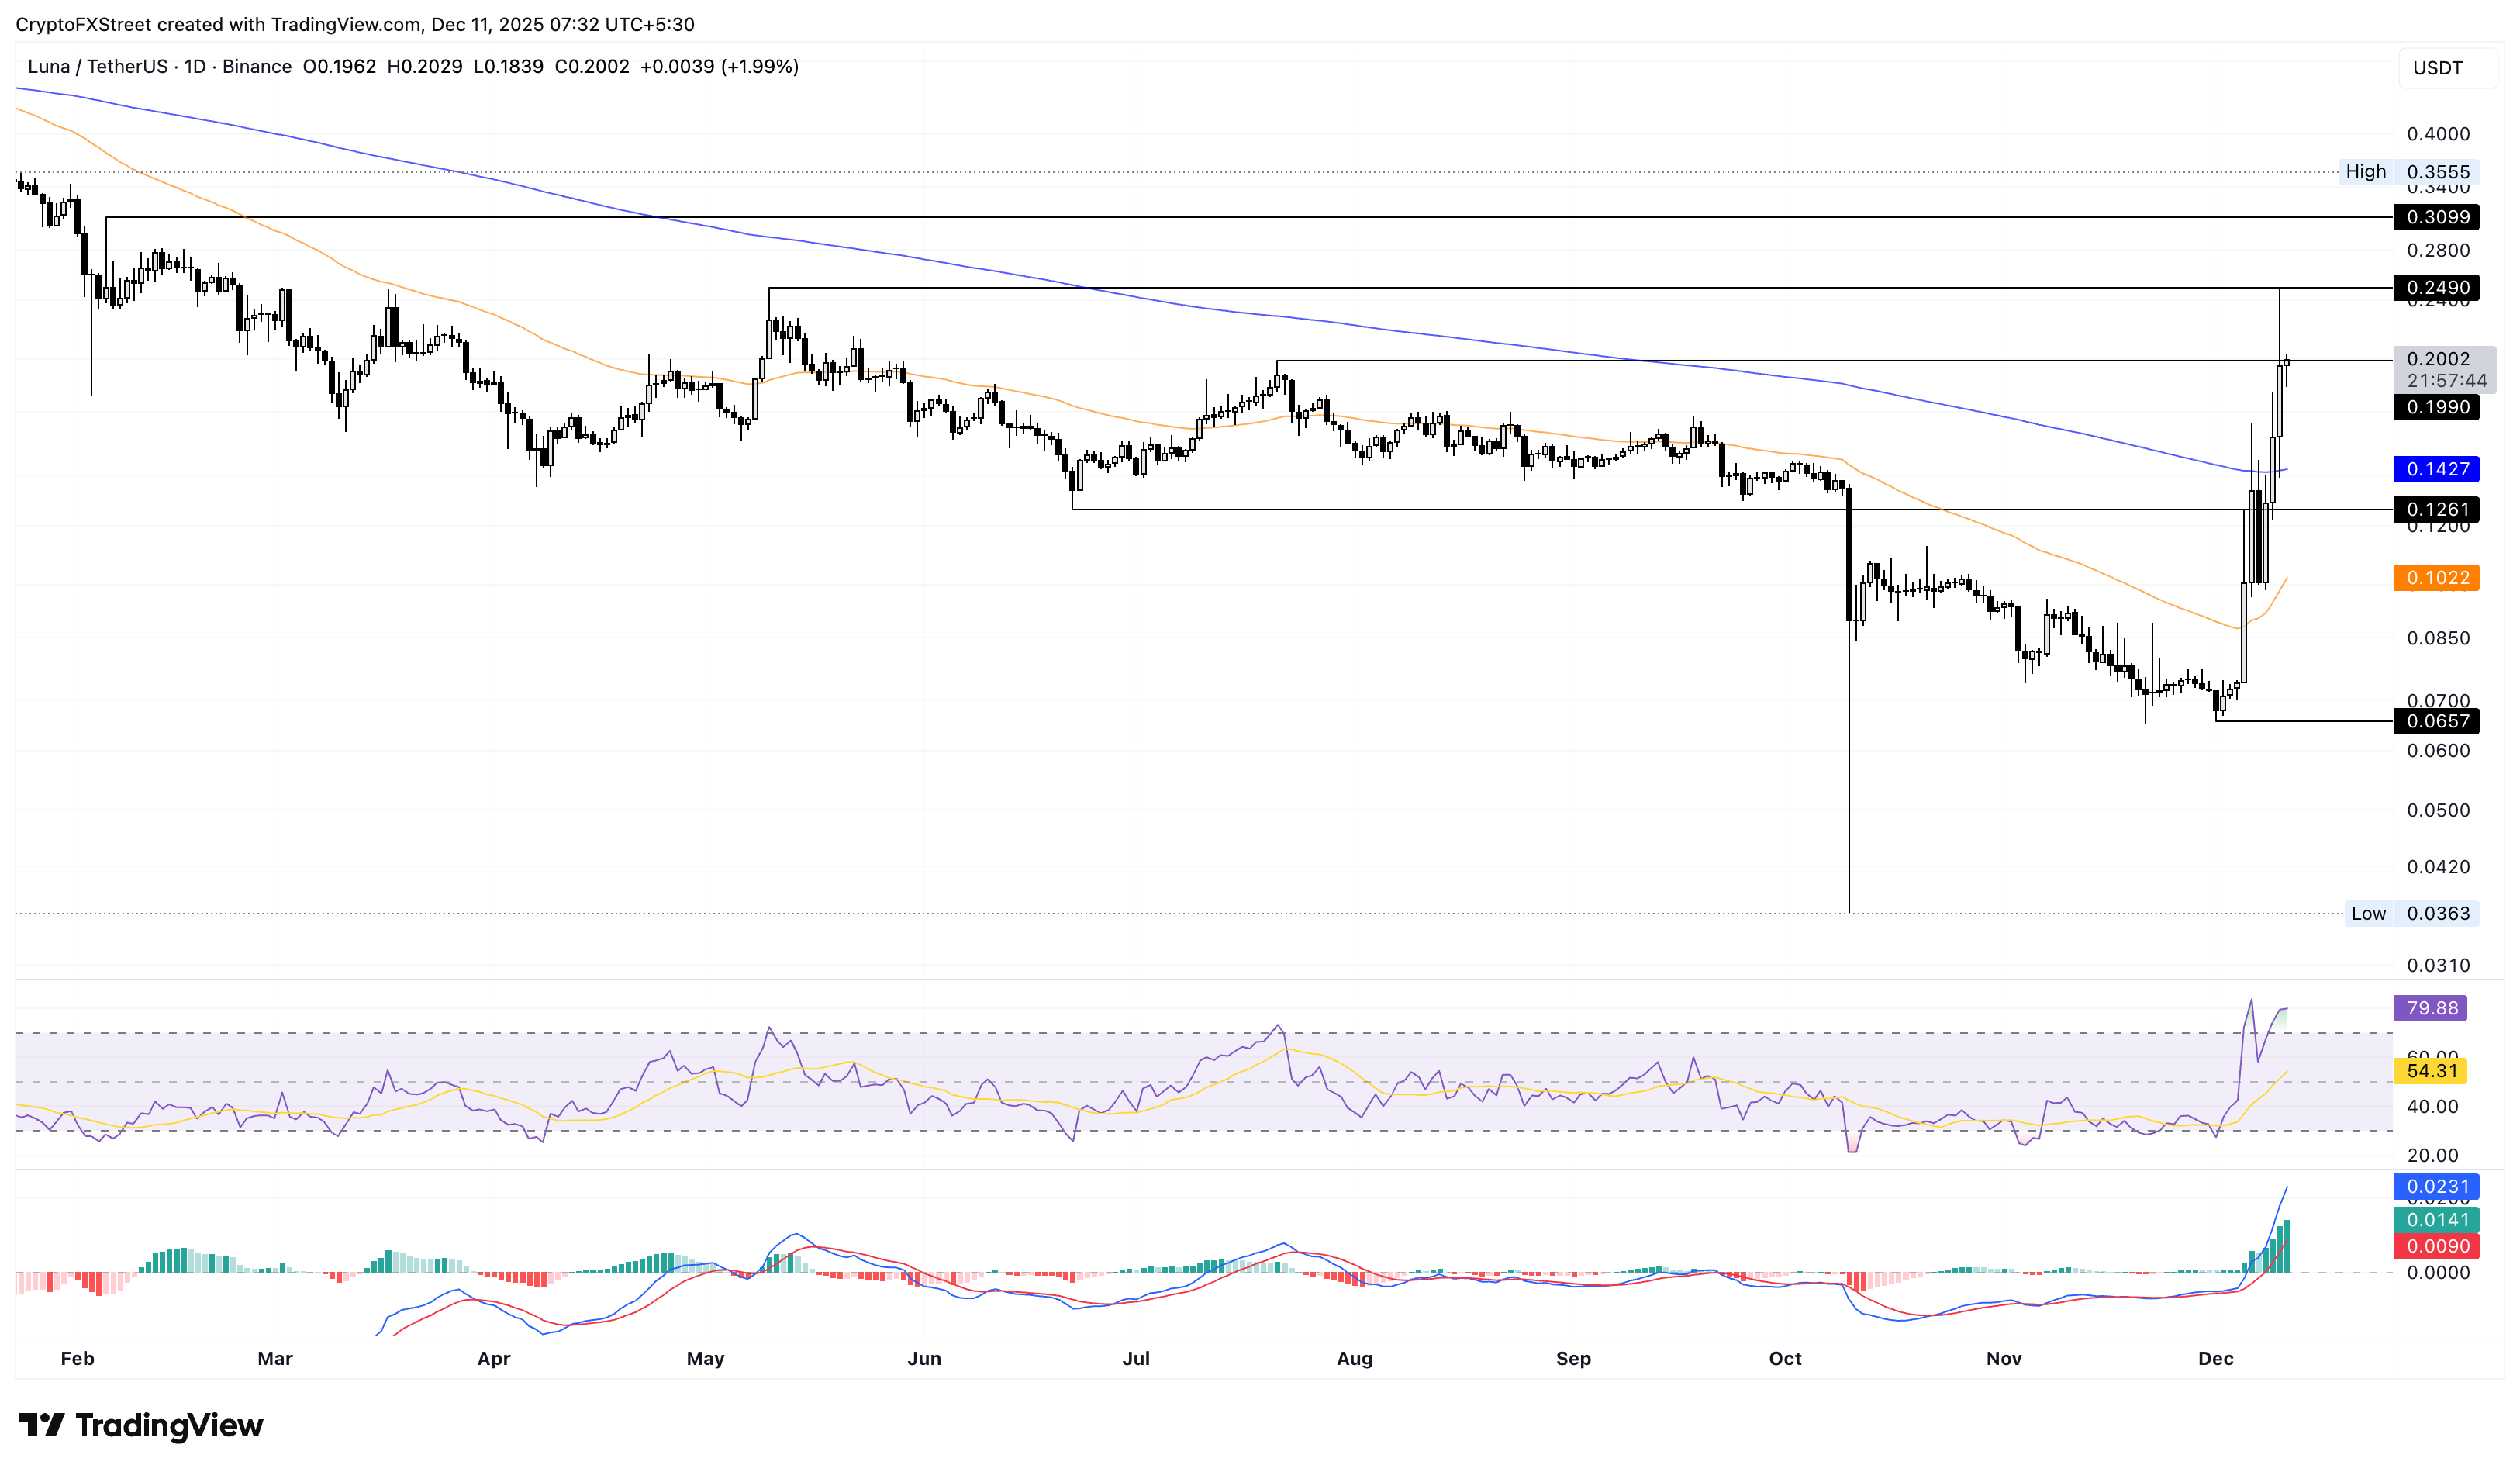
Looking down, if Terra reverses from $0.2000, it could test the 200-day Exponential Moving Average (EMA) at $0.1427.
MemeCore eyes a breakout of the double bottom pattern
MemeCore trades in the green at press time on Thursday, after three consecutive days of recovery. The M token is up nearly 16% this week so far, following Wednesday's 6% rise.
The steady recovery this week signals a potential double bottom reversal from $1.25, with the neckline at the November 29 high of $1.52. If M secures a decisive close above this level, it could extend the rally to the 50-day EMA at $1.77, followed by the R1 Pivot Point at $2.56.
The RSI 39 shows a steady rise from the oversold zone, indicating a bullish divergence with the double bottom pattern on the daily chart. This increases the possibility of an upward trend.
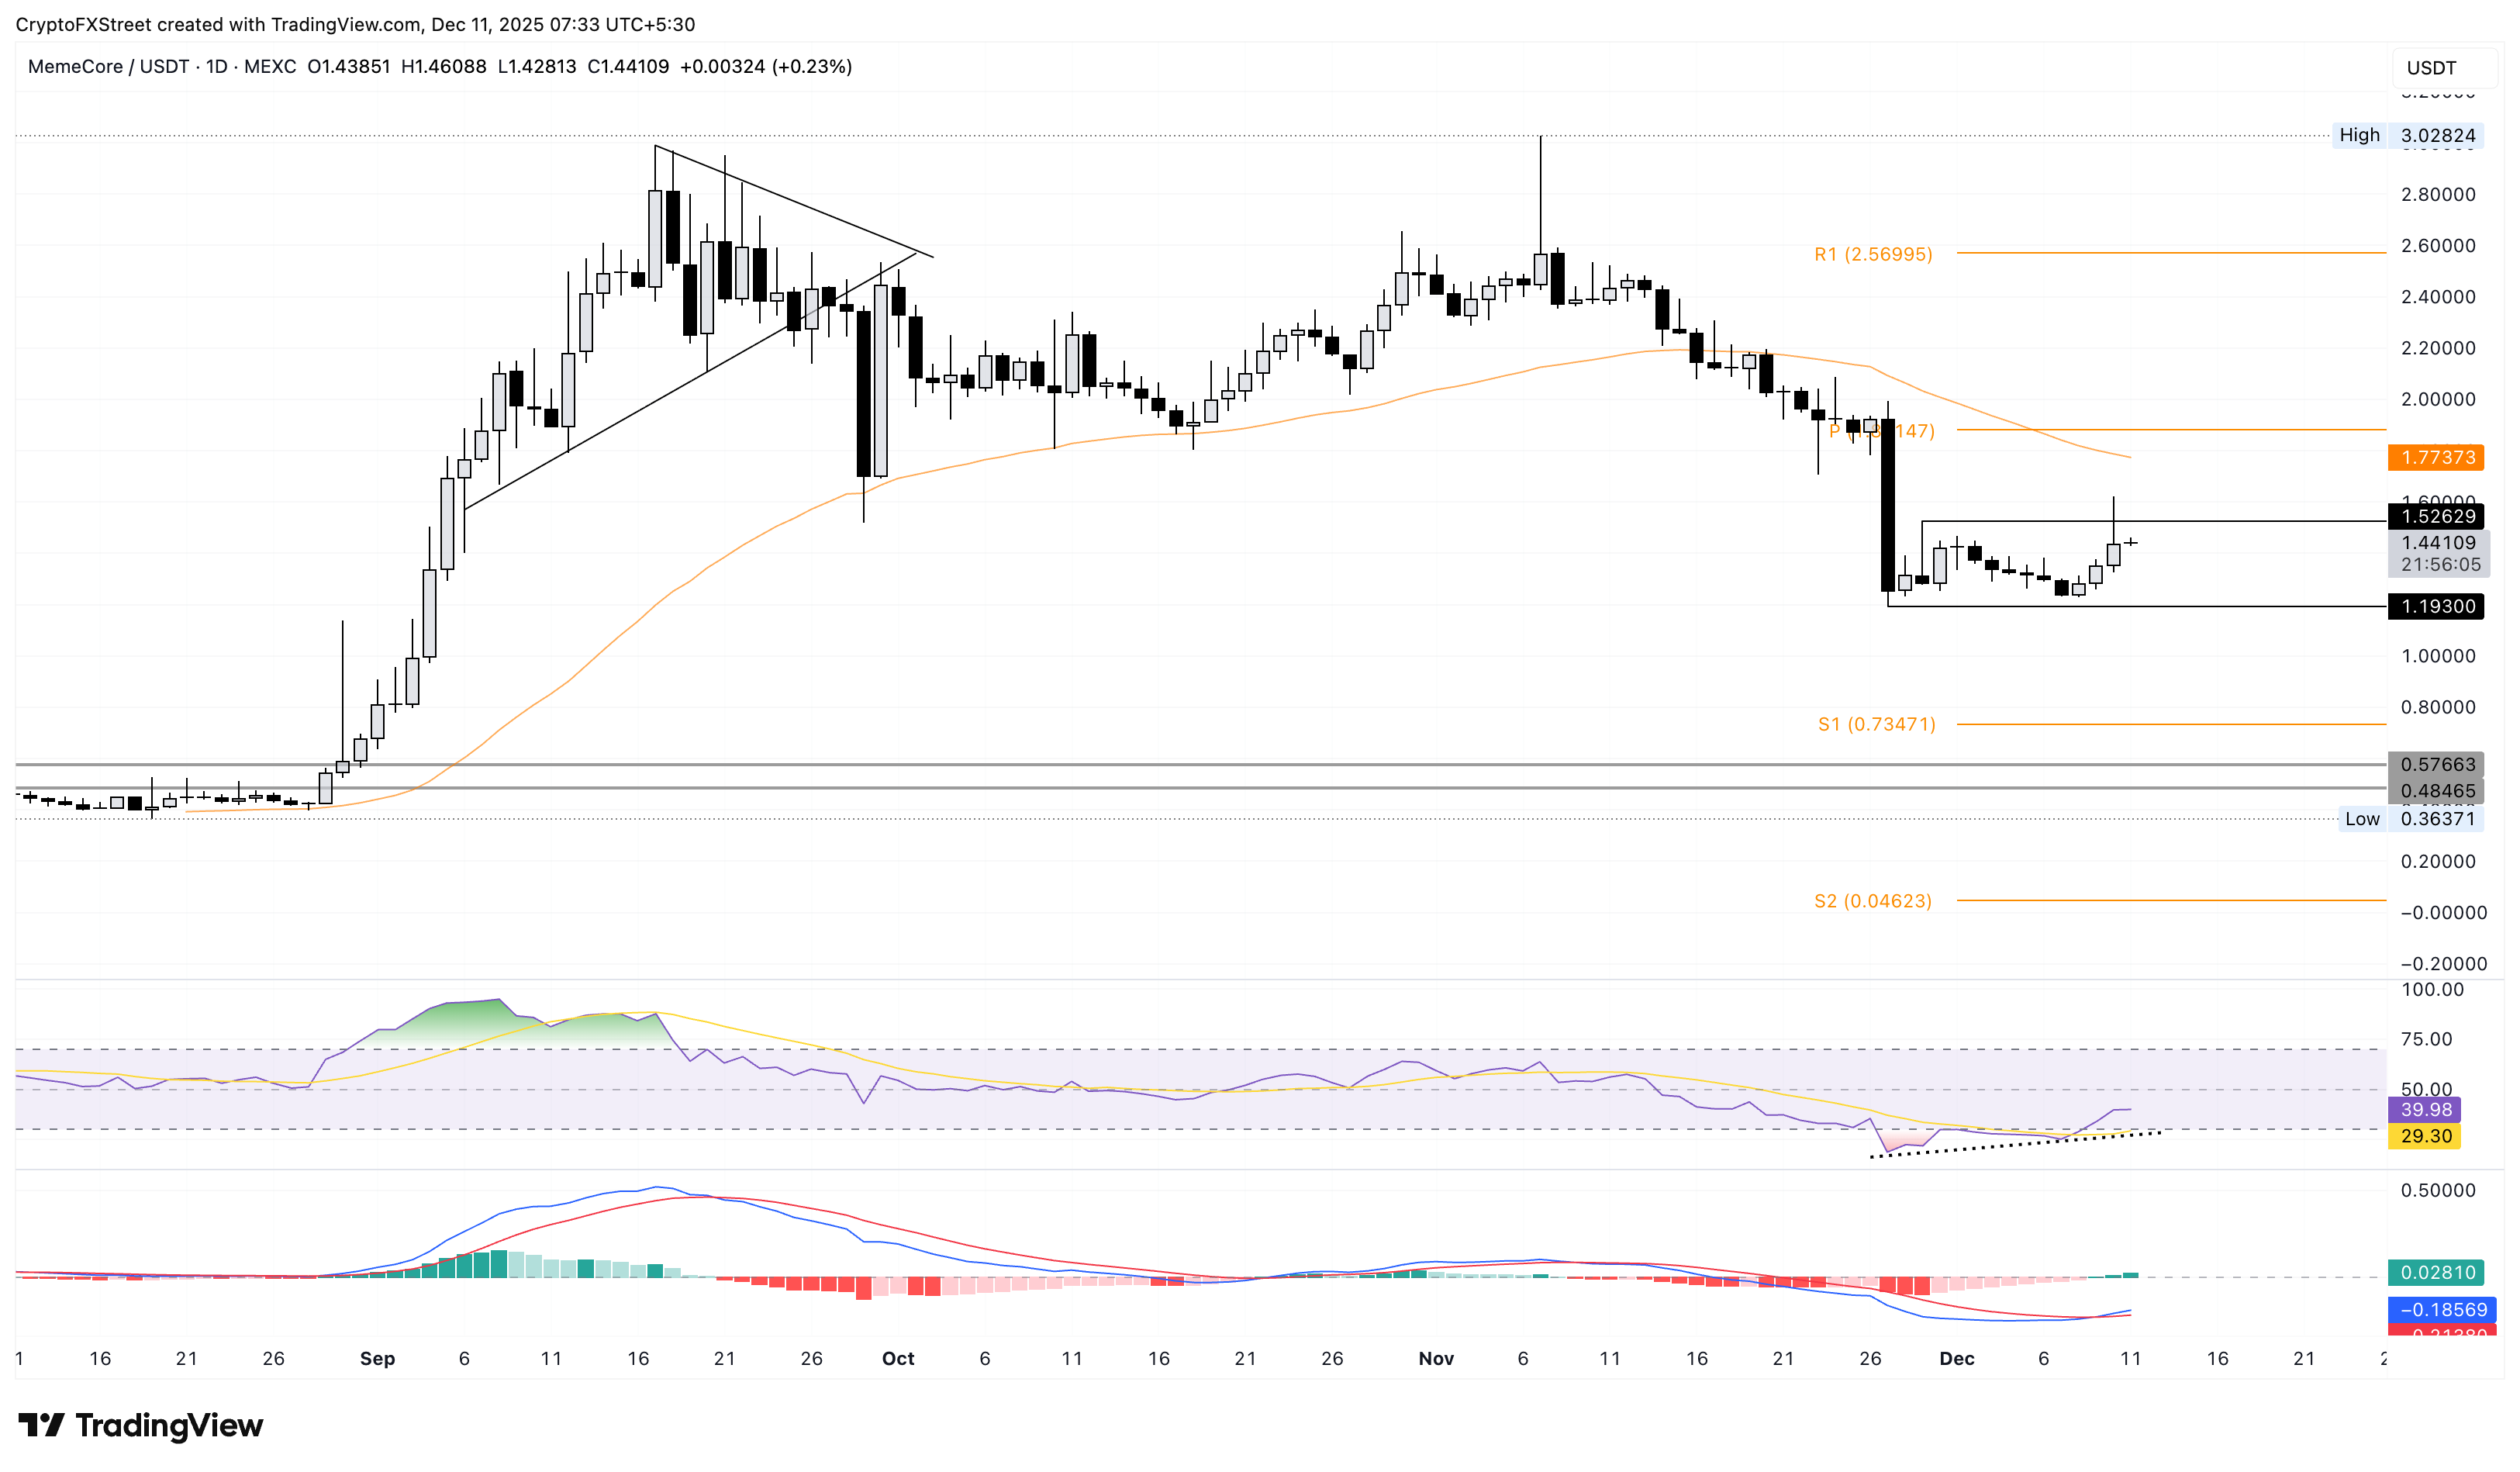
At the same time, the MACD extends the upward trend after crossing above the signal line on Tuesday. This broadens the buy signal for MemeCore while indicating a steady rise in bullish momentum.
XDC Network struggles at the psychological milestone
XDC Network ticks lower by nearly 1% at the time of writing on Thursday, following a 3% rise on the previous day. The intraday reversal keeps the XDC token below the $0.05000 psychological mark, and a long-standing resistance trendline formed by connecting the highs of July 29 and October 6.
If XDC resurfaces above $0.05000, it should surpass the resistance trendline at $0.05200 to reinstate an uptrend. Still, the 50-day EMA at $0.05502 and the R1 Pivot Point at $0.06141 could serve as overhead resistances.
Technically, the RSI is at 41 inches toward the oversold zone, indicating intense bearish pressure, while the MACD flashes a buy signal with a bullish crossover.
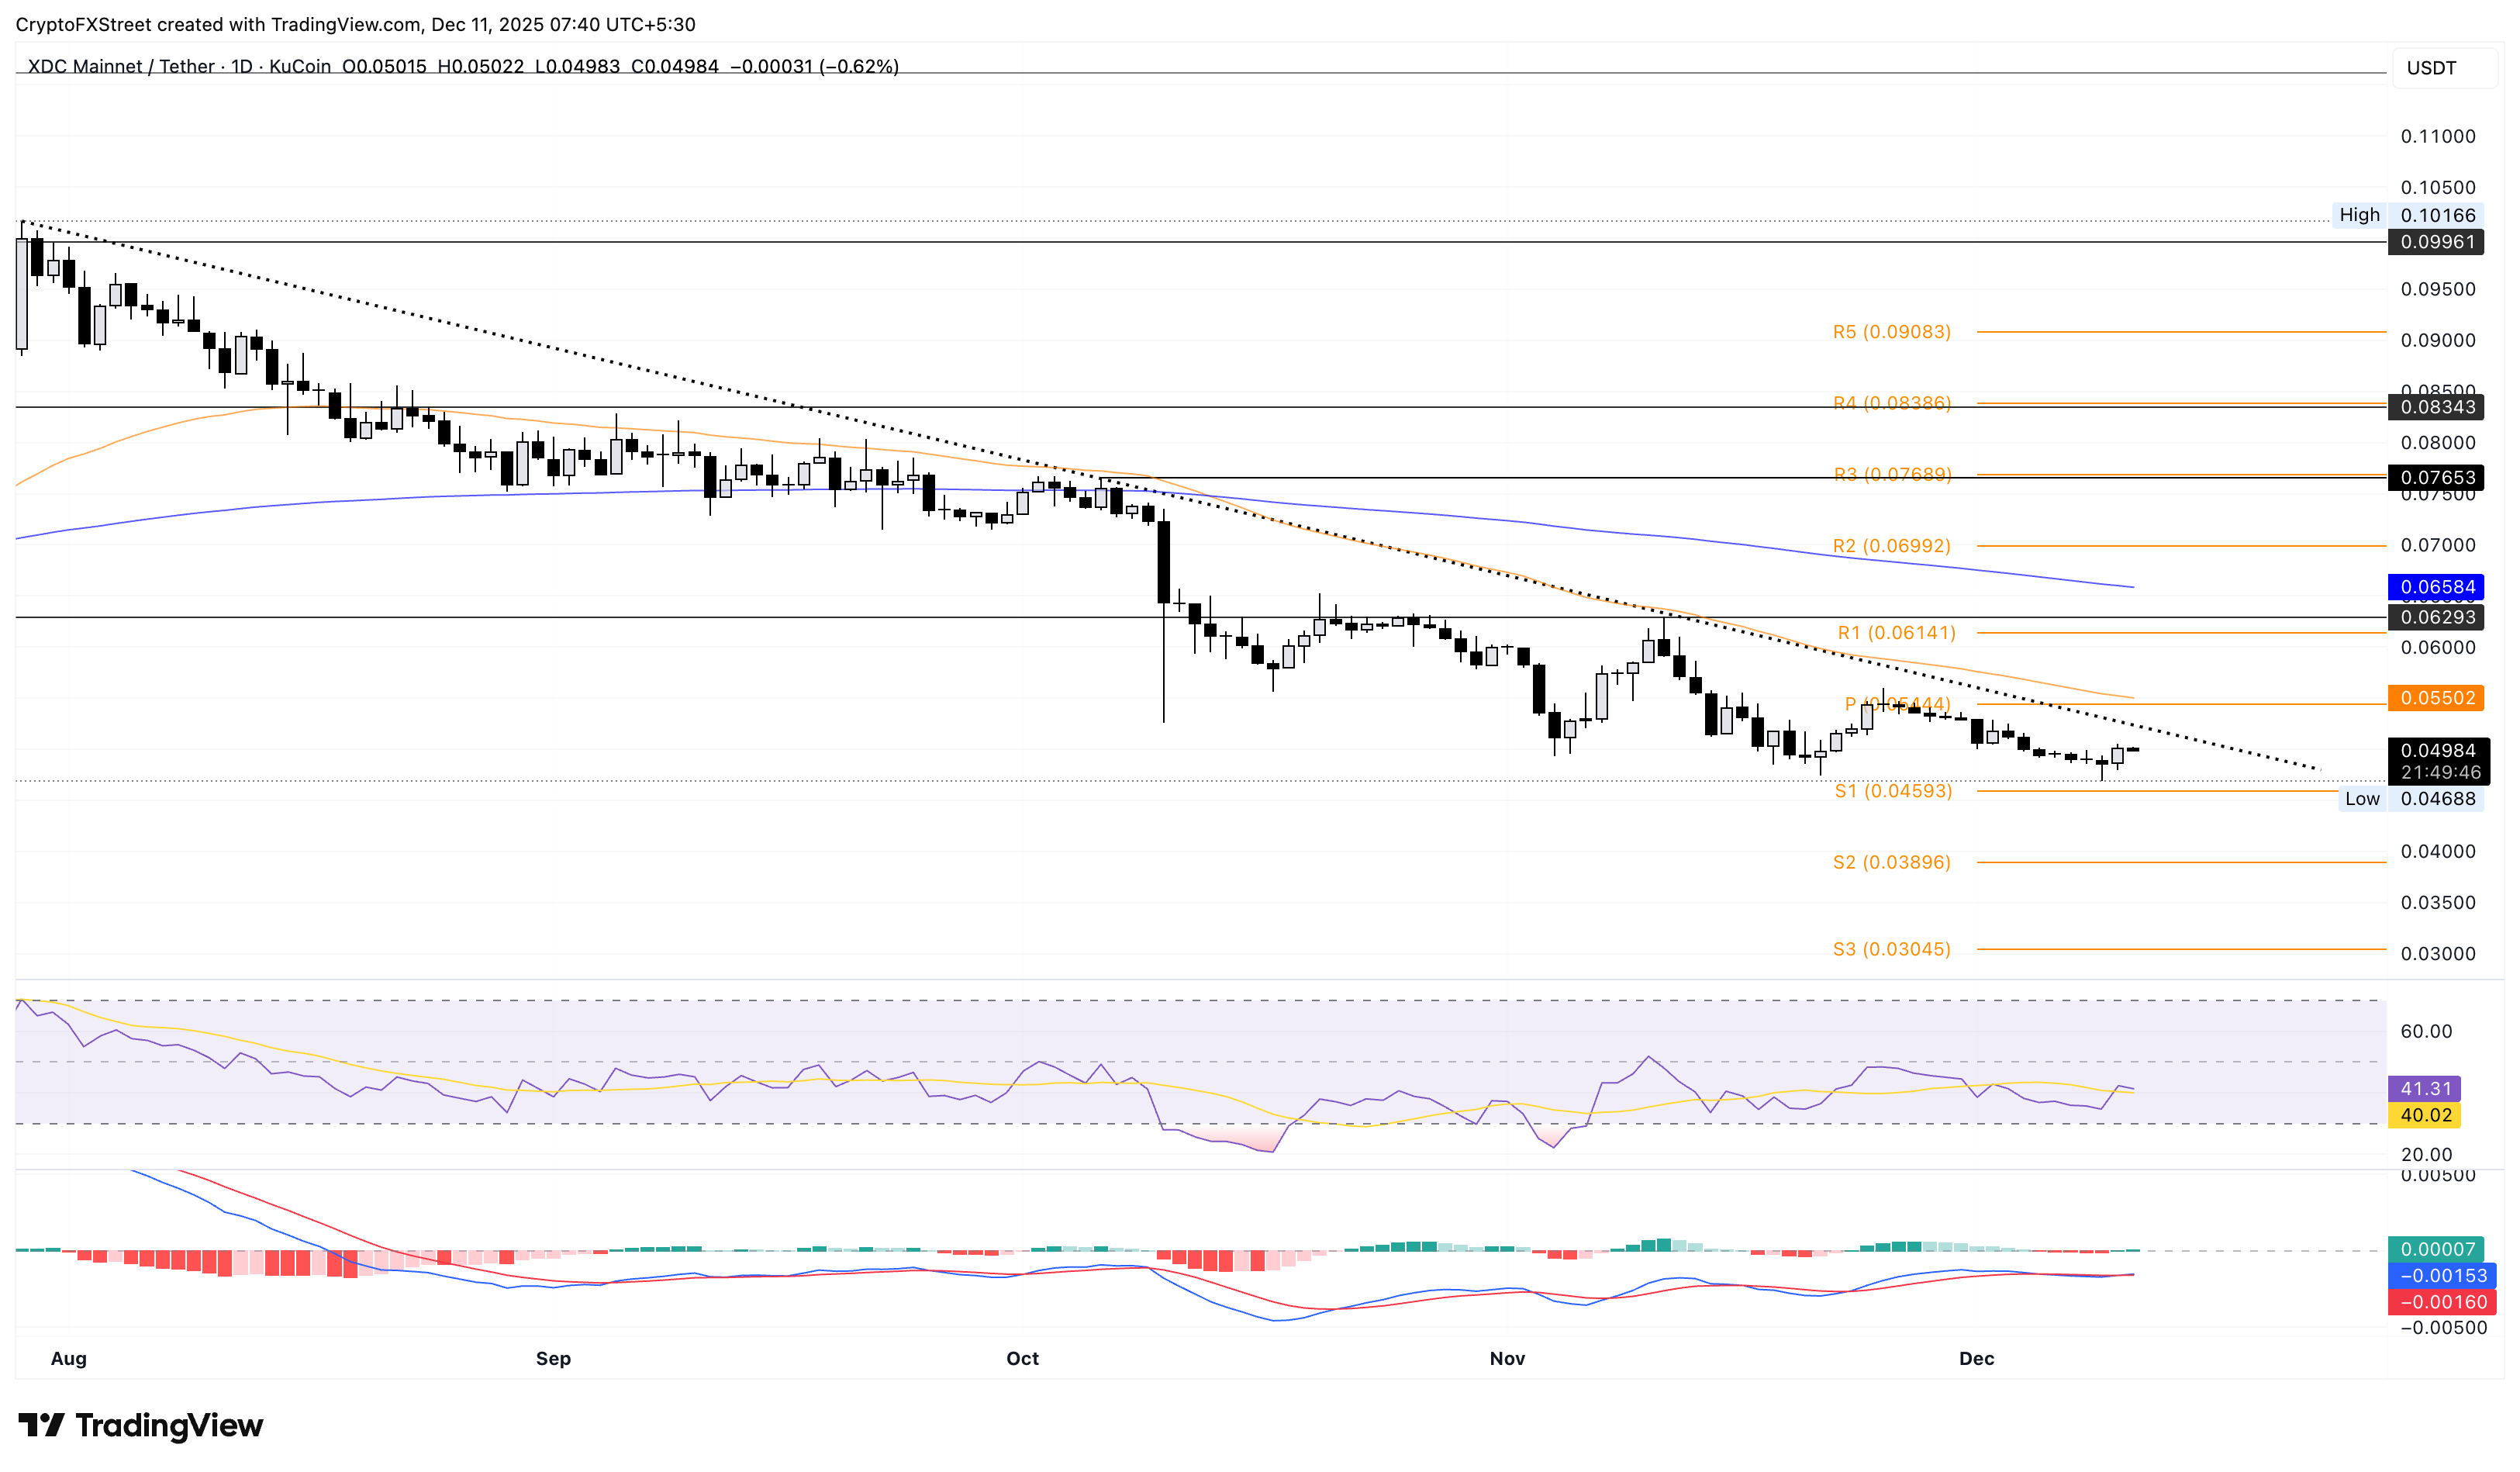
On the flip side, if XDC falls below the S1 Pivot Point at $0.04593, it could aim for the S2 Pivot Point at $0.03896.

يعتمد أكثر من مليون مستخدم على FXStreet للحصول على بيانات سوقية لحظية، وأدوات رسوم بيانية، ورؤى خبراء، وأخبار الفوركس. يساعد تقويمهم الاقتصادي الشامل والندوات التعليمية عبر الويب المتداولين على البقاء على اطلاع واتخاذ قرارات محسوبة. لدى FXStreet فريق يضم حوالي 60 محترفًا موزعين بين مقر برشلونة ومناطق عالمية مختلفة.
اقرأ المزيد


