
United States Dollar Index (DXY) Price Forecast: Under pressure below 99.60
بواسطة Guillermo Alcala
تم التحديث: 15 Jun 2026


المقالات الشائعة

The US Dollar (USD) has opened the week on its back foot, weighed down by an improved appetite for risk, following news of a peace deal between the US and Iran.
- The US Dollar Index drops to the lower range of the 99.00s, as risk appetite improves.
- News of a US-Iran agreement to end the war has boosted market sentiment on Monday.
- DXY price action has breached the bottom of the ascending channel.
The US Dollar (USD) has opened the week on its back foot, weighed down by an improved appetite for risk, following news of a peace deal between the US and Iran. The USD Index, which measures the value of the Dollar against a basket of currencies, extended its reversal from last week’s highs and has hit a fresh 10-day low of 99.30 so far.
Investors have welcomed a memorandum of understanding between Washington and Tehran that would end the 100-day war and reopen the Strait of Hormuz. Details about the agreement are scarce so far, but the market has reacted with moderate optimism, sending Treasury yields and the USD lower, amid higher demand for risk assets.
Technical Analysis: DXY breaks below the channel top
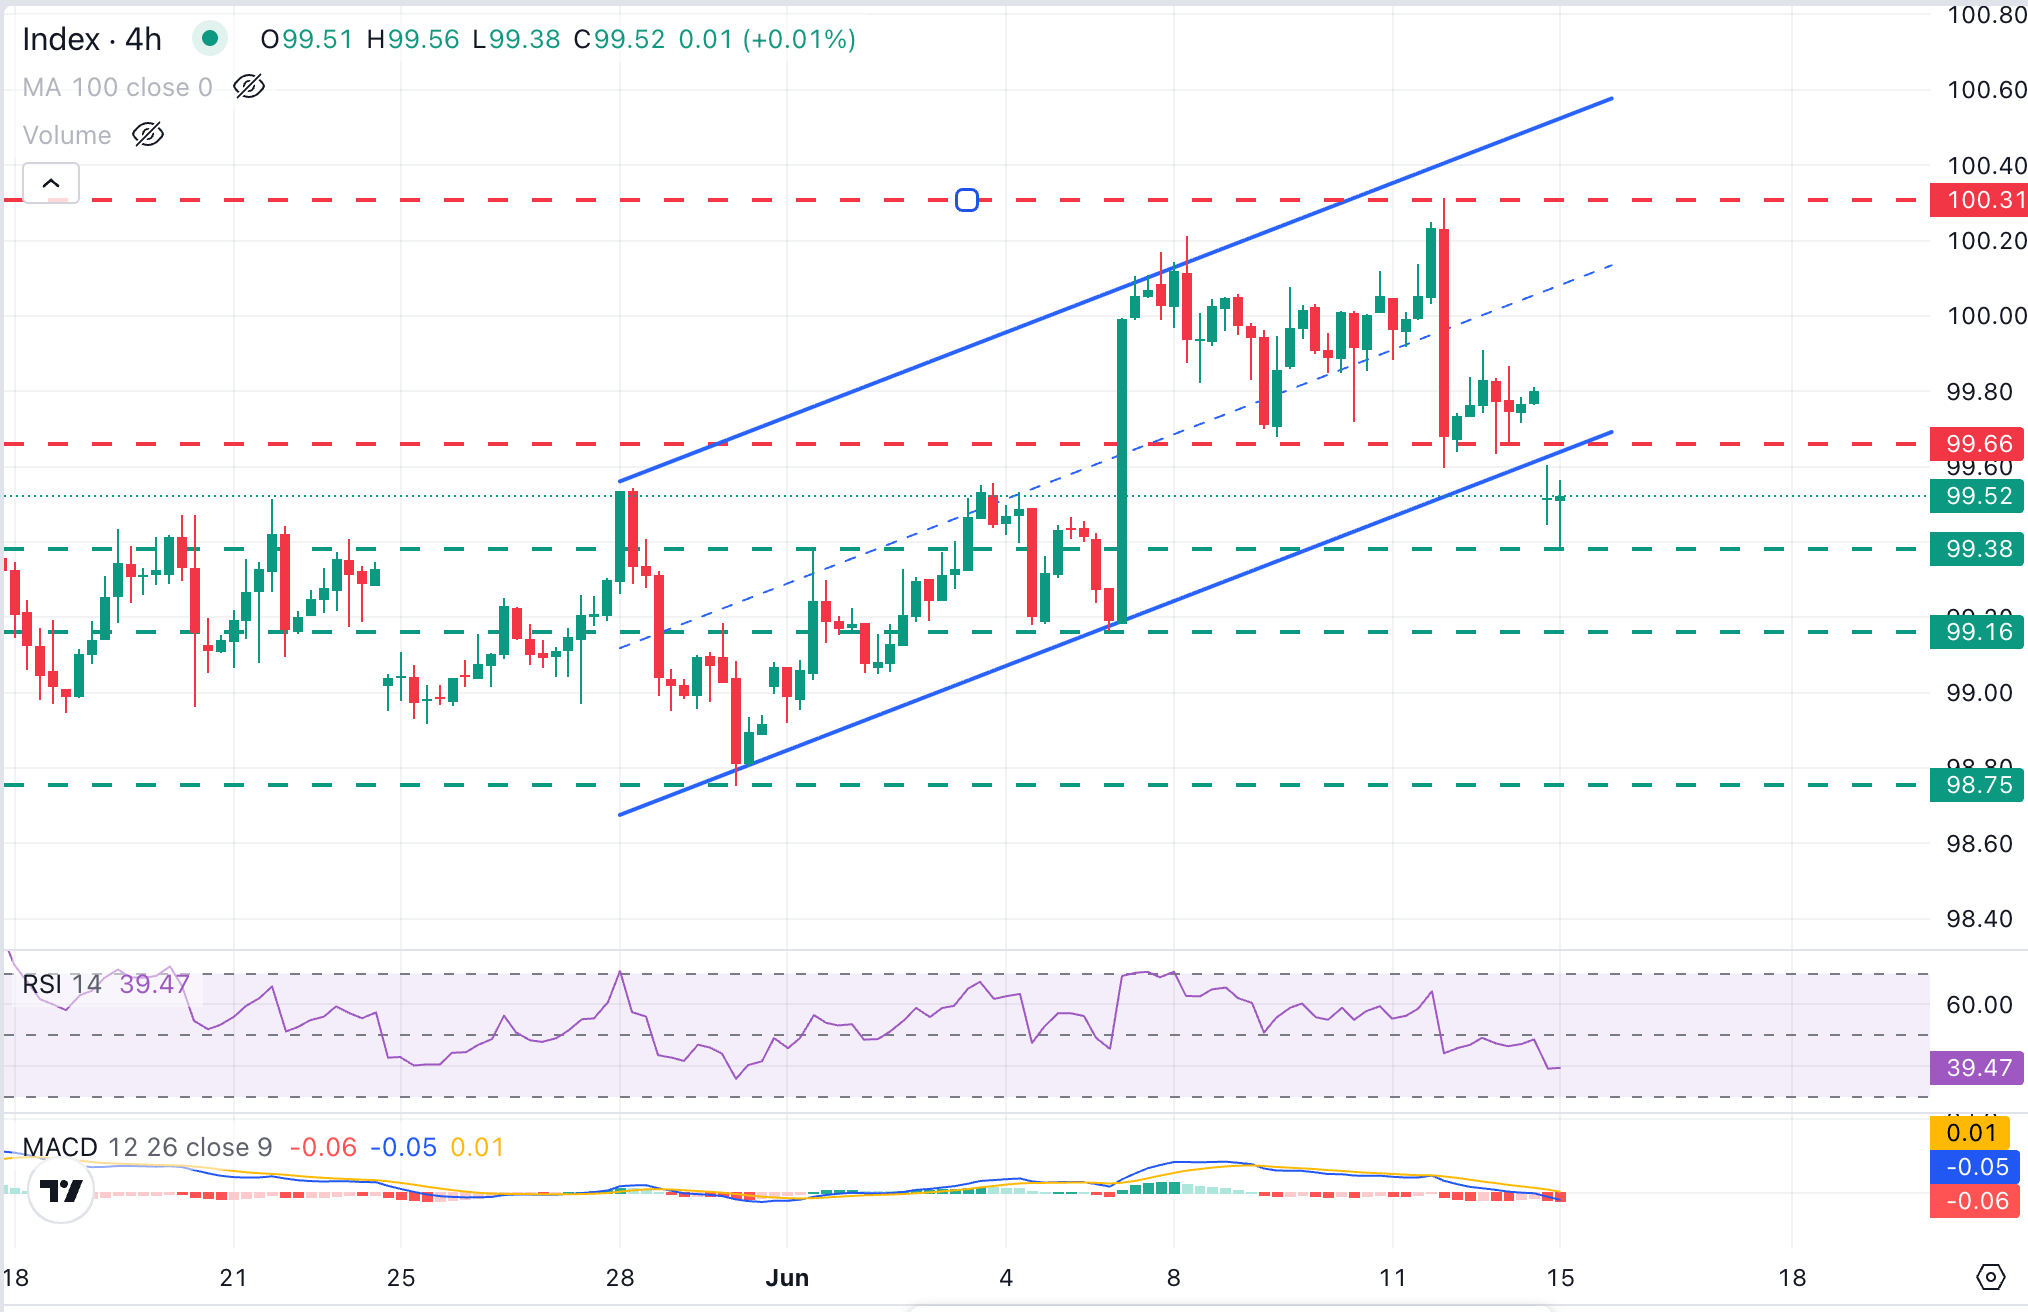
The Dollar Index trades around 99.50 at the time of writing, keeping a bearish near-term tone after breaking the lower boundary of its upward-sloping channel. Momentum indicators endorse the negative view with the 4-hour Relative Strength Index (RSI) drifting below 40 and the Moving Average Convergence Divergence (MACD) in negative territory, together suggesting a weakening bullish momentum.
Bears remain contained above session lows at 99.38 so far, which closes the path towards the June 4 and 5 lows near 99.15 and the late-May lows at 98.75.
On the topside, the confluence of the broken channel bottom with a previous support area, around 99.65 (June 9, 11, and 12 lows), is likely to pose a significant challenge to upside attempts. A successful move above this area exposes the 100.00 psychological level and the June 11 high, near 100.30.
(The technical analysis of this story was written with the help of an AI tool.)
US Dollar Price Today
The table below shows the percentage change of US Dollar (USD) against listed major currencies today. US Dollar was the strongest against the Japanese Yen.
| USD | EUR | GBP | JPY | CAD | AUD | NZD | CHF | |
|---|---|---|---|---|---|---|---|---|
| USD | -0.32% | -0.25% | -0.06% | -0.12% | -0.39% | -0.27% | -0.38% | |
| EUR | 0.32% | 0.07% | 0.28% | 0.24% | -0.08% | 0.06% | -0.07% | |
| GBP | 0.25% | -0.07% | 0.22% | 0.15% | -0.16% | 0.01% | -0.14% | |
| JPY | 0.06% | -0.28% | -0.22% | -0.04% | -0.34% | -0.23% | -0.34% | |
| CAD | 0.12% | -0.24% | -0.15% | 0.04% | -0.28% | -0.18% | -0.30% | |
| AUD | 0.39% | 0.08% | 0.16% | 0.34% | 0.28% | 0.15% | 0.04% | |
| NZD | 0.27% | -0.06% | -0.01% | 0.23% | 0.18% | -0.15% | -0.14% | |
| CHF | 0.38% | 0.07% | 0.14% | 0.34% | 0.30% | -0.04% | 0.14% |
The heat map shows percentage changes of major currencies against each other. The base currency is picked from the left column, while the quote currency is picked from the top row. For example, if you pick the US Dollar from the left column and move along the horizontal line to the Japanese Yen, the percentage change displayed in the box will represent USD (base)/JPY (quote).

يعتمد أكثر من مليون مستخدم على FXStreet للحصول على بيانات سوقية لحظية، وأدوات رسوم بيانية، ورؤى خبراء، وأخبار الفوركس. يساعد تقويمهم الاقتصادي الشامل والندوات التعليمية عبر الويب المتداولين على البقاء على اطلاع واتخاذ قرارات محسوبة. لدى FXStreet فريق يضم حوالي 60 محترفًا موزعين بين مقر برشلونة ومناطق عالمية مختلفة.
اقرأ المزيد


