
US Dollar Index holds firm as US naval blockade undermines Iran ceasefire extension
بواسطة Vishal Chaturvedi
تم التحديث: 22 Apr 2026


المقالات الشائعة

The US Dollar Index (DXY), which tracks the Greenback’s value against a basket of six major currencies, edges higher on Wednesday, hovering near one-week highs as the extension of the US-Iran ceasefire is seen as a temporary pause in military escalation rather than a real breakthrough, suggesting th
- US Dollar Index holds firm near weekly highs as ceasefire extension fails to ease tensions.
- Elevated Oil prices and fading Fed interest rate cut bets underpin the Greenback.
- Technically, DXY remains capped below a cluster of SMAs, keeping near-term bias bearish.
The US Dollar Index (DXY), which tracks the Greenback’s value against a basket of six major currencies, edges higher on Wednesday, hovering near one-week highs as the extension of the US-Iran ceasefire is seen as a temporary pause in military escalation rather than a real breakthrough, suggesting the war may not end anytime soon.
At the time of writing, the DXY is little changed around 98.40 after bouncing from an intraday low of 98.21.
US President Donald Trump extended the ceasefire with Iran just hours before its expiry, while Iran has yet to formally accept the extension due to the ongoing US naval blockade, which Tehran views as a key obstacle to negotiations. Iranian Foreign Ministry spokesperson Esmail Baghaei described the move as an “aggressive measure.”
Market sentiment improved somewhat following the extension of the ceasefire announcement, supporting risk-sensitive assets. However, tensions around the Strait of Hormuz — a key global oil supply route — keep the US Dollar supported after a corrective slide earlier this month, when optimism around de-escalation followed the announcement of the initial two-week ceasefire.
Oil prices remain elevated, reinforcing inflation concerns and reducing expectations for near-term Federal Reserve (Fed) rate cuts. Recent US economic data reflect the impact of higher energy costs, with markets increasingly expecting the Fed to keep interest rates on hold through 2026, further limiting downside in the Greenback.
A Reuters poll published on Wednesday showed 56 of 103 economists expect the Fed’s benchmark rate to remain in the 3.50%-3.75% range by the end of September, compared with nearly 70% who had expected at least one rate cut in late March. While there is no clear consensus for year-end, 71 economists still expect at least one rate cut, in line with Fed projections.
Looking ahead, the US economic calendar is light on Wednesday, keeping traders focused on geopolitical developments. On Thursday, attention will shift to weekly Jobless Claims and preliminary S&P Global Purchasing Managers Index (PMI) data.
Technical Analysis:
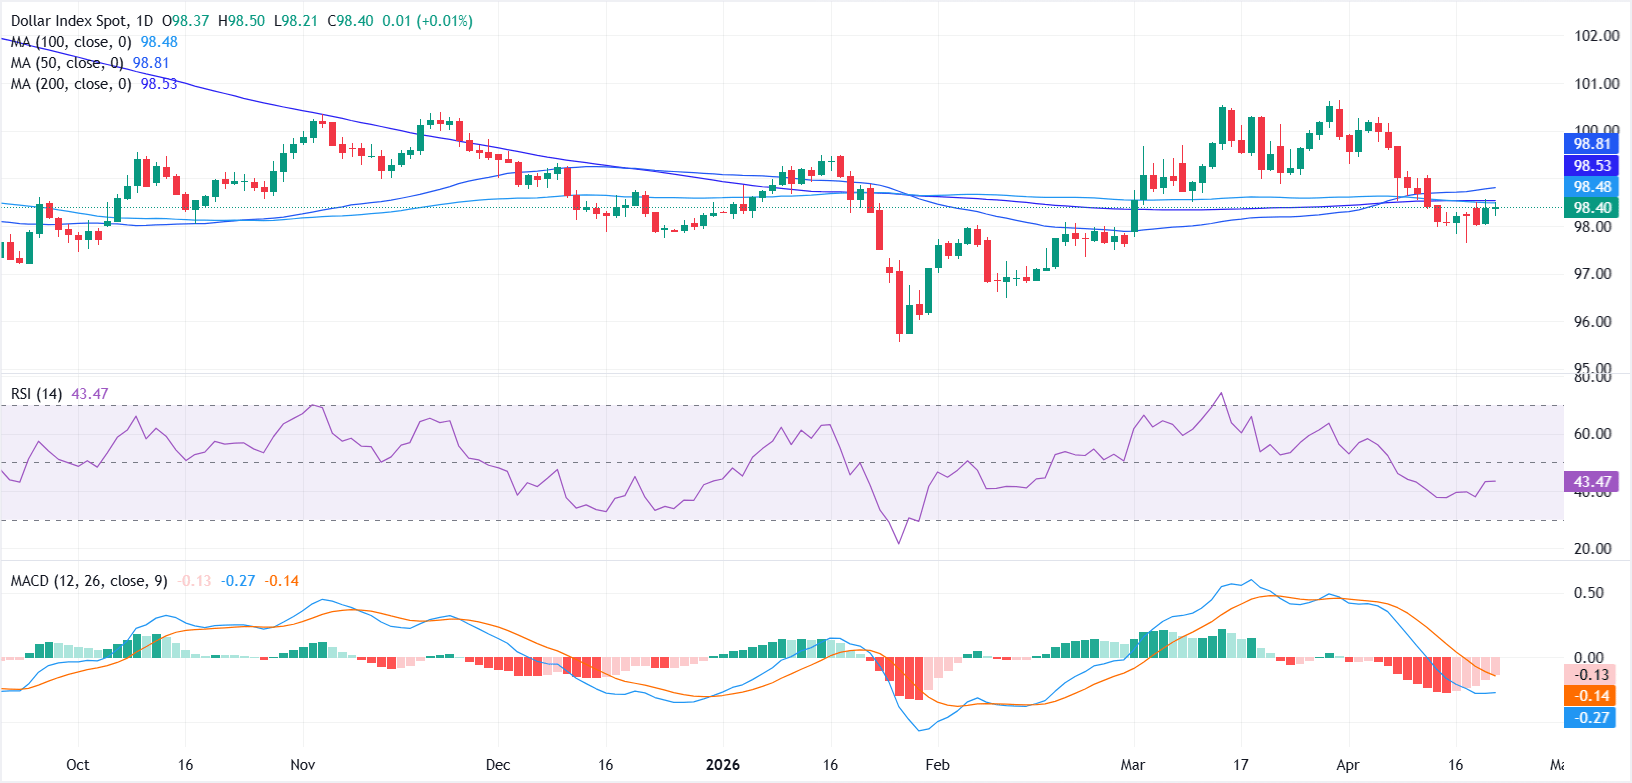
In the daily chart, Dollar Index maintains a bearish near-term bias as it holds beneath a tight band of key moving averages. The 100-day simple moving average (SMA) at 98.48, the 200-day SMA at 98.53 and the 50-day SMA at 98.81 all sit overhead, suggesting the broader trend remains capped unless buyers can reclaim this cluster.
On the downside, immediate support is seen at the 98.00 level, followed by last week’s low at 97.63. A break below these levels could open the door for further downside toward the 97.00 handle.
The Relative Strength Index (RSI) around 44 stays below the midline, hinting at lingering downside pressure, while the Moving Average Convergence Divergence (MACD) remains in negative territory but is slowly recovering, which suggests that bearish momentum is easing rather than accelerating.
(The technical analysis of this story was written with the help of an AI tool.)
US Dollar Price Today
The table below shows the percentage change of US Dollar (USD) against listed major currencies today. US Dollar was the strongest against the Swiss Franc.
| USD | EUR | GBP | JPY | CAD | AUD | NZD | CHF | |
|---|---|---|---|---|---|---|---|---|
| USD | 0.07% | -0.06% | -0.14% | -0.05% | -0.12% | -0.31% | 0.16% | |
| EUR | -0.07% | -0.12% | -0.21% | -0.10% | -0.19% | -0.39% | 0.09% | |
| GBP | 0.06% | 0.12% | -0.06% | 0.04% | -0.05% | -0.24% | 0.21% | |
| JPY | 0.14% | 0.21% | 0.06% | 0.09% | 0.03% | -0.18% | 0.26% | |
| CAD | 0.05% | 0.10% | -0.04% | -0.09% | -0.06% | -0.25% | 0.20% | |
| AUD | 0.12% | 0.19% | 0.05% | -0.03% | 0.06% | -0.21% | 0.24% | |
| NZD | 0.31% | 0.39% | 0.24% | 0.18% | 0.25% | 0.21% | 0.45% | |
| CHF | -0.16% | -0.09% | -0.21% | -0.26% | -0.20% | -0.24% | -0.45% |
The heat map shows percentage changes of major currencies against each other. The base currency is picked from the left column, while the quote currency is picked from the top row. For example, if you pick the US Dollar from the left column and move along the horizontal line to the Japanese Yen, the percentage change displayed in the box will represent USD (base)/JPY (quote).

يعتمد أكثر من مليون مستخدم على FXStreet للحصول على بيانات سوقية لحظية، وأدوات رسوم بيانية، ورؤى خبراء، وأخبار الفوركس. يساعد تقويمهم الاقتصادي الشامل والندوات التعليمية عبر الويب المتداولين على البقاء على اطلاع واتخاذ قرارات محسوبة. لدى FXStreet فريق يضم حوالي 60 محترفًا موزعين بين مقر برشلونة ومناطق عالمية مختلفة.
اقرأ المزيد


