
US Dollar Index Price Forecast: Turns upside down as 99.50 remains key barrier
بواسطة Sagar Dua
تم التحديث: 21 May 2026


المقالات الشائعة

The US Dollar (USD) gives back a majority of its early gains as the United States (US) Treasury Yields correct sharply due to growing optimism that the United States (US) and Iran will reach a deal soon.
- The US Dollar Index falls back to near 99.10 due to growing US-Iran deal optimism.
- US President Trump said that Washington is in the “final stages” over reaching a deal with Iran.
- US Treasury yields give back early gains as oil prices hold Wednesday’s corrective move.
The US Dollar (USD) gives back a majority of its early gains as the United States (US) Treasury Yields correct sharply due to growing optimism that the United States (US) and Iran will reach a deal soon.
At the press time, the US Dollar Index (DXY), which tracks the Greenback’s value against six major currencies, turns upside down to near 99.10 after failing to extend the recovery move above 99.35. 10-year US Treasury Yields surrender their entire early recovery move and flatten around 4.58%.
US Treasury yields corrected sharply on Wednesday after oil prices responded negatively to growing optimism towards the US-Iran prolonged peace deal.
US-Iran peace hopes fuelled after President Donald Trump said that Washington is in the “final stages” of finalizing a deal with Iran.
US bond yields rallied in the past two weeks as traders became confident that the Federal Reserve (Fed) will not cut interest rates this year due to elevated oil prices.
On the economic front, investors await the preliminary US S&P Global Purchasing Managers’ Index (PMI) data for May, which will be published at 13:45 GMT.
US Dollar Index technical analysis
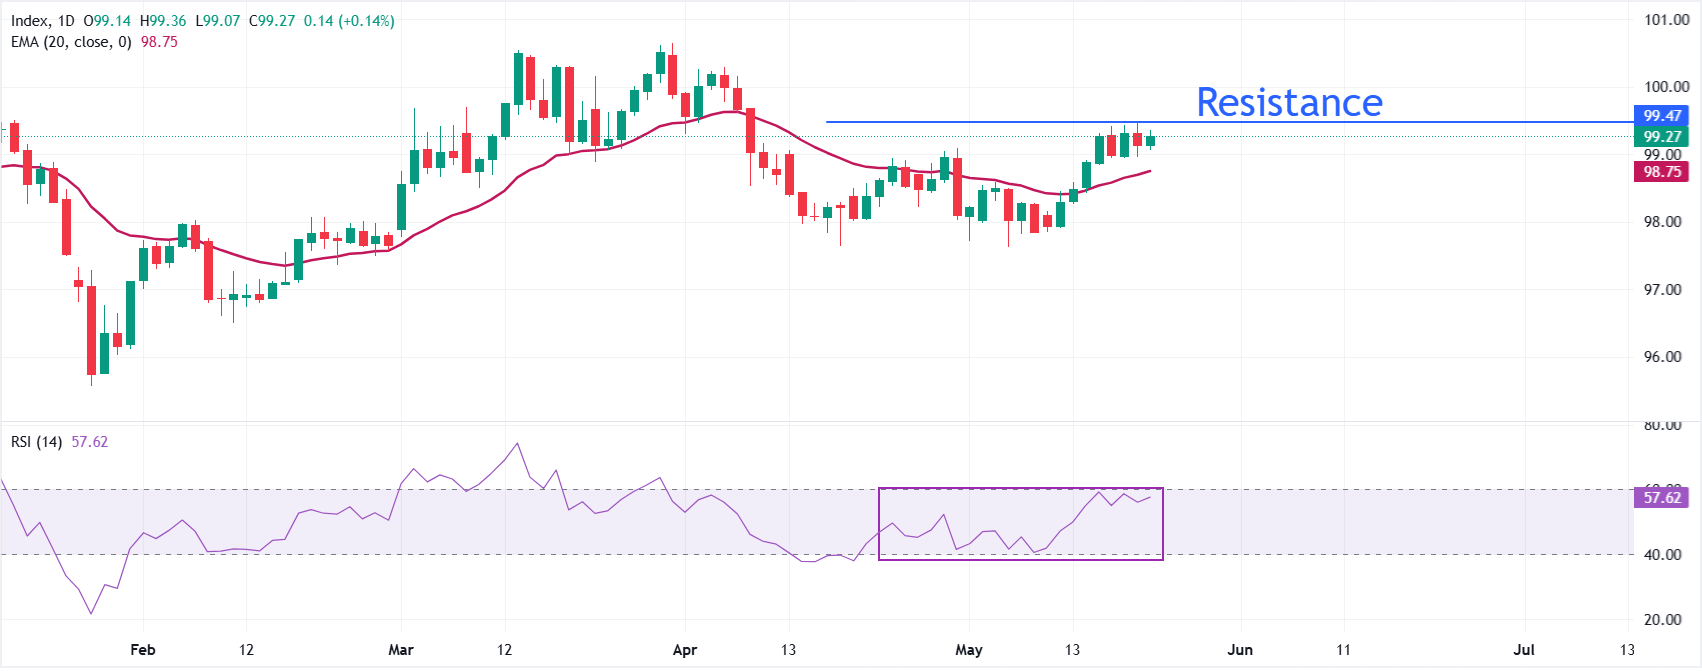
The Dollar Index Spot trades lower at around 99.10. However, the near-term tone is constructive, with price holding above the 20-day exponential moving average (EMA) at 98.75.
The Relative Strength Index (RSI) at 57.62 is in bullish territory but shy of overbought, hinting that upside momentum is positive yet not stretched.
On the downside, immediate support aligns with the 20-day EMA at 98.75, where a break would hint at a deeper corrective phase toward 98.00. As long as the index defends this moving average on closing bases, the broader bias stays tilted to the upside, with scope for buyers to probe higher levels even if nearby resistance is not yet well-defined by the available indicators.
Looking up, the spot could attempt to test 100.00 if it manages to break decisively above the May 20 high of 99.47.
(The technical analysis of this story was written with the help of an AI tool.)
US Dollar FAQs
The US Dollar (USD) is the official currency of the United States of America, and the ‘de facto’ currency of a significant number of other countries where it is found in circulation alongside local notes. It is the most heavily traded currency in the world, accounting for over 88% of all global foreign exchange turnover, or an average of $6.6 trillion in transactions per day, according to data from 2022. Following the second world war, the USD took over from the British Pound as the world’s reserve currency. For most of its history, the US Dollar was backed by Gold, until the Bretton Woods Agreement in 1971 when the Gold Standard went away.
The most important single factor impacting on the value of the US Dollar is monetary policy, which is shaped by the Federal Reserve (Fed). The Fed has two mandates: to achieve price stability (control inflation) and foster full employment. Its primary tool to achieve these two goals is by adjusting interest rates. When prices are rising too quickly and inflation is above the Fed’s 2% target, the Fed will raise rates, which helps the USD value. When inflation falls below 2% or the Unemployment Rate is too high, the Fed may lower interest rates, which weighs on the Greenback.
In extreme situations, the Federal Reserve can also print more Dollars and enact quantitative easing (QE). QE is the process by which the Fed substantially increases the flow of credit in a stuck financial system. It is a non-standard policy measure used when credit has dried up because banks will not lend to each other (out of the fear of counterparty default). It is a last resort when simply lowering interest rates is unlikely to achieve the necessary result. It was the Fed’s weapon of choice to combat the credit crunch that occurred during the Great Financial Crisis in 2008. It involves the Fed printing more Dollars and using them to buy US government bonds predominantly from financial institutions. QE usually leads to a weaker US Dollar.
Quantitative tightening (QT) is the reverse process whereby the Federal Reserve stops buying bonds from financial institutions and does not reinvest the principal from the bonds it holds maturing in new purchases. It is usually positive for the US Dollar.

يعتمد أكثر من مليون مستخدم على FXStreet للحصول على بيانات سوقية لحظية، وأدوات رسوم بيانية، ورؤى خبراء، وأخبار الفوركس. يساعد تقويمهم الاقتصادي الشامل والندوات التعليمية عبر الويب المتداولين على البقاء على اطلاع واتخاذ قرارات محسوبة. لدى FXStreet فريق يضم حوالي 60 محترفًا موزعين بين مقر برشلونة ومناطق عالمية مختلفة.
اقرأ المزيد


