
USD/CHF Price Forecast: Consolidates within a bearish triangle, threatens breakdown
بواسطة Christian Borjon Valencia
تاريخ النشر: 26 Feb 2026 | تاريخ التعديل: 26 Feb 2026


المقالات الشائعة

USD/CHF extends its losses for the fourth consecutive trading day, down 0.14%, yet it remains confined to the 0.7718-0.7757 range for the last three days. At the time of writing, exchanges hands at 0.7729, above the 20-day Simple Moving Average (SMA) at 0.7726.
- USD/CHF consolidates within a symmetrical triangle, signaling potential continuation of the broader downtrend.
- Bearish RSI momentum suggests sellers could test key support near 0.7650.
- Break below 0.7600 exposes yearly low at 0.7603, while 0.7770 caps rebounds.
USD/CHF extends its losses for the fourth consecutive trading day, down 0.14%, yet it remains confined to the 0.7718-0.7757 range for the last three days. At the time of writing, exchanges hands at 0.7729, above the 20-day Simple Moving Average (SMA) at 0.7726.
USD/CHF Price Forecast: Technical outlook
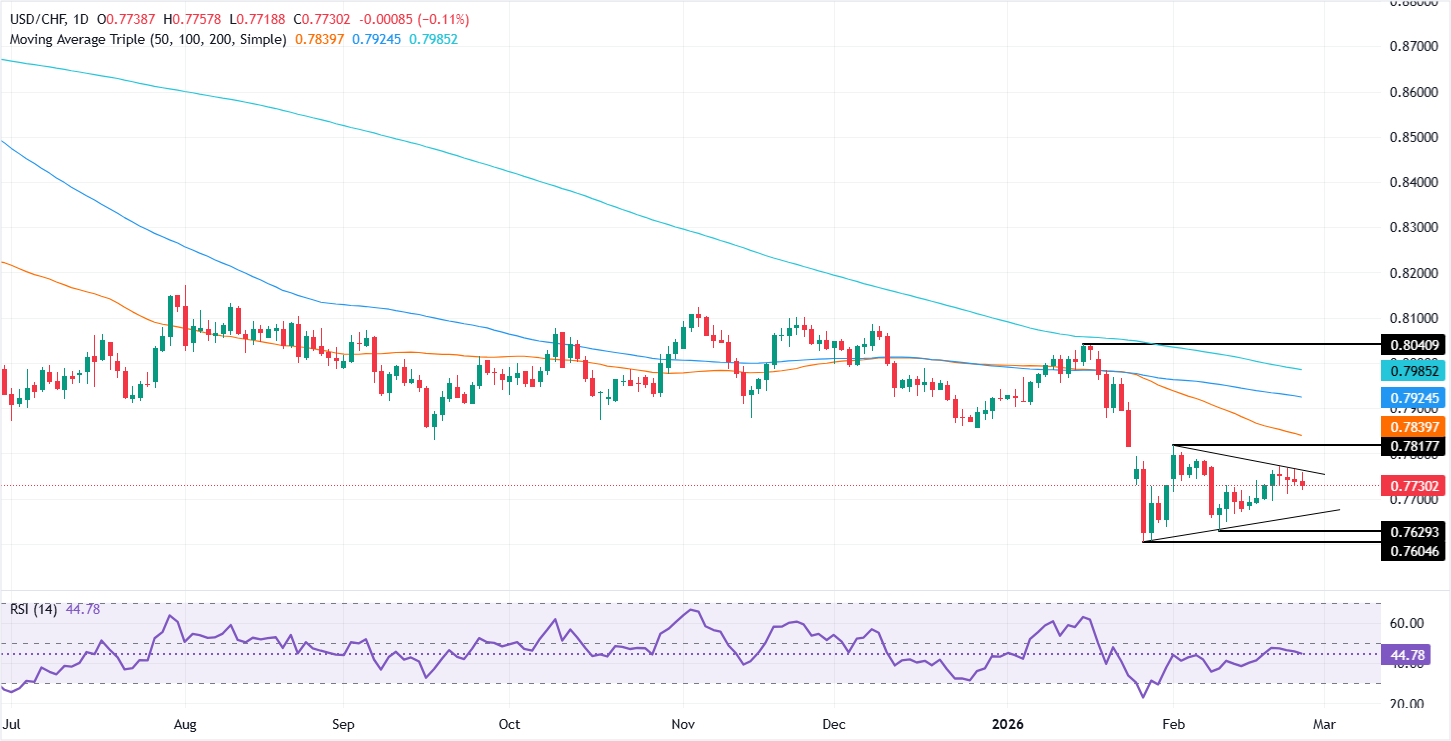
The technical picture shows USD/CHF consolidating inside a symmetrical triangle on a downtrend, which implies that the downtrend could resume once sellers push the exchange rate below the key support trendline of the triangle at around 0.7650-0.7665.
The Relative Strength Index (RSI) is bearish and aiming downwards, an indication that further losses lie ahead.
If sellers clear the support trendline, this will clear the way to challenge yearly lows of 0.7603, reached on January 27. Once surpassed, the next stop would be 0.7600, ahead of August’s 2011 low of 0.7069.
For a bullish reversal, buyers need to clear the triangle’s resistance trendline at around 0.7772, ahead of 0.7800. Further gains lie overhead at the 50-day SMA at 0.7841, before testing the 100-day SMA at 0.7911.
USD/CHF Price Chart – Daily
Swiss Franc Price This week
The table below shows the percentage change of Swiss Franc (CHF) against listed major currencies this week. Swiss Franc was the strongest against the Japanese Yen.
| USD | EUR | GBP | JPY | CAD | AUD | NZD | CHF | |
|---|---|---|---|---|---|---|---|---|
| USD | -0.05% | -0.45% | 1.02% | 0.04% | -0.53% | -0.28% | -0.21% | |
| EUR | 0.05% | -0.38% | 1.07% | 0.12% | -0.49% | -0.22% | -0.14% | |
| GBP | 0.45% | 0.38% | 1.63% | 0.51% | -0.13% | 0.17% | 0.26% | |
| JPY | -1.02% | -1.07% | -1.63% | -0.95% | -1.51% | -1.19% | -1.21% | |
| CAD | -0.04% | -0.12% | -0.51% | 0.95% | -0.58% | -0.26% | -0.24% | |
| AUD | 0.53% | 0.49% | 0.13% | 1.51% | 0.58% | 0.27% | 0.36% | |
| NZD | 0.28% | 0.22% | -0.17% | 1.19% | 0.26% | -0.27% | 0.08% | |
| CHF | 0.21% | 0.14% | -0.26% | 1.21% | 0.24% | -0.36% | -0.08% |
The heat map shows percentage changes of major currencies against each other. The base currency is picked from the left column, while the quote currency is picked from the top row. For example, if you pick the Swiss Franc from the left column and move along the horizontal line to the US Dollar, the percentage change displayed in the box will represent CHF (base)/USD (quote).
(This story was corrected on February 25 at 20:41 to say that USD/CHF extends its losses for the fourth consecutive session, not the second.)

يعتمد أكثر من مليون مستخدم على FXStreet للحصول على بيانات سوقية لحظية، وأدوات رسوم بيانية، ورؤى خبراء، وأخبار الفوركس. يساعد تقويمهم الاقتصادي الشامل والندوات التعليمية عبر الويب المتداولين على البقاء على اطلاع واتخاذ قرارات محسوبة. لدى FXStreet فريق يضم حوالي 60 محترفًا موزعين بين مقر برشلونة ومناطق عالمية مختلفة.
اقرأ المزيد


