
USD/CHF Price Forecast: Hold key support, bulls eye YTD high
بواسطة Christian Borjon Valencia
تم التحديث: 30 Jun 2026


المقالات الشائعة

The USD/CHF holds firm around 0.8070 on Tuesday, after losing 0.29% on Monday, supported by broad US Dollar weakness amid month-end flows and an improvement in risk appetite.
- USD/CHF retraces from YTD high, but bullish structure remains intact.
- RSI holds above 50, signaling bulls remain firmly in control.
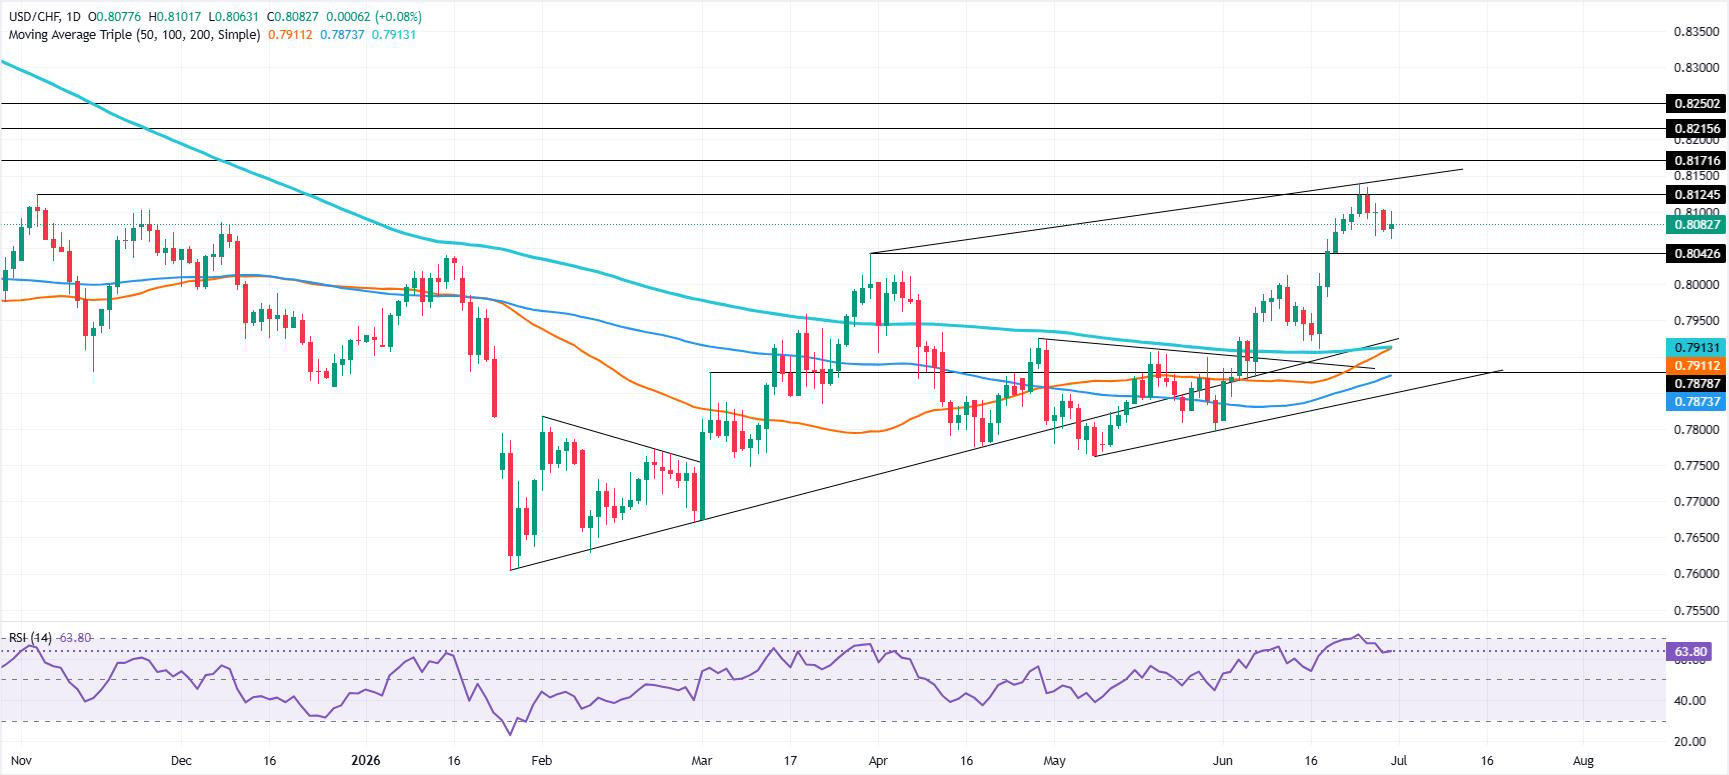
- Break above 0.8100 exposes 0.8139 and 0.8171 resistance.
The USD/CHF holds firm around 0.8070 on Tuesday, after losing 0.29% on Monday, supported by broad US Dollar weakness amid month-end flows and an improvement in risk appetite.
USD/CHF Price Forecast: Technical outlook
The uptrend paused as the USD/CHF retraced from a year-to-date (YTD) high of 0.8139, opening the door for a 70-pip drop. However, buyers had stepped in, signaling that bullish momentum hasn’t faded.
The Relative Strength Index (RSI) is above its 50-neutral level and closing in on overbought territory. This means that bulls are in charge.
For a bullish continuation, the USD/CHF must climb above 0.8100 and clear the YTD high. Above this area sits August 1, 2025, with a daily high of 0.8171, followed by the June 19, 2025, high of 0.8215. Once surpassed, the next stop would be the June 4 high at 0.8250.
Downwards, the first support would be the March 31 high turned support at 0.8042, followed by the June 11 high, at 0.8013. Below, the next area of interest would be 0.8000.
USD/CHF Price Chart – Daily
Swiss Franc Price Today
The table below shows the percentage change of Swiss Franc (CHF) against listed major currencies today. Swiss Franc was the strongest against the Japanese Yen.
| USD | EUR | GBP | JPY | CAD | AUD | NZD | CHF | |
|---|---|---|---|---|---|---|---|---|
| USD | 0.02% | 0.02% | 0.41% | -0.04% | -0.48% | -0.53% | 0.09% | |
| EUR | -0.02% | 0.01% | 0.37% | -0.11% | -0.50% | -0.56% | 0.06% | |
| GBP | -0.02% | -0.01% | 0.37% | -0.08% | -0.50% | -0.56% | 0.05% | |
| JPY | -0.41% | -0.37% | -0.37% | -0.44% | -0.88% | -0.90% | -0.31% | |
| CAD | 0.04% | 0.11% | 0.08% | 0.44% | -0.45% | -0.46% | 0.13% | |
| AUD | 0.48% | 0.50% | 0.50% | 0.88% | 0.45% | -0.02% | 0.58% | |
| NZD | 0.53% | 0.56% | 0.56% | 0.90% | 0.46% | 0.02% | 0.59% | |
| CHF | -0.09% | -0.06% | -0.05% | 0.31% | -0.13% | -0.58% | -0.59% |
The heat map shows percentage changes of major currencies against each other. The base currency is picked from the left column, while the quote currency is picked from the top row. For example, if you pick the Swiss Franc from the left column and move along the horizontal line to the US Dollar, the percentage change displayed in the box will represent CHF (base)/USD (quote).

يعتمد أكثر من مليون مستخدم على FXStreet للحصول على بيانات سوقية لحظية، وأدوات رسوم بيانية، ورؤى خبراء، وأخبار الفوركس. يساعد تقويمهم الاقتصادي الشامل والندوات التعليمية عبر الويب المتداولين على البقاء على اطلاع واتخاذ قرارات محسوبة. لدى FXStreet فريق يضم حوالي 60 محترفًا موزعين بين مقر برشلونة ومناطق عالمية مختلفة.
اقرأ المزيد


