
USD/CHF Price Forecast: Remains below 0.7850 near moving averages
بواسطة Akhtar Faruqui
تم التحديث: 27 Apr 2026


المقالات الشائعة

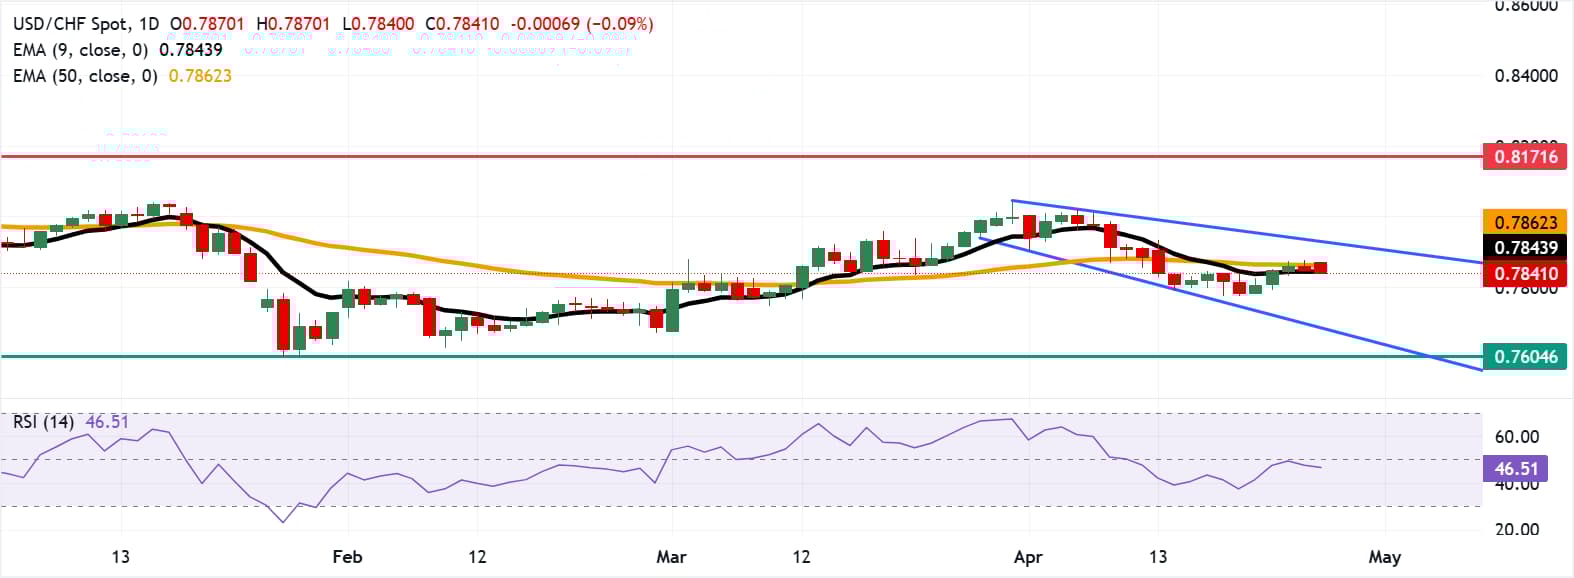
USD/CHF remains subdued for the second successive day, trading around 0.7840 during European hours on Monday. The technical analysis of the daily chart indicates the pair is positioned within the descending channel pattern, signaling an ongoing bearish bias.
- USD/CHF may test the descending channel’s lower boundary near 0.7690.
- The 14-day Relative Strength Index near 47 signals weak momentum, not a clear oversold condition.
- The initial resistance lies at the nine-day EMA of 0.7843.
USD/CHF remains subdued for the second successive day, trading around 0.7840 during European hours on Monday. The technical analysis of the daily chart indicates the pair is positioned within the descending channel pattern, signaling an ongoing bearish bias.
The USD/CHF pair keeps a bearish near-term bias as the spot price holds beneath both the nine-day and 50-day Exponential Moving Averages, respectively. The short-term EMA flattening just above the price and the longer EMA capping the pair hint at persistent overhead supply, while the 14-day Relative Strength Index (RSI) around 47 reflects subdued momentum rather than a decisive oversold condition.
The USD/CHF pair may navigate the region around the lower boundary of the descending channel around 0.7690. A successful break below the channel would reinforce the bearish bias and put downward pressure on the pair to test 0.7604, the lowest since August 2011, recorded in January.
On the upside, the immediate barrier lies at the nine-day EMA of 0.7843, followed by the 50-day EMA at 0.7862. A break above these EMAs would improve price momentum and support the USD/CHF pair to test the upper boundary of the descending channel around 0.7949. A sustained break above the channel would cause the emergence of the bullish bias and lead the pair to explore the region around the 10-month high of 0.8171, reached in August 2025.
(The technical analysis of this story was written with the help of an AI tool.)
Swiss Franc Price Today
The table below shows the percentage change of Swiss Franc (CHF) against listed major currencies today. Swiss Franc was the strongest against the US Dollar.
| USD | EUR | GBP | JPY | CAD | AUD | NZD | CHF | |
|---|---|---|---|---|---|---|---|---|
| USD | -0.24% | -0.18% | -0.14% | -0.42% | -0.54% | -0.54% | -0.18% | |
| EUR | 0.24% | 0.07% | 0.11% | -0.18% | -0.26% | -0.29% | 0.07% | |
| GBP | 0.18% | -0.07% | 0.02% | -0.26% | -0.36% | -0.38% | -0.01% | |
| JPY | 0.14% | -0.11% | -0.02% | -0.26% | -0.39% | -0.42% | 0.00% | |
| CAD | 0.42% | 0.18% | 0.26% | 0.26% | -0.12% | -0.15% | 0.24% | |
| AUD | 0.54% | 0.26% | 0.36% | 0.39% | 0.12% | -0.01% | 0.36% | |
| NZD | 0.54% | 0.29% | 0.38% | 0.42% | 0.15% | 0.01% | 0.37% | |
| CHF | 0.18% | -0.07% | 0.00% | -0.00% | -0.24% | -0.36% | -0.37% |
The heat map shows percentage changes of major currencies against each other. The base currency is picked from the left column, while the quote currency is picked from the top row. For example, if you pick the Swiss Franc from the left column and move along the horizontal line to the US Dollar, the percentage change displayed in the box will represent CHF (base)/USD (quote).

يعتمد أكثر من مليون مستخدم على FXStreet للحصول على بيانات سوقية لحظية، وأدوات رسوم بيانية، ورؤى خبراء، وأخبار الفوركس. يساعد تقويمهم الاقتصادي الشامل والندوات التعليمية عبر الويب المتداولين على البقاء على اطلاع واتخاذ قرارات محسوبة. لدى FXStreet فريق يضم حوالي 60 محترفًا موزعين بين مقر برشلونة ومناطق عالمية مختلفة.
اقرأ المزيد


