
USD/CHF Price Forecast: Retreats below 0.8100 as ‘tweezer top’ forms
بواسطة Christian Borjon Valencia
تم التحديث: 25 Jun 2026


المقالات الشائعة

The USD/CHF stumbles on Thursday, losing some 0.34% during the North American session, as the Greenback’s six-day rally stalls amid falling US Treasury yields, despite a red-hot US Core PCE inflation reading.
- Tweezers-top pattern signals pullback risk after six-day USD/CHF rally.
- RSI remains overbought, hinting sellers may be stepping in.
- Break below 0.8050 exposes 0.8000 and 200-day SMA support.
The USD/CHF stumbles on Thursday, losing some 0.34% during the North American session, as the Greenback’s six-day rally stalls amid falling US Treasury yields, despite a red-hot US Core PCE inflation reading. At the time of writing, the pair trades below the 0.8100 figure after reaching a YTD high of 0.8139.
USD/CHF Price Forecast: Technical outlook
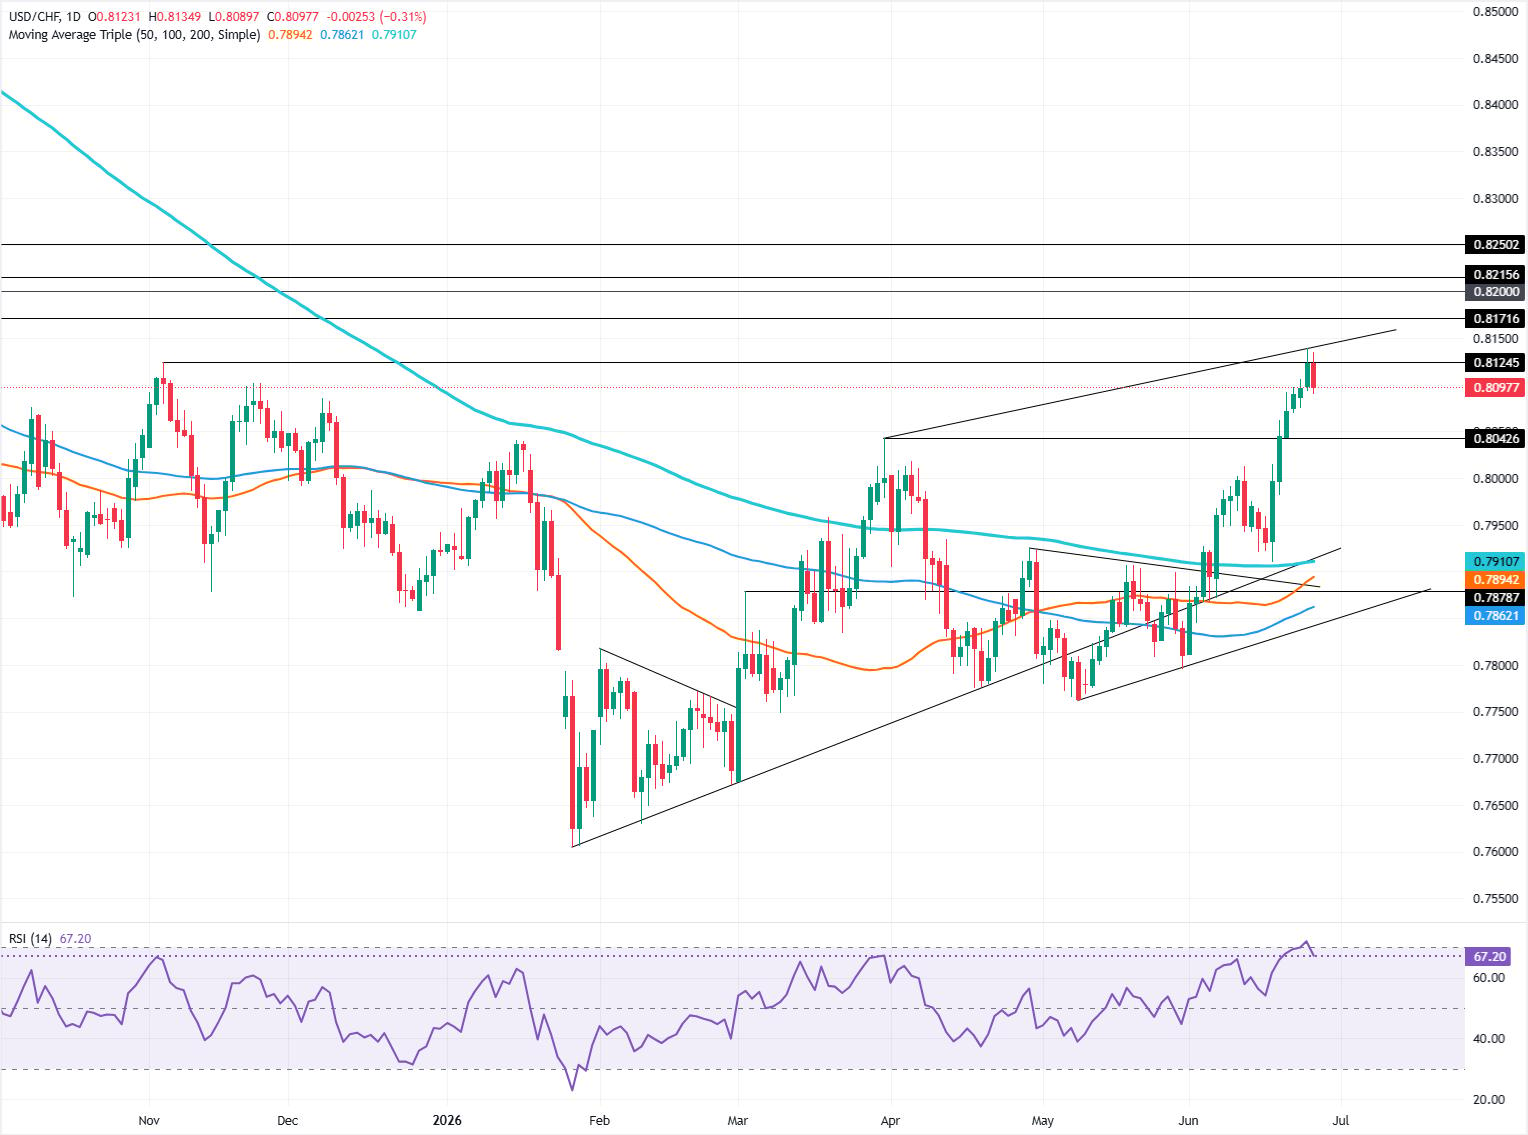
After rallying for six straight days, the USD/CHF is forming a ‘tweezers-top’, a bearish chart pattern, which could open the door for a retracement, with the 0.8000 figure being the first zone of interest.
Momentum remains bullish, though with the Relative Strength Index (RSI) edging above the 70 oversold level, a dip suggests sellers are stepping in.
Hence, the USD/CHF might be headed for a short-term pullback. The first support is 0.8050, followed by 0.8000. A breach of the latter will expose the confluence of the June 17 daily low and the 200-day SMA at 0.7910.
On the upside, the first resistance for USD/CHF is 0.8100. If bulls reclaim that area, look for a test of the year-to-date high at 0.8139 ahead of challenging the 0.8200 mark.
USD/CHF Price Chart – Daily
Swiss Franc Price Today
The table below shows the percentage change of Swiss Franc (CHF) against listed major currencies today. Swiss Franc was the strongest against the New Zealand Dollar.
| USD | EUR | GBP | JPY | CAD | AUD | NZD | CHF | |
|---|---|---|---|---|---|---|---|---|
| USD | -0.11% | -0.23% | -0.02% | -0.25% | -0.20% | 0.00% | -0.32% | |
| EUR | 0.11% | -0.09% | 0.13% | -0.11% | -0.06% | 0.16% | -0.17% | |
| GBP | 0.23% | 0.09% | 0.21% | -0.00% | 0.03% | 0.26% | -0.08% | |
| JPY | 0.02% | -0.13% | -0.21% | -0.24% | -0.19% | -0.00% | -0.31% | |
| CAD | 0.25% | 0.11% | 0.00% | 0.24% | 0.04% | 0.27% | -0.08% | |
| AUD | 0.20% | 0.06% | -0.03% | 0.19% | -0.04% | 0.20% | -0.09% | |
| NZD | -0.01% | -0.16% | -0.26% | 0.00% | -0.27% | -0.20% | -0.34% | |
| CHF | 0.32% | 0.17% | 0.08% | 0.31% | 0.08% | 0.09% | 0.34% |
The heat map shows percentage changes of major currencies against each other. The base currency is picked from the left column, while the quote currency is picked from the top row. For example, if you pick the Swiss Franc from the left column and move along the horizontal line to the US Dollar, the percentage change displayed in the box will represent CHF (base)/USD (quote).

يعتمد أكثر من مليون مستخدم على FXStreet للحصول على بيانات سوقية لحظية، وأدوات رسوم بيانية، ورؤى خبراء، وأخبار الفوركس. يساعد تقويمهم الاقتصادي الشامل والندوات التعليمية عبر الويب المتداولين على البقاء على اطلاع واتخاذ قرارات محسوبة. لدى FXStreet فريق يضم حوالي 60 محترفًا موزعين بين مقر برشلونة ومناطق عالمية مختلفة.
اقرأ المزيد


