
USD/CHF Price Forecast: Slips toward 0.7850 ahead of Fed decision
بواسطة Christian Borjon Valencia
تاريخ النشر: 17 Mar 2026 | تاريخ التعديل: 17 Mar 2026


المقالات الشائعة

The USD/CHF falls during the North American session, depreciating by some 0.20% at the time of writing, trading near 0.7850, as traders brace for the Federal Reserve’s monetary policy decision on Wednesday.
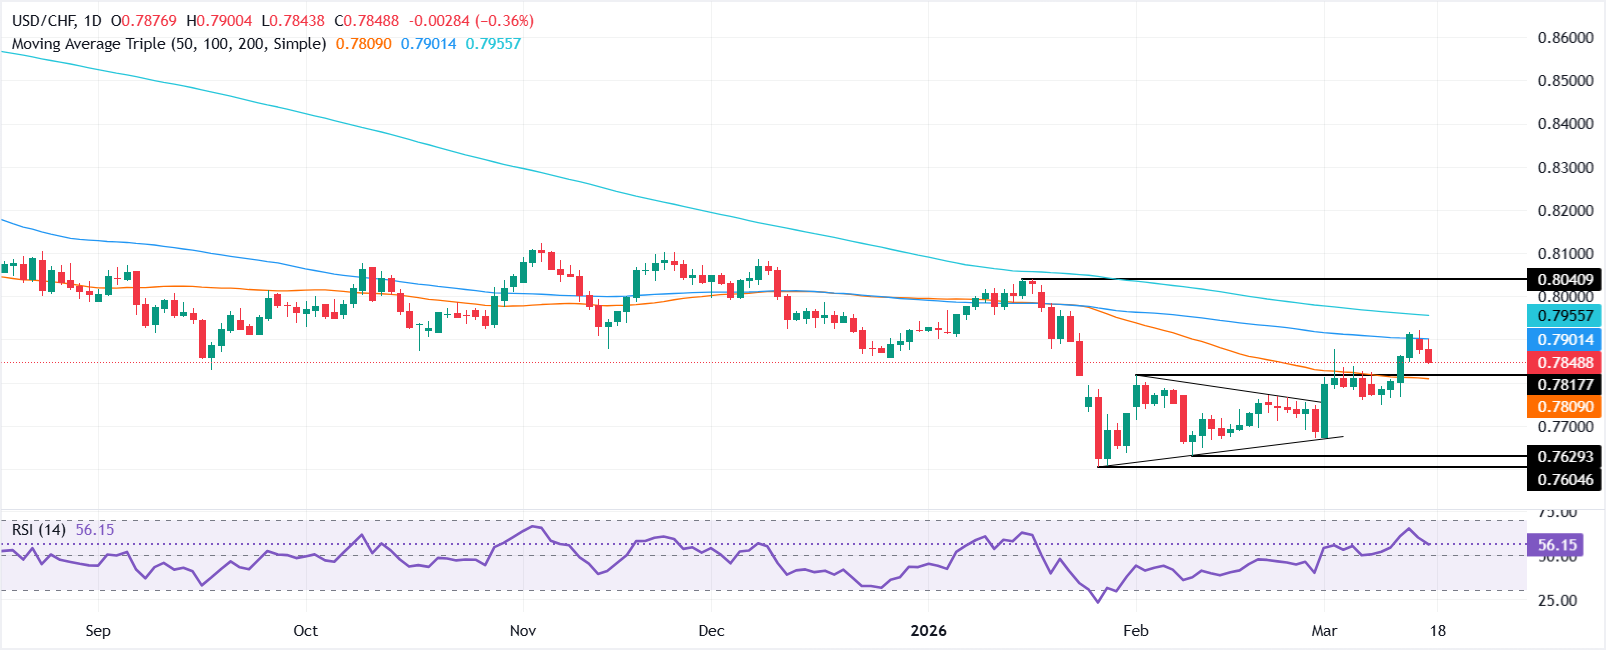
- USD/CHF drops 0.20% to 0.7850 after rejection near the 100-day SMA at 0.7897.
- Break above 0.7900 could open door toward 0.8000 and 0.8108.
- Fall below 0.7800 exposes downside risk toward 0.7700 and 0.7601.
The USD/CHF falls during the North American session, depreciating by some 0.20% at the time of writing, trading near 0.7850, as traders brace for the Federal Reserve’s monetary policy decision on Wednesday.
USD/CHF Price Forecast: Technical outlook
The technical picture shows the pair reached a stiff resistance near the 100-day SMA at around 0.7897, which prevented it from testing the 0.8000 figure. Since then, the USD/CHF has fallen to a three-day low of 0.7843, but in the short term, price action seems constructive after reaching a series of higher highs and higher lows.
From a momentum standpoint, the Relative Strength Index (RSI) shows that buyers are in charge, though they must clear 0.7900, followed by the 200-day SMA at 0.7946, which could pave the way for further upside. If USD/CHF clears 0.8000, look for a test of the November 4, 2025, daily high at 0.8108.
Conversely, if USD/CHF dives below 0.7800, the next area of interest would be the 0.7700 mark, followed by the yearly low of 0.7601.
USD/CHF Price Chart – Daily
Swiss Franc Price This week
The table below shows the percentage change of Swiss Franc (CHF) against listed major currencies this week. Swiss Franc was the strongest against the US Dollar.
| USD | EUR | GBP | JPY | CAD | AUD | NZD | CHF | |
|---|---|---|---|---|---|---|---|---|
| USD | -1.00% | -0.84% | -0.33% | -0.26% | -1.57% | -1.12% | -0.68% | |
| EUR | 1.00% | 0.18% | 0.61% | 0.74% | -0.56% | -0.13% | 0.32% | |
| GBP | 0.84% | -0.18% | 0.55% | 0.56% | -0.73% | -0.31% | 0.21% | |
| JPY | 0.33% | -0.61% | -0.55% | 0.10% | -1.23% | -0.75% | -0.32% | |
| CAD | 0.26% | -0.74% | -0.56% | -0.10% | -1.35% | -0.85% | -0.40% | |
| AUD | 1.57% | 0.56% | 0.73% | 1.23% | 1.35% | 0.43% | 0.90% | |
| NZD | 1.12% | 0.13% | 0.31% | 0.75% | 0.85% | -0.43% | 0.43% | |
| CHF | 0.68% | -0.32% | -0.21% | 0.32% | 0.40% | -0.90% | -0.43% |
The heat map shows percentage changes of major currencies against each other. The base currency is picked from the left column, while the quote currency is picked from the top row. For example, if you pick the Swiss Franc from the left column and move along the horizontal line to the US Dollar, the percentage change displayed in the box will represent CHF (base)/USD (quote).

يعتمد أكثر من مليون مستخدم على FXStreet للحصول على بيانات سوقية لحظية، وأدوات رسوم بيانية، ورؤى خبراء، وأخبار الفوركس. يساعد تقويمهم الاقتصادي الشامل والندوات التعليمية عبر الويب المتداولين على البقاء على اطلاع واتخاذ قرارات محسوبة. لدى FXStreet فريق يضم حوالي 60 محترفًا موزعين بين مقر برشلونة ومناطق عالمية مختلفة.
اقرأ المزيد


