
USD/CHF Price Forecast: Slumps below 0.7800 after clash on 50-day SMA
بواسطة Christian Borjon Valencia
تاريخ النشر: 5 Mar 2026 | تاريخ التعديل: 5 Mar 2026


المقالات الشائعة

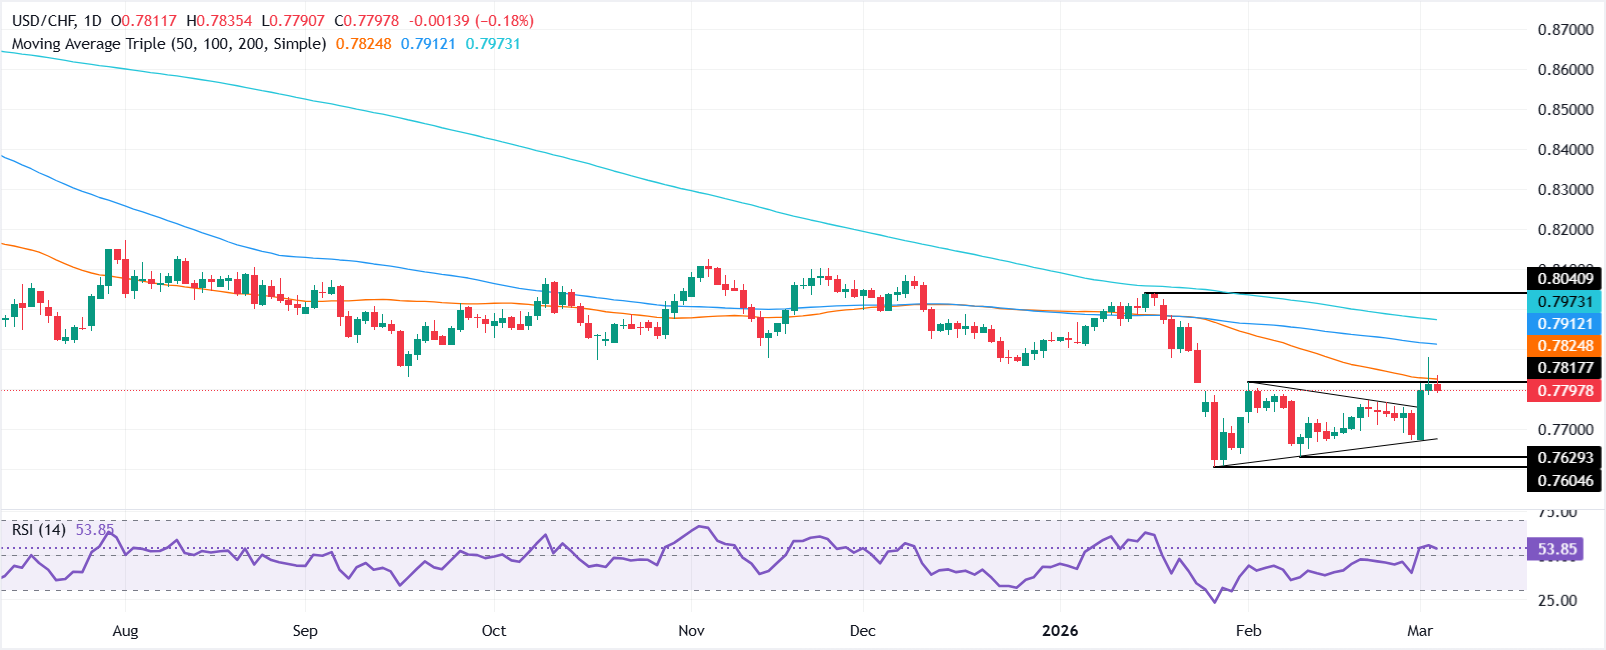
USD/CHF retreats on Wednesday, down by 0.25% as the pair failed to post a daily close above the 50-day Simple Moving Average (SMA) of 0.7819. The Greenback trimmed some of its Wednesday’s gains on risk aversion.
- USD/CHF falls 0.25% as rejection at 50-day SMA near 0.7819 halts rebound.
- A break above 0.7878 would expose the 100-day SMA at 0.7909.
- A drop below 0.7777 could open the door to 0.7700 and 0.7660 support.
USD/CHF retreats on Wednesday, down by 0.25% as the pair failed to post a daily close above the 50-day Simple Moving Average (SMA) of 0.7819. The Greenback trimmed some of its Wednesday’s gains on risk aversion. The pair trades below the 0.7800 figure, poised to remain glued to 'the figure' waiting for a fresh catalyst.
USD/CHF Price Forecast: Technical outlook
Price action suggests the USD/CHF downtrend remains in place, unless buyers push prices higher. The successive series of lower highs and lower lows is intact, but a challenge to the Tuesday daily high of 0.7878 would open the door to test immediate resistance at the 100-day SMA at 0.7909.
The Relative Strength Index (RSI) is bullish, but it has turned downwards, aiming for the RSI’s neutral level. This and USD/CHF’s second daily close below the 50-day SMA clears the path for a pullback.
On the downside, if the pair hurdles the Tuesday low of 0.7784, sellers could opt to challenge the 0.7700 figure. On further weakness, a key support trendline emerges at around 0.7660-0.7680.
USD/CHF Price Chart – Daily
US Dollar Price This week
The table below shows the percentage change of US Dollar (USD) against listed major currencies this week. US Dollar was the strongest against the Swiss Franc.
| USD | EUR | GBP | JPY | CAD | AUD | NZD | CHF | |
|---|---|---|---|---|---|---|---|---|
| USD | 1.20% | 0.49% | 0.71% | 0.15% | -0.31% | 0.28% | 1.60% | |
| EUR | -1.20% | -0.72% | -0.51% | -1.04% | -1.49% | -0.88% | 0.39% | |
| GBP | -0.49% | 0.72% | 0.00% | -0.33% | -0.79% | -0.18% | 1.10% | |
| JPY | -0.71% | 0.51% | 0.00% | -0.50% | -0.96% | -0.27% | 0.92% | |
| CAD | -0.15% | 1.04% | 0.33% | 0.50% | -0.50% | 0.22% | 1.43% | |
| AUD | 0.31% | 1.49% | 0.79% | 0.96% | 0.50% | 0.61% | 1.91% | |
| NZD | -0.28% | 0.88% | 0.18% | 0.27% | -0.22% | -0.61% | 1.29% | |
| CHF | -1.60% | -0.39% | -1.10% | -0.92% | -1.43% | -1.91% | -1.29% |
The heat map shows percentage changes of major currencies against each other. The base currency is picked from the left column, while the quote currency is picked from the top row. For example, if you pick the US Dollar from the left column and move along the horizontal line to the Japanese Yen, the percentage change displayed in the box will represent USD (base)/JPY (quote).

يعتمد أكثر من مليون مستخدم على FXStreet للحصول على بيانات سوقية لحظية، وأدوات رسوم بيانية، ورؤى خبراء، وأخبار الفوركس. يساعد تقويمهم الاقتصادي الشامل والندوات التعليمية عبر الويب المتداولين على البقاء على اطلاع واتخاذ قرارات محسوبة. لدى FXStreet فريق يضم حوالي 60 محترفًا موزعين بين مقر برشلونة ومناطق عالمية مختلفة.
اقرأ المزيد


