
USD/JPY Price Forecast: Hovers around 157.50 as bullish bias prevails
بواسطة Akhtar Faruqui
تاريخ النشر: 6 Mar 2026 | تاريخ التعديل: 6 Mar 2026


المقالات الشائعة

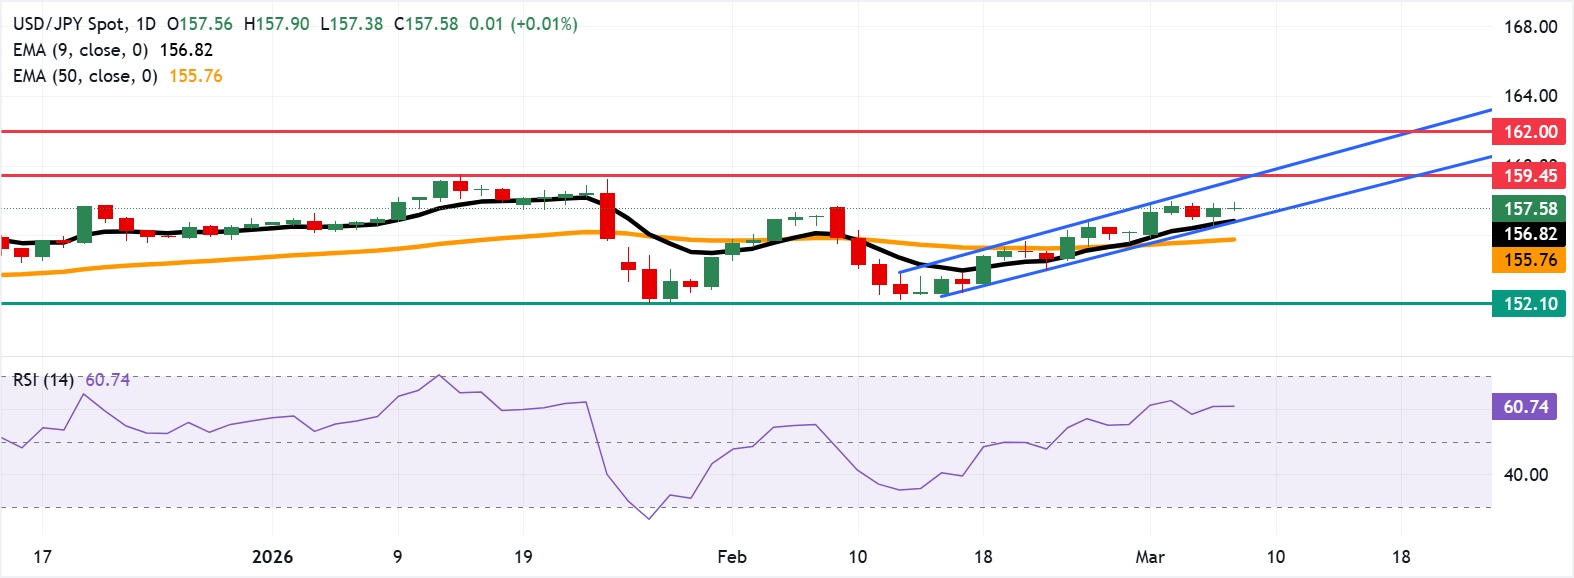
USD/JPY extends its gains for the second successive session, trading around 157.60 during the European hours on Friday. On the daily chart, technical analysis indicates a persistent bullish bias as the pair remains within the ascending channel pattern.
- USD/JPY may test the rise toward the ascending channel’s upper boundary around 159.20.
- The 14-day Relative Strength Index moves into the low-60s, signaling strengthening bullish momentum.
- Initial support stands at the ascending channel’s lower boundary near 156.90.
USD/JPY extends its gains for the second successive session, trading around 157.60 during the European hours on Friday. On the daily chart, technical analysis indicates a persistent bullish bias as the pair remains within the ascending channel pattern.
The near-term bias is bullish as price extends its advance above both the short-term and medium-term Exponential Moving Averages (EMAs), with the nine-day EMA now tracking well above the 50-day average and reinforcing upside momentum.
The 14-day Relative Strength Index (RSI) has pushed into the low 60s, confirming strengthening bullish pressure without yet signalling overbought conditions, which keeps the focus on further gains while this configuration holds.
The USD/JPY pair may explore the region around the upper boundary of the ascending channel at 159.20, followed by 159.45, the highest since July 2024. A break above the latter would lead the pair to hit the all-time high of 162.00, recorded in July 2024.
The initial support lies at the lower boundary of the ascending channel around 156.90, aligned with the nine-day EMA at 156.82. Further declines below the short-term average would expose the medium-term average at 155.76.
A break below the 50-day EMA would cause the cause the emergence of a bearish bias and put downward pressure on the USD/JPY pair to navigate the area around the five-month low at 152.10.
(The technical analysis of this story was written with the help of an AI tool.)
Japanese Yen Price Today
The table below shows the percentage change of Japanese Yen (JPY) against listed major currencies today. Japanese Yen was the strongest against the US Dollar.
| USD | EUR | GBP | JPY | CAD | AUD | NZD | CHF | |
|---|---|---|---|---|---|---|---|---|
| USD | -0.10% | -0.09% | -0.02% | -0.13% | -0.47% | -0.22% | -0.18% | |
| EUR | 0.10% | 0.00% | 0.11% | -0.04% | -0.38% | -0.13% | -0.08% | |
| GBP | 0.09% | -0.01% | 0.11% | -0.05% | -0.39% | -0.14% | -0.09% | |
| JPY | 0.02% | -0.11% | -0.11% | -0.13% | -0.47% | -0.23% | -0.18% | |
| CAD | 0.13% | 0.04% | 0.05% | 0.13% | -0.35% | -0.10% | -0.04% | |
| AUD | 0.47% | 0.38% | 0.39% | 0.47% | 0.35% | 0.25% | 0.30% | |
| NZD | 0.22% | 0.13% | 0.14% | 0.23% | 0.10% | -0.25% | 0.05% | |
| CHF | 0.18% | 0.08% | 0.09% | 0.18% | 0.04% | -0.30% | -0.05% |
The heat map shows percentage changes of major currencies against each other. The base currency is picked from the left column, while the quote currency is picked from the top row. For example, if you pick the Japanese Yen from the left column and move along the horizontal line to the US Dollar, the percentage change displayed in the box will represent JPY (base)/USD (quote).

يعتمد أكثر من مليون مستخدم على FXStreet للحصول على بيانات سوقية لحظية، وأدوات رسوم بيانية، ورؤى خبراء، وأخبار الفوركس. يساعد تقويمهم الاقتصادي الشامل والندوات التعليمية عبر الويب المتداولين على البقاء على اطلاع واتخاذ قرارات محسوبة. لدى FXStreet فريق يضم حوالي 60 محترفًا موزعين بين مقر برشلونة ومناطق عالمية مختلفة.
اقرأ المزيد


