
XRP signals mild rebound amid cooling retail and institutional interest
بواسطة John Isige
تم التحديث: 1 Apr 2026


المقالات الشائعة

Ripple (XRP) is trading above $1.35 at the time of writing on Wednesday, rising from its daily open of $1.34. Despite the remittance token securing support above the $1.35 level after edging higher for the second consecutive day, overall retail and institutional demand remains subdued.
- XRP edges higher for the second consecutive day, holding $1.35 as immediate support on Wednesday.
- XRP retail demand cools as futures Open Interest drops to $2.45 billion, likely limiting recovery potential.
- XRP ETF activity remained muted on Tuesday after outflows of $2.3 million on Monday, reflecting sticky risk-off sentiment.
Ripple (XRP) is trading above $1.35 at the time of writing on Wednesday, rising from its daily open of $1.34. Despite the remittance token securing support above the $1.35 level after edging higher for the second consecutive day, overall retail and institutional demand remains subdued.
Meanwhile, attention remains on whether XRP can sustain its rebound amid evolving sentiment and liquidity conditions.
XRP institutional and retail interest fade
The United States (US) and Israel’s war with Iran, which is now in its second month, has continued to weigh on crypto assets as recovery attempts are quickly absorbed, leading to frequent pullbacks.
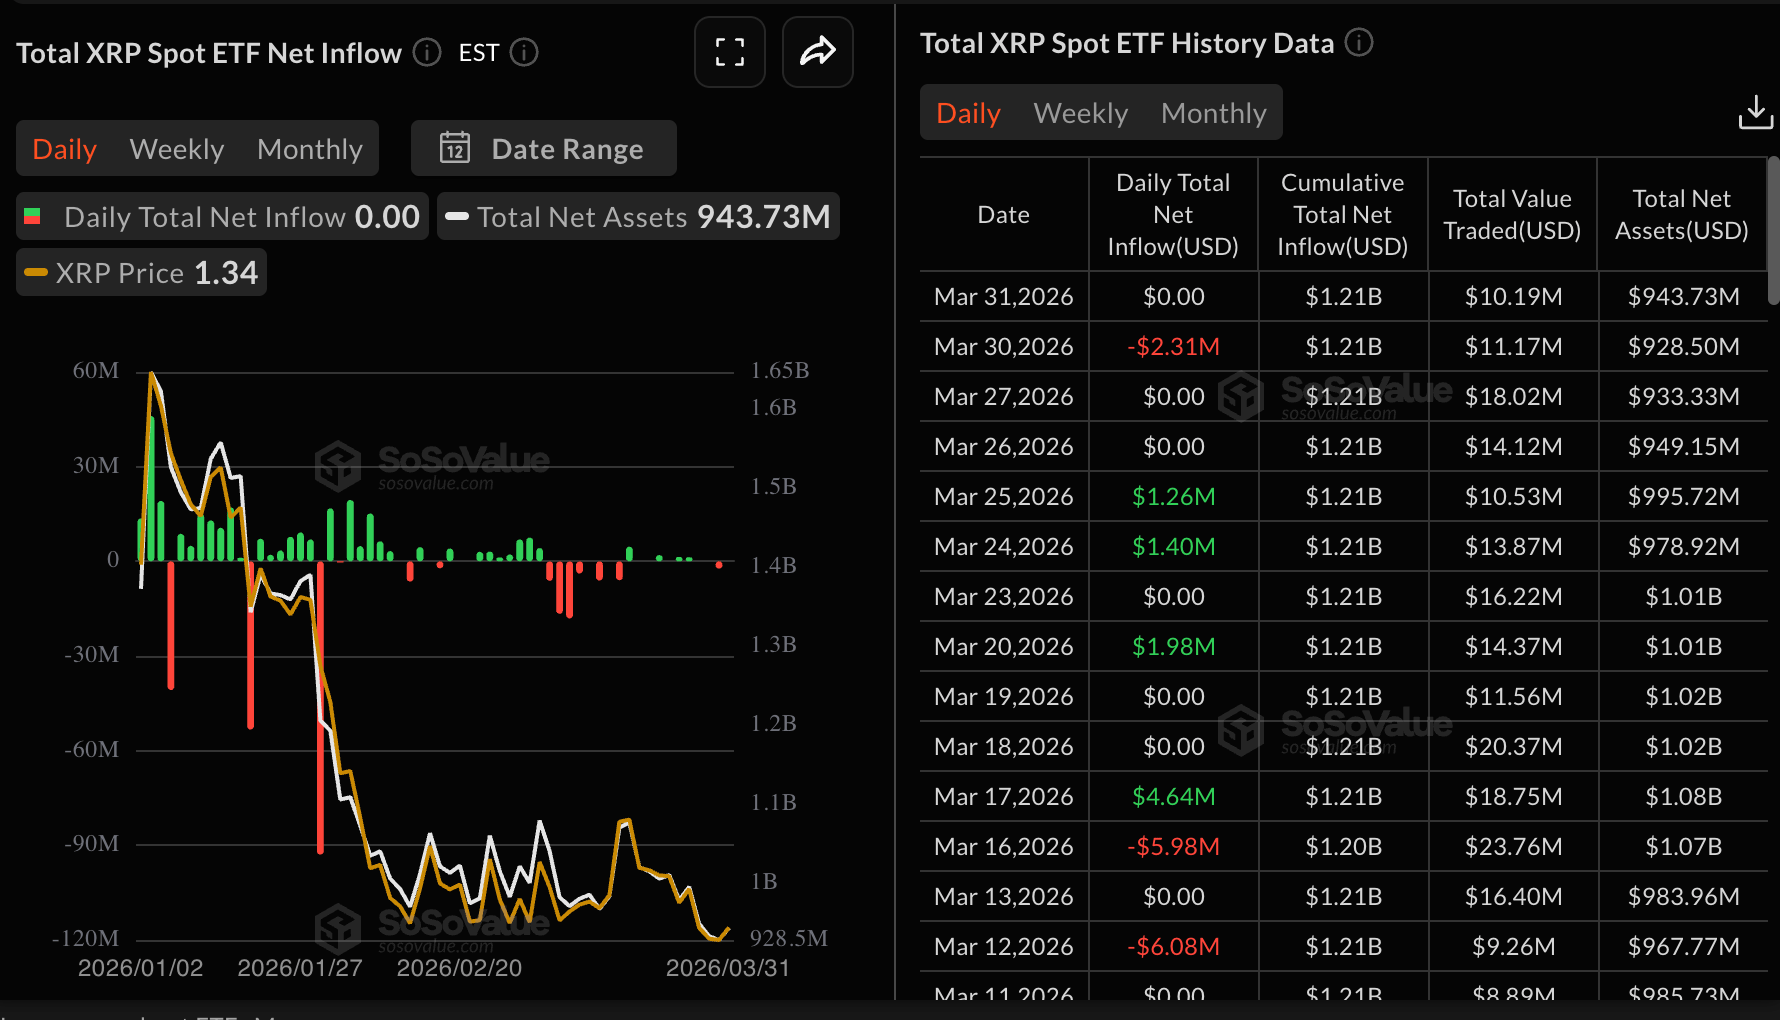
Sentiment, as reflected in the XRP spot Exchange-Traded Funds (ETFs), remains weak following muted activity on Tuesday. As reported, US-listed ETFs experienced outflows totaling $2.3 million on Monday.
Cumulative inflows have steadied at $1.21 billion, while net assets under management have dropped to around $944 million, from the record $1.65 billion on January 1.
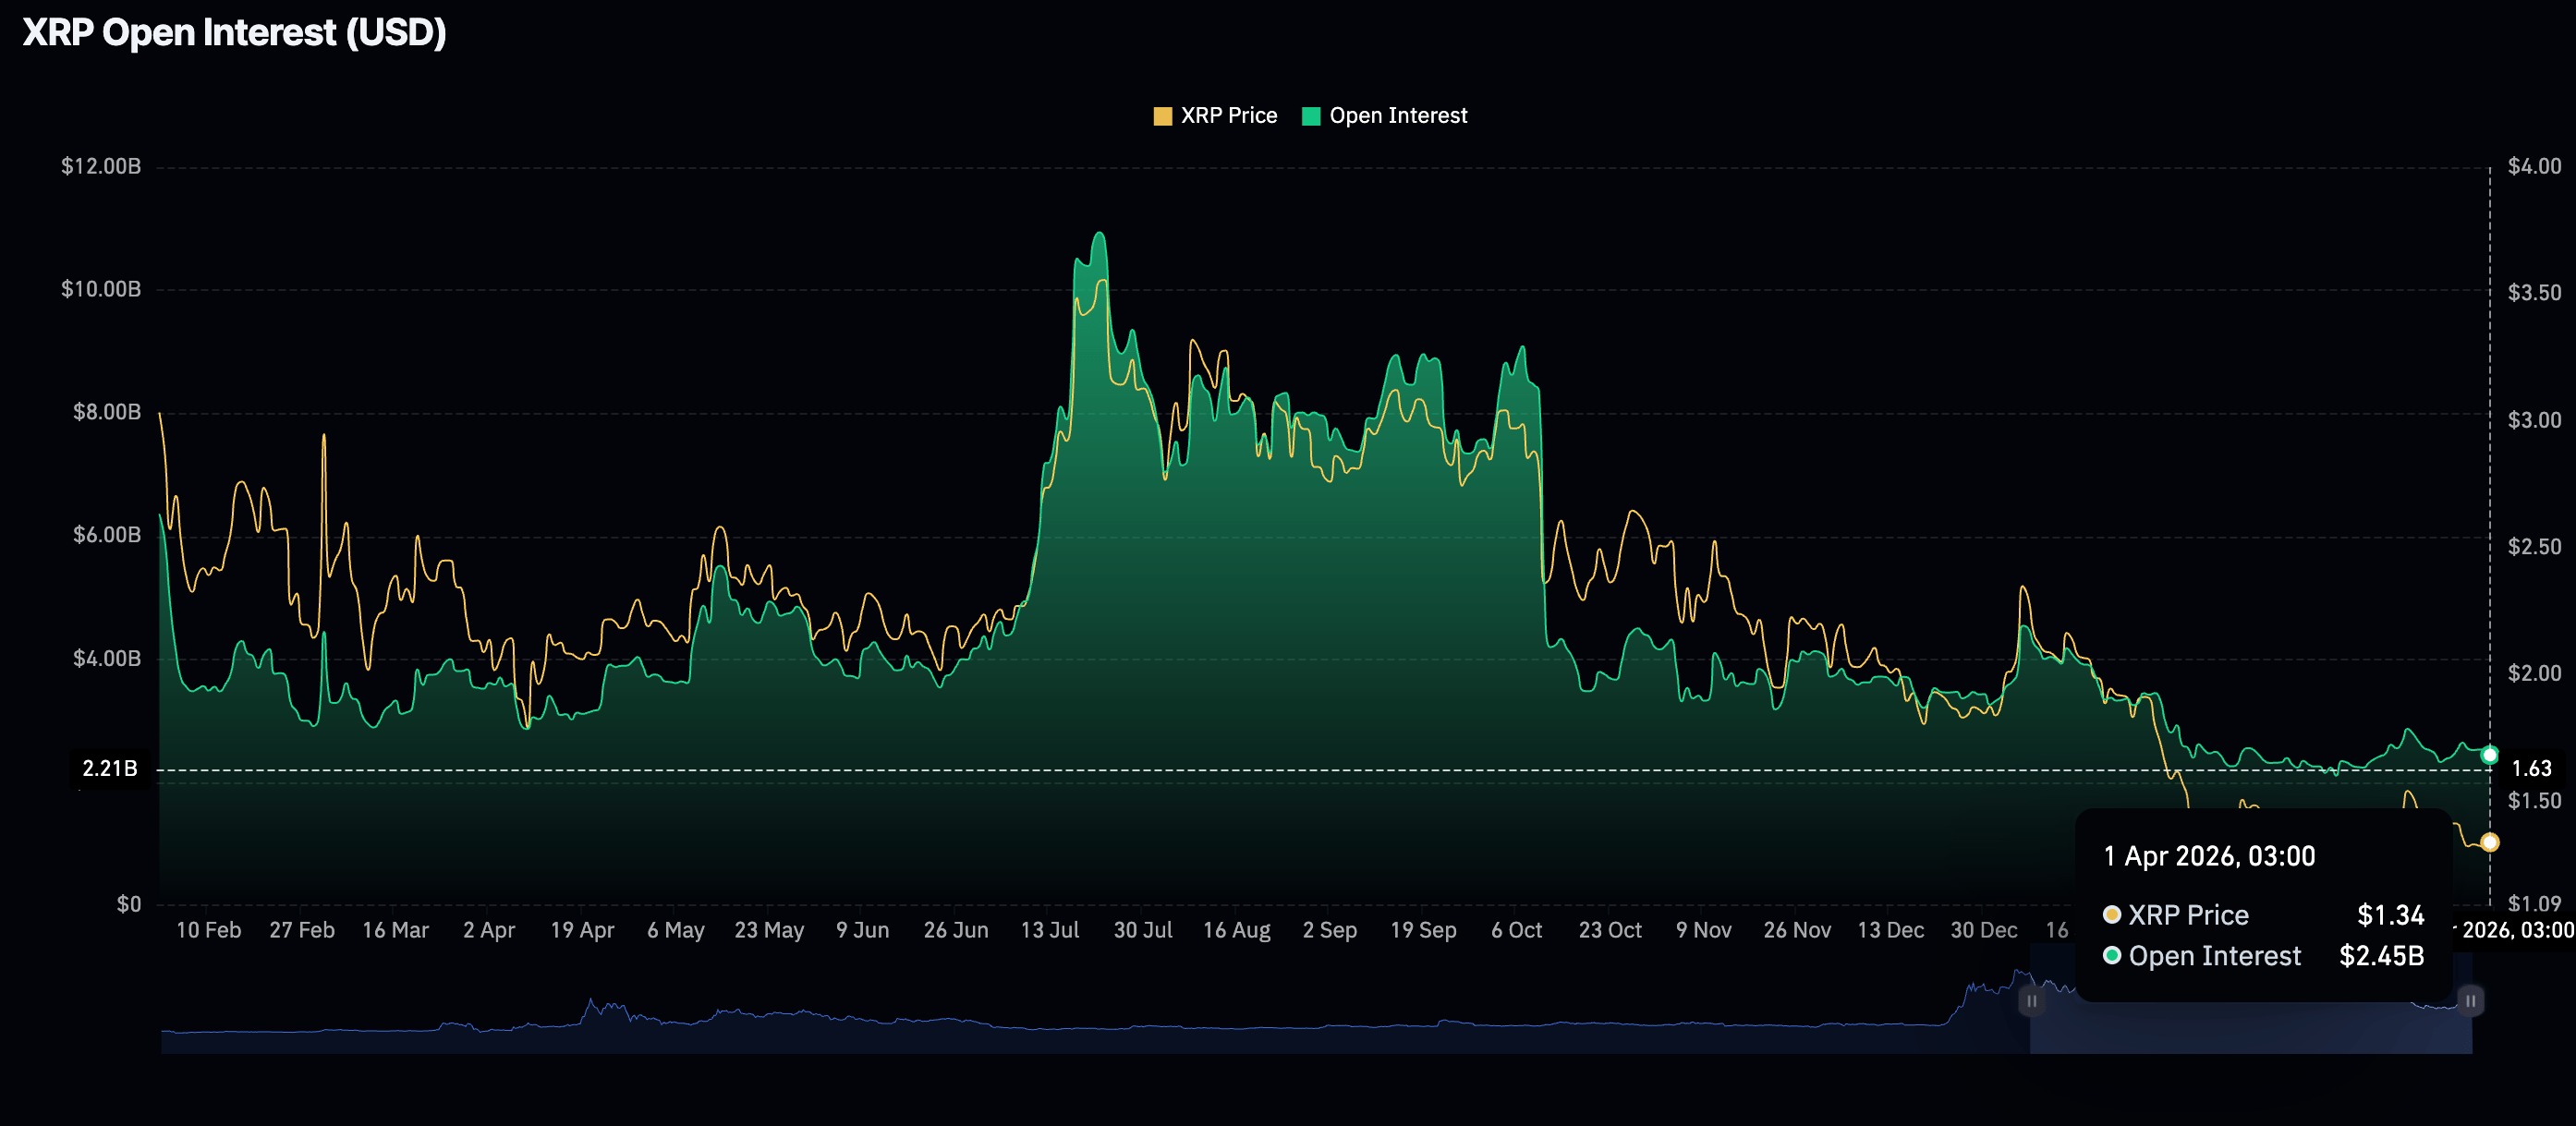
Retail demand has similarly weakened, as evidenced by futures Open Interest (OI) in the derivatives market, falling to $2.45 billion on Wednesday from $2.54 billion the previous day.
In contrast, OI peaked at a record $10.94 billion in July, coinciding with the price hitting an all-time high of $3.66. This sharp decline has dampened retail investor interest in the token and signals their reluctance to take on additional risk.
Technical outlook: XRP edges higher as support holds
XRP is trading slightly above $1.35 as its near-term bias stays neutral-to-bearish. The price continues to oscillate beneath the broken descending resistance line, with the latest rebound attempts failing to secure follow-through above the $1.43 area. The cluster of 50-day, 100-day and 200-day Exponential Moving Averages (EMAs) well above spot underscores a dominant downside backdrop.
Moreover, the Moving Average Convergence Divergence (MACD) indicator holds below the signal on the daily chart, suggesting persistent negative momentum. The Relative Strength Index around 43 remains below the midline on the same chart, reinforcing a downside tilt but not yet indicating oversold conditions.
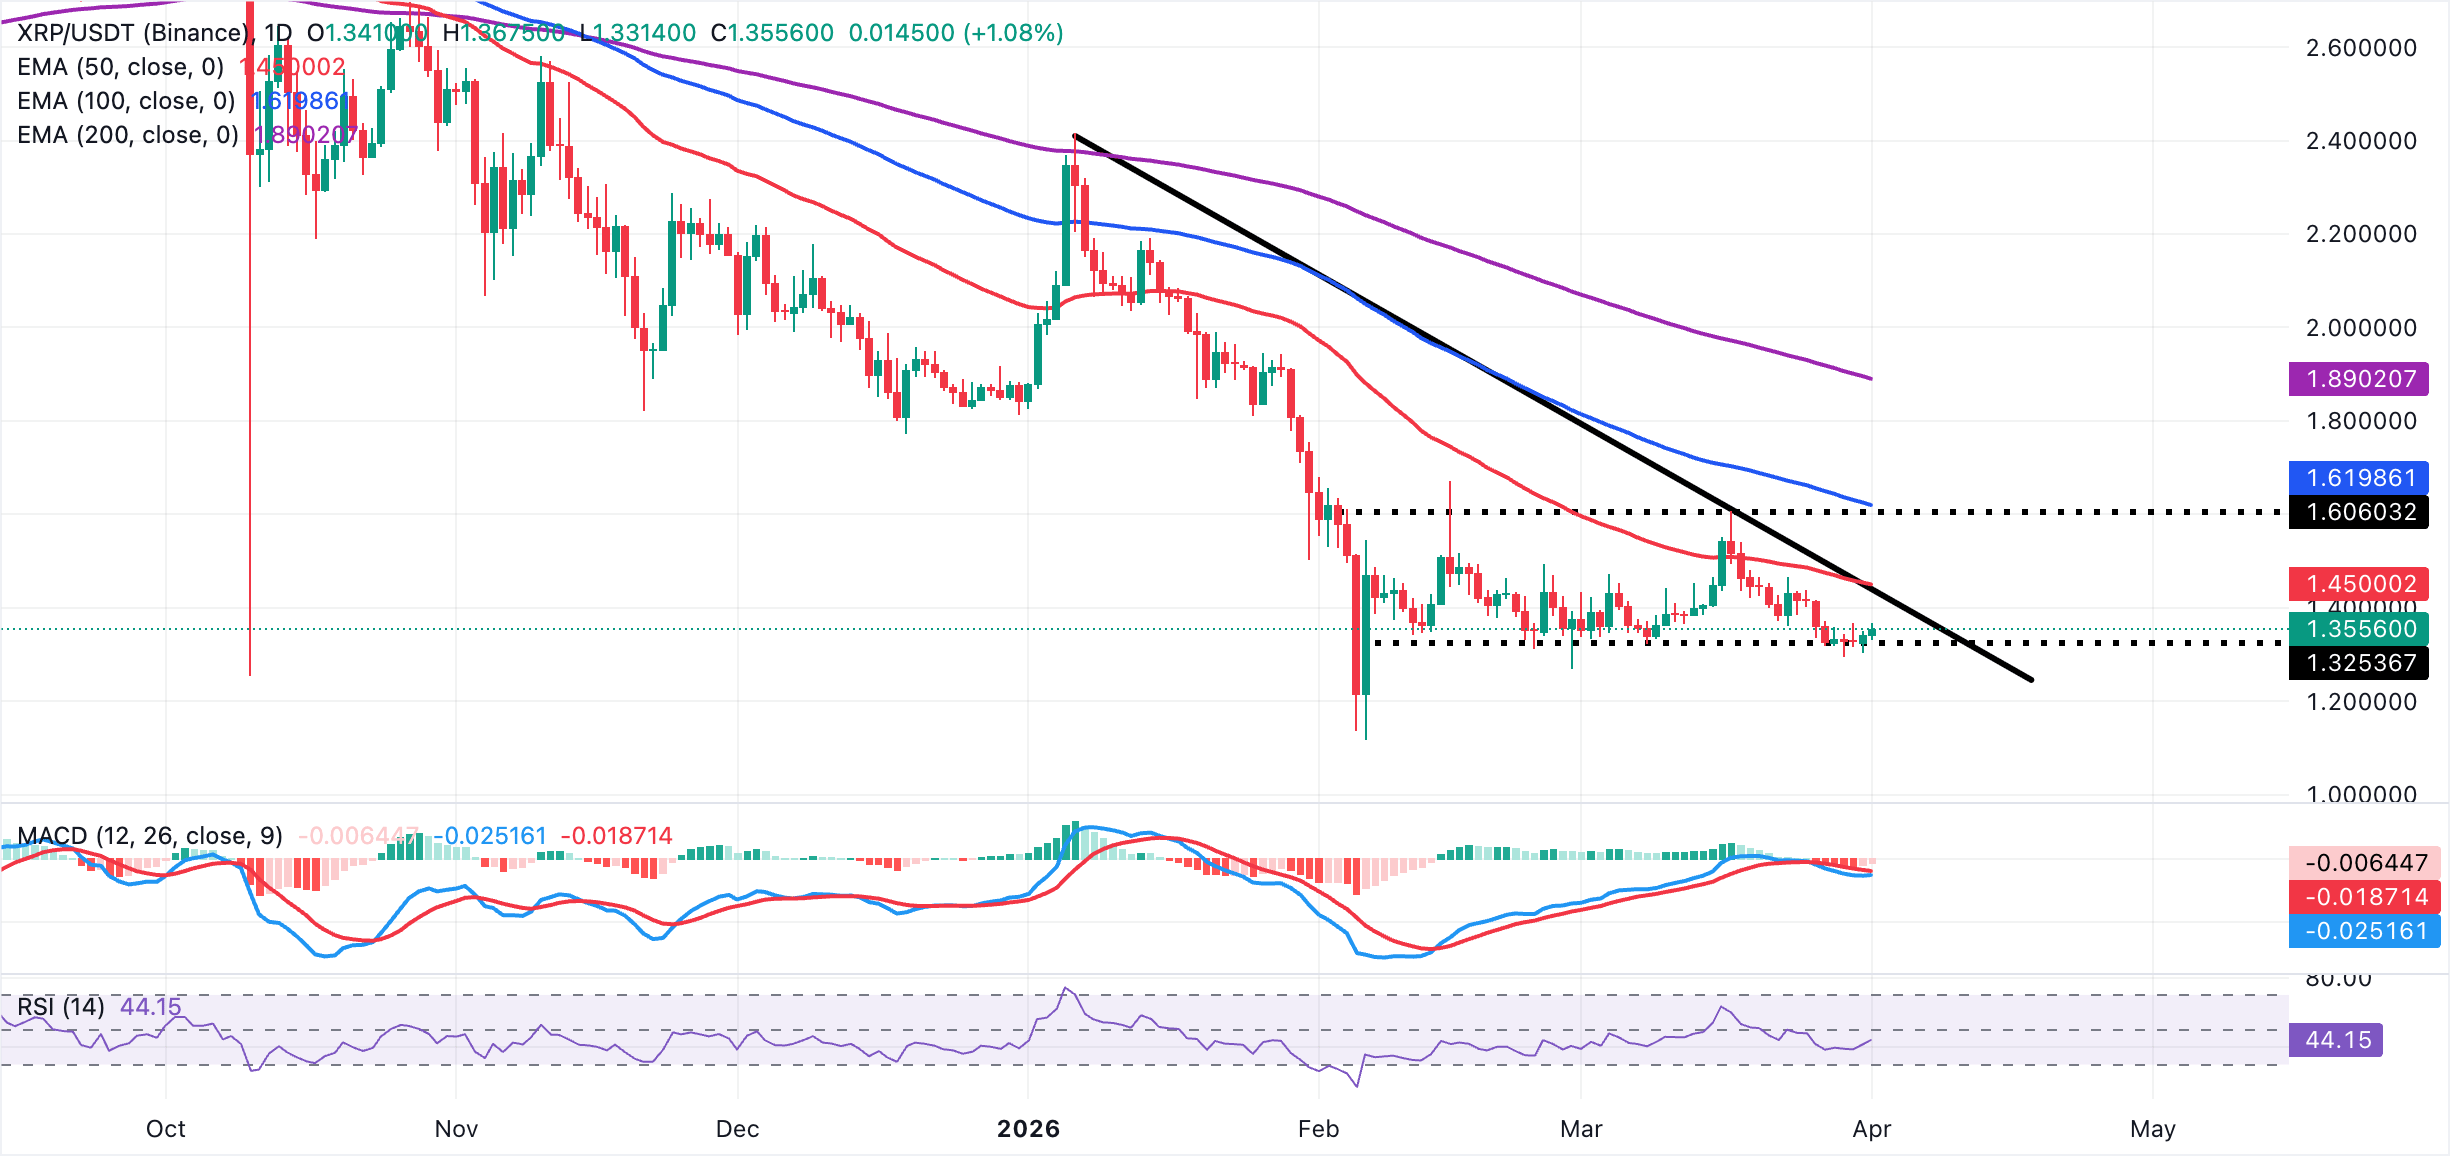
XRP's initial resistance is now seen near $1.37, ahead of the $1.40–$1.43 band that capped recent bounces and aligns with the broken trendline region. A daily close above $1.43 would be needed to ease bearish pressure and open the way toward the $1.45–$1.52 zone. On the downside, immediate support emerges at $1.33, followed by last week’s low near $1.30. A break here would expose the $1.25 demand handle. As long as price holds below $1.43, rallies would be vulnerable to renewed selling into these resistance levels.
Cryptocurrency metrics FAQs
The developer or creator of each cryptocurrency decides on the total number of tokens that can be minted or issued. Only a certain number of these assets can be minted by mining, staking or other mechanisms. This is defined by the algorithm of the underlying blockchain technology. On the other hand, circulating supply can also be decreased via actions such as burning tokens, or mistakenly sending assets to addresses of other incompatible blockchains.
Market capitalization is the result of multiplying the circulating supply of a certain asset by the asset’s current market value.
Trading volume refers to the total number of tokens for a specific asset that has been transacted or exchanged between buyers and sellers within set trading hours, for example, 24 hours. It is used to gauge market sentiment, this metric combines all volumes on centralized exchanges and decentralized exchanges. Increasing trading volume often denotes the demand for a certain asset as more people are buying and selling the cryptocurrency.
Funding rates are a concept designed to encourage traders to take positions and ensure perpetual contract prices match spot markets. It defines a mechanism by exchanges to ensure that future prices and index prices periodic payments regularly converge. When the funding rate is positive, the price of the perpetual contract is higher than the mark price. This means traders who are bullish and have opened long positions pay traders who are in short positions. On the other hand, a negative funding rate means perpetual prices are below the mark price, and hence traders with short positions pay traders who have opened long positions.
(The technical analysis of this story was written with the help of an AI tool.)

يعتمد أكثر من مليون مستخدم على FXStreet للحصول على بيانات سوقية لحظية، وأدوات رسوم بيانية، ورؤى خبراء، وأخبار الفوركس. يساعد تقويمهم الاقتصادي الشامل والندوات التعليمية عبر الويب المتداولين على البقاء على اطلاع واتخاذ قرارات محسوبة. لدى FXStreet فريق يضم حوالي 60 محترفًا موزعين بين مقر برشلونة ومناطق عالمية مختلفة.
اقرأ المزيد


