
Trade The World
AUD/JPY Price Forecast: Tests confluence support zone near 96.50, nine-day EMA
بواسطة Akhtar Faruqui
تاريخ النشر: 4 Sep 2025 | تاريخ التعديل: 4 Sep 2025


POPULAR ARTICLES

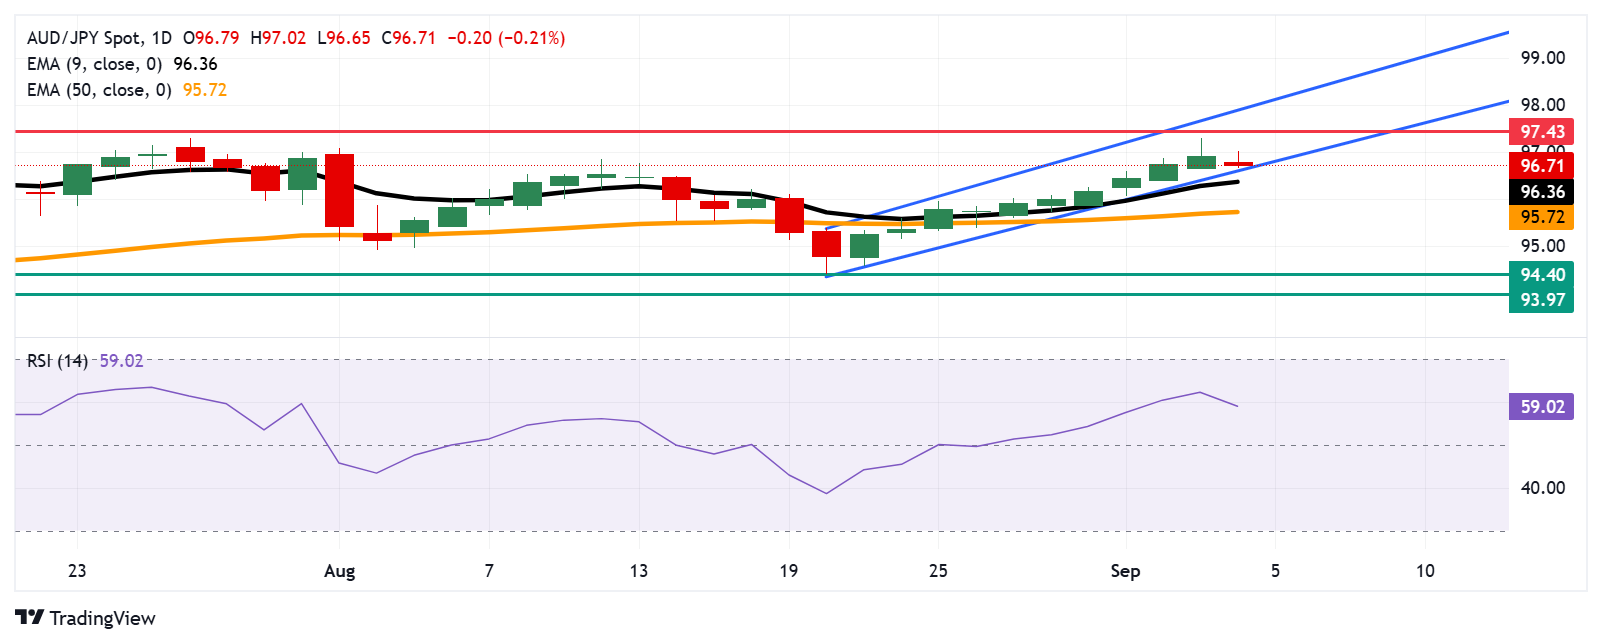
AUD/JPY halts its winning streak that began on August 21, trading around 96.70 during the early European hours on Thursday. The technical analysis of the daily chart shows that the currency cross is positioned within the ascending channel pattern, suggesting a prevailing bullish bias.
- AUD/JPY may find its primary resistance at the eight-month high of 97.43.
- The 14-day Relative Strength Index is positioned above the 50 mark, indicating a bullish bias.
- The initial support zone appears at the ascending channel’s lower boundary around 96.60, followed by the nine-day EMA at 96.36.
AUD/JPY halts its winning streak that began on August 21, trading around 96.70 during the early European hours on Thursday. The technical analysis of the daily chart shows that the currency cross is positioned within the ascending channel pattern, suggesting a prevailing bullish bias.
The AUD/JPY cross remains above the nine-day Exponential Moving Average (EMA), indicating short-term price momentum is stronger. Additionally, the 14-day Relative Strength Index (RSI) is positioned above the 50 mark, indicating bullish market sentiment.
On the upside, the AUD/JPY cross may target the eight-month high at 97.43, which was recorded on July 15. A successful break above this level would support the currency cross to explore the area around the upper boundary of the ascending channel at 97.90, followed by the psychological level of 98.00.
The AUD/JPY cross is testing its immediate support at the ascending channel’s lower boundary around 96.60, followed by the nine-day EMA at 96.36. A break below this confluence support zone would weaken the short-term price momentum and put downward pressure to test the 50-day EMA at 95.72.
Further declines would lead the AUD/JPY cross to navigate the region around the two-month low of 94.40, recorded on August 20, followed by the three-month low of 93.97, which was recorded on July 1.
AUD/JPY: Daily Chart
Australian Dollar Price Today
The table below shows the percentage change of Australian Dollar (AUD) against listed major currencies today. Australian Dollar was the weakest against the US Dollar.
| USD | EUR | GBP | JPY | CAD | AUD | NZD | CHF | |
|---|---|---|---|---|---|---|---|---|
| USD | 0.12% | 0.18% | 0.18% | 0.15% | 0.28% | 0.09% | 0.16% | |
| EUR | -0.12% | 0.06% | 0.02% | 0.03% | 0.21% | -0.03% | -0.01% | |
| GBP | -0.18% | -0.06% | 0.04% | -0.04% | 0.13% | -0.08% | -0.08% | |
| JPY | -0.18% | -0.02% | -0.04% | -0.01% | 0.05% | -0.02% | 0.00% | |
| CAD | -0.15% | -0.03% | 0.04% | 0.00% | 0.09% | -0.03% | -0.04% | |
| AUD | -0.28% | -0.21% | -0.13% | -0.05% | -0.09% | -0.23% | -0.20% | |
| NZD | -0.09% | 0.03% | 0.08% | 0.02% | 0.03% | 0.23% | 0.06% | |
| CHF | -0.16% | 0.00% | 0.08% | -0.01% | 0.04% | 0.20% | -0.06% |
The heat map shows percentage changes of major currencies against each other. The base currency is picked from the left column, while the quote currency is picked from the top row. For example, if you pick the Australian Dollar from the left column and move along the horizontal line to the US Dollar, the percentage change displayed in the box will represent AUD (base)/USD (quote).

FXStreet
يعتمد أكثر من مليون مستخدم على FXStreet للحصول على بيانات سوقية لحظية، وأدوات رسوم بيانية، ورؤى خبراء، وأخبار الفوركس. يساعد تقويمهم الاقتصادي الشامل والندوات التعليمية عبر الويب المتداولين على البقاء على اطلاع واتخاذ قرارات محسوبة. لدى FXStreet فريق يضم حوالي 60 محترفًا موزعين بين مقر برشلونة ومناطق عالمية مختلفة.
Read More


