
AUD/USD Price Forecast: Stays below nine-day EMA near 0.6700
بواسطة Akhtar Faruqui
تاريخ النشر: 15 Jan 2026 | تاريخ التعديل: 15 Jan 2026


المقالات الشائعة

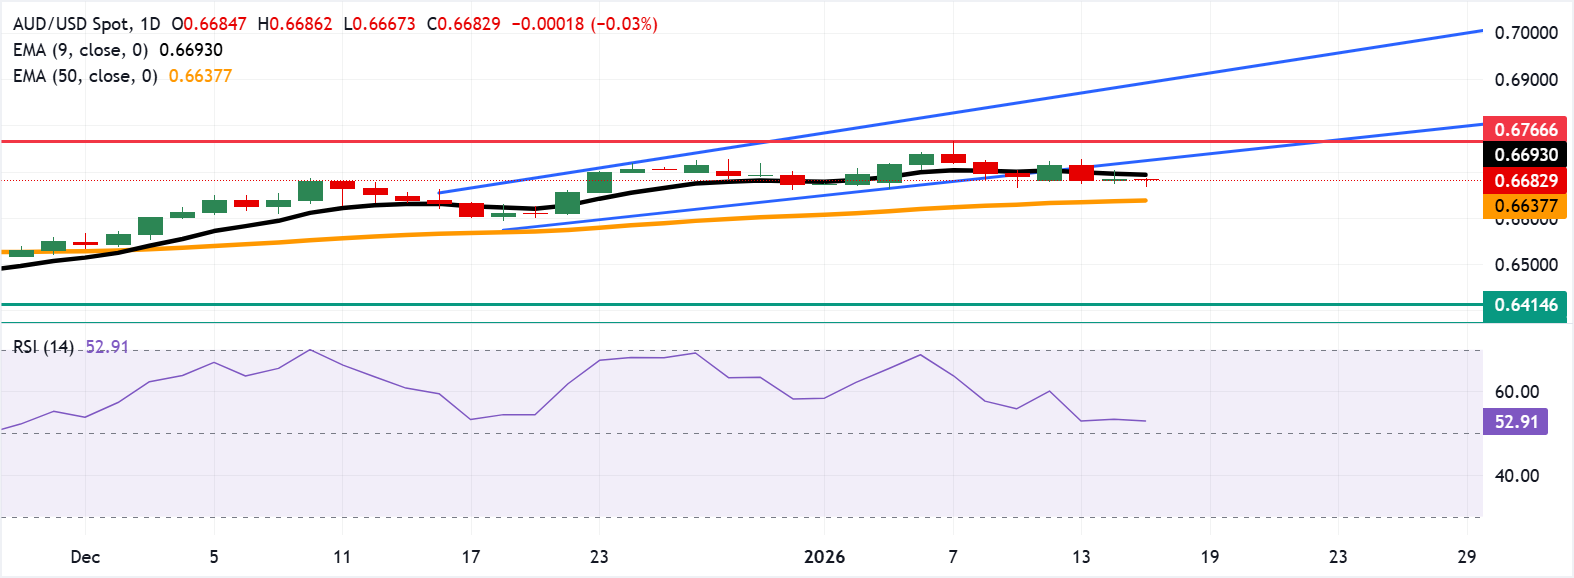
The AUD/USD pair remains steady for the second successive session, trading around 0.6680 during the European hours on Thursday. The daily chart’s technical analysis indicated a weakening bullish bias as the pair remains positioned slightly below the ascending channel pattern.
- AUD/USD could target the immediate resistance at the nine-day EMA of 0.6693.
- The 14-day Relative Strength Index, at 52.94, signals neutral conditions.
- A daily close below the short-term average could expose the 50-day EMA at 0.6638 as the next support.
The AUD/USD pair remains steady for the second successive session, trading around 0.6680 during the European hours on Thursday. The daily chart’s technical analysis indicated a weakening bullish bias as the pair remains positioned slightly below the ascending channel pattern.
The 14-day Relative Strength Index (RSI) at 52.94 (neutral) reflects fading momentum after recent gains. Additionally, the 50-day Exponential Moving Average (EMA) is trending higher and continues to underpin the AUD/USD pair, while the nine-day EMA has flattened and sits just above spot, capping immediate upside. The short-term average remains positioned above the rising 50-day EMA, keeping a bullish bias intact.
The immediate resistance lies at the nine-day EMA of 0.6693. A close above the short-term average would open room for an extension toward the ascending channel. A successful rebound within the channel would revive the bullish bias and help the AUD/USD pair to target 0.6766, its highest level since October 2024. A decisive break could open a continuation higher toward the upper boundary of the ascending channel near 0.6890.
The daily close below the short-term average would weaken the price momentum and put downward pressure on the AUD/USD pair to test the 50-day EMA at 0.6638. Further losses would open the downside toward 0.6414, the lowest since June 2025.
(The technical analysis of this story was written with the help of an AI tool.)
Australian Dollar Price Today
The table below shows the percentage change of Australian Dollar (AUD) against listed major currencies today. Australian Dollar was the weakest against the British Pound.
| USD | EUR | GBP | JPY | CAD | AUD | NZD | CHF | |
|---|---|---|---|---|---|---|---|---|
| USD | 0.09% | -0.01% | 0.02% | 0.14% | -0.01% | 0.10% | 0.12% | |
| EUR | -0.09% | -0.11% | -0.06% | 0.05% | -0.11% | 0.00% | 0.03% | |
| GBP | 0.01% | 0.11% | 0.04% | 0.16% | 0.00% | 0.11% | 0.14% | |
| JPY | -0.02% | 0.06% | -0.04% | 0.09% | -0.05% | 0.03% | 0.08% | |
| CAD | -0.14% | -0.05% | -0.16% | -0.09% | -0.14% | -0.04% | -0.01% | |
| AUD | 0.01% | 0.11% | -0.01% | 0.05% | 0.14% | 0.12% | 0.13% | |
| NZD | -0.10% | -0.01% | -0.11% | -0.03% | 0.04% | -0.12% | 0.01% | |
| CHF | -0.12% | -0.03% | -0.14% | -0.08% | 0.01% | -0.13% | -0.01% |
The heat map shows percentage changes of major currencies against each other. The base currency is picked from the left column, while the quote currency is picked from the top row. For example, if you pick the Australian Dollar from the left column and move along the horizontal line to the US Dollar, the percentage change displayed in the box will represent AUD (base)/USD (quote).

يعتمد أكثر من مليون مستخدم على FXStreet للحصول على بيانات سوقية لحظية، وأدوات رسوم بيانية، ورؤى خبراء، وأخبار الفوركس. يساعد تقويمهم الاقتصادي الشامل والندوات التعليمية عبر الويب المتداولين على البقاء على اطلاع واتخاذ قرارات محسوبة. لدى FXStreet فريق يضم حوالي 60 محترفًا موزعين بين مقر برشلونة ومناطق عالمية مختلفة.
اقرأ المزيد


