
Avalanche Price Forecast: Bullish momentum builds post-resistance breakout
بواسطة Vishal Dixit
تاريخ النشر: 4 Dec 2025 | تاريخ التعديل: 4 Dec 2025


المقالات الشائعة

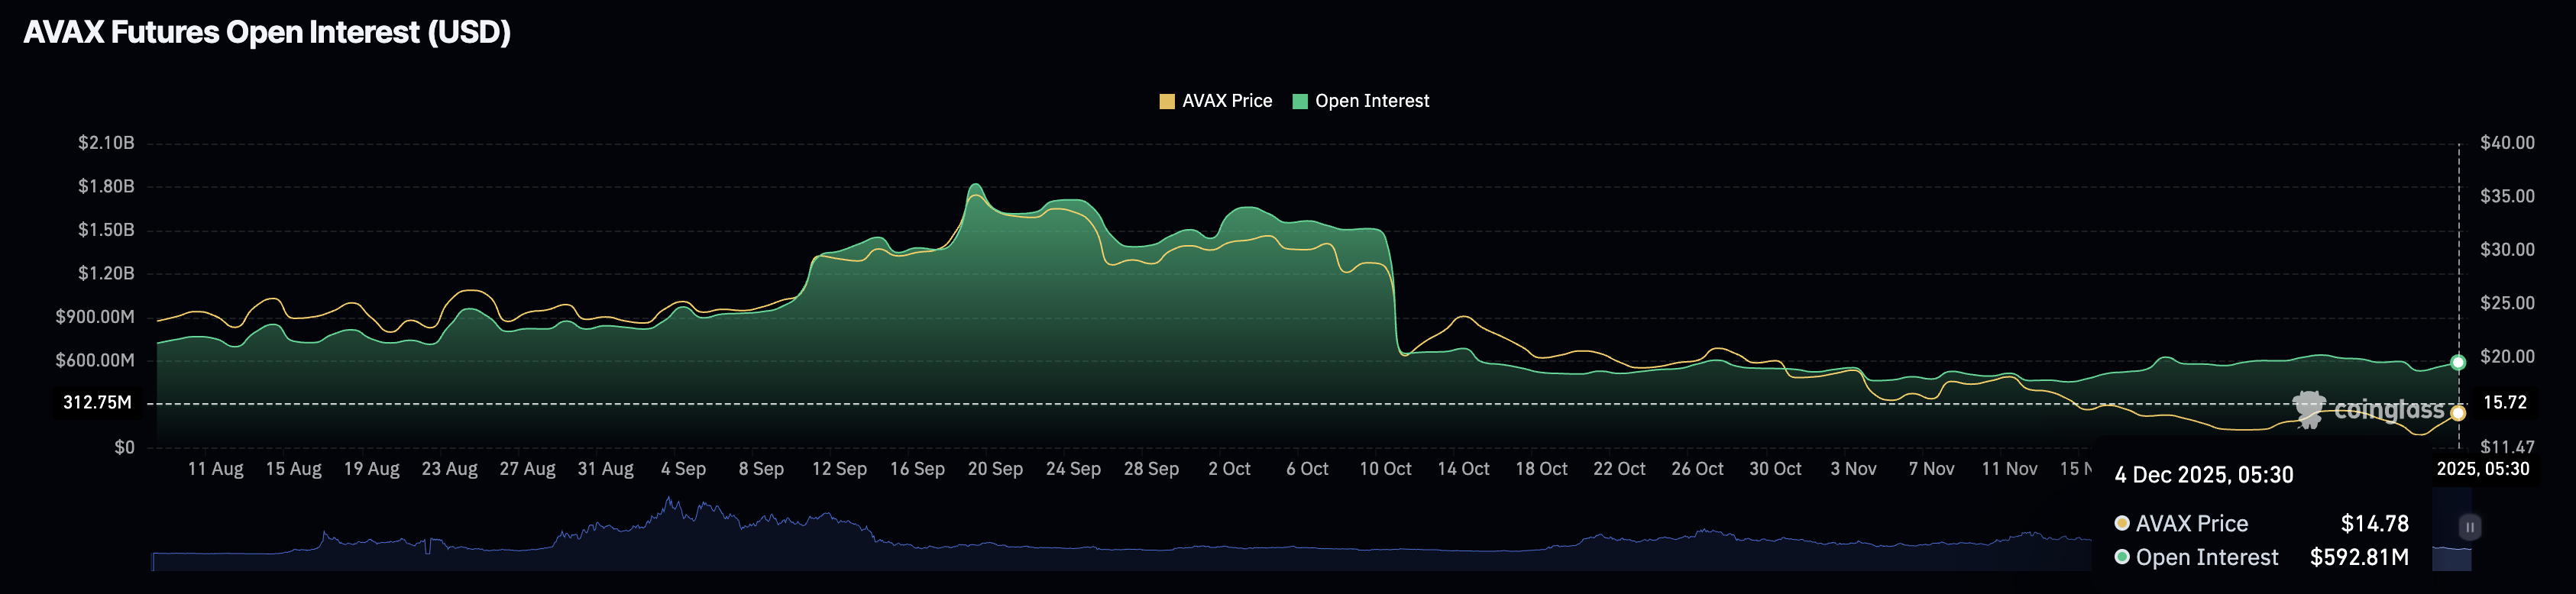
Avalanche (AVAX) takes a breather above $14.00 at press time on Thursday after two consecutive days of recovery. Still, a largely sideways trend in AVAX futures Open Interest (OI) below the $600 million mark reflects an overall risk-off sentiment among investors.
- Avalanche holds steady after exceeding a local resistance trendline with an 8% rise on Wednesday.
- AVAX futures Open Interest fluctuates near $600 million, reflecting lukewarm retail interest.
- The technical outlook indicates a bullish tilt as selling pressure wanes.
Avalanche (AVAX) takes a breather above $14.00 at press time on Thursday after two consecutive days of recovery. Still, a largely sideways trend in AVAX futures Open Interest (OI) below the $600 million mark reflects an overall risk-off sentiment among investors.
The technical outlook for AVAX indicates a bullish tilt, as indicators suggest a shift in momentum amid a breakout of a resistance trendline.
Avalanche lacks retail interest
Avalanche is struggling to regain retail interest after the October 10 crash, which dropped the AVAX futures Open Interest (OI) to $645.54 million from $1.45 billion. At the time of writing, AVAX OI stands at $592.81 million, up from $562.17 million on the previous day, suggesting a persistent wait-and-see approach among investors. However, the Bitwise Avalanche Exchange Traded Fund (ETF) in the pipeline could boost demand for AVAX if the US Securities and Exchange Commission (SEC) approves it.
Technical outlook: Will AVAX extend the breakout rally?
Avalanche exceeds a local resistance trendline formed by connecting the highs of October 13 and November 11 on the daily chart after two consecutive days of recovery. If AVAX extends recovery above Friday’s high at $14.77, it could aim for the 50-day Exponential Moving Average (EMA) at $17.14.
According to the Supertrend Indicator, if the recovery crosses above $15.89, it could confirm a renewed bullish trend.
The Relative Strength Index (RSI) is at 46 on the daily chart, extending the rebound from the oversold zone as selling pressure wanes. Furthermore, a steady rise in RSI during the formation of the double bottom pattern at the November 21 low at $12.57 signals a bullish divergence.
At the same time, the Moving Average Convergence Divergence (MACD) indicator shows the red and blue lines moving upward toward the zero line, with green histogram bars. This indicates a persistent rise in bullish momentum against prevailing bearish pressure.
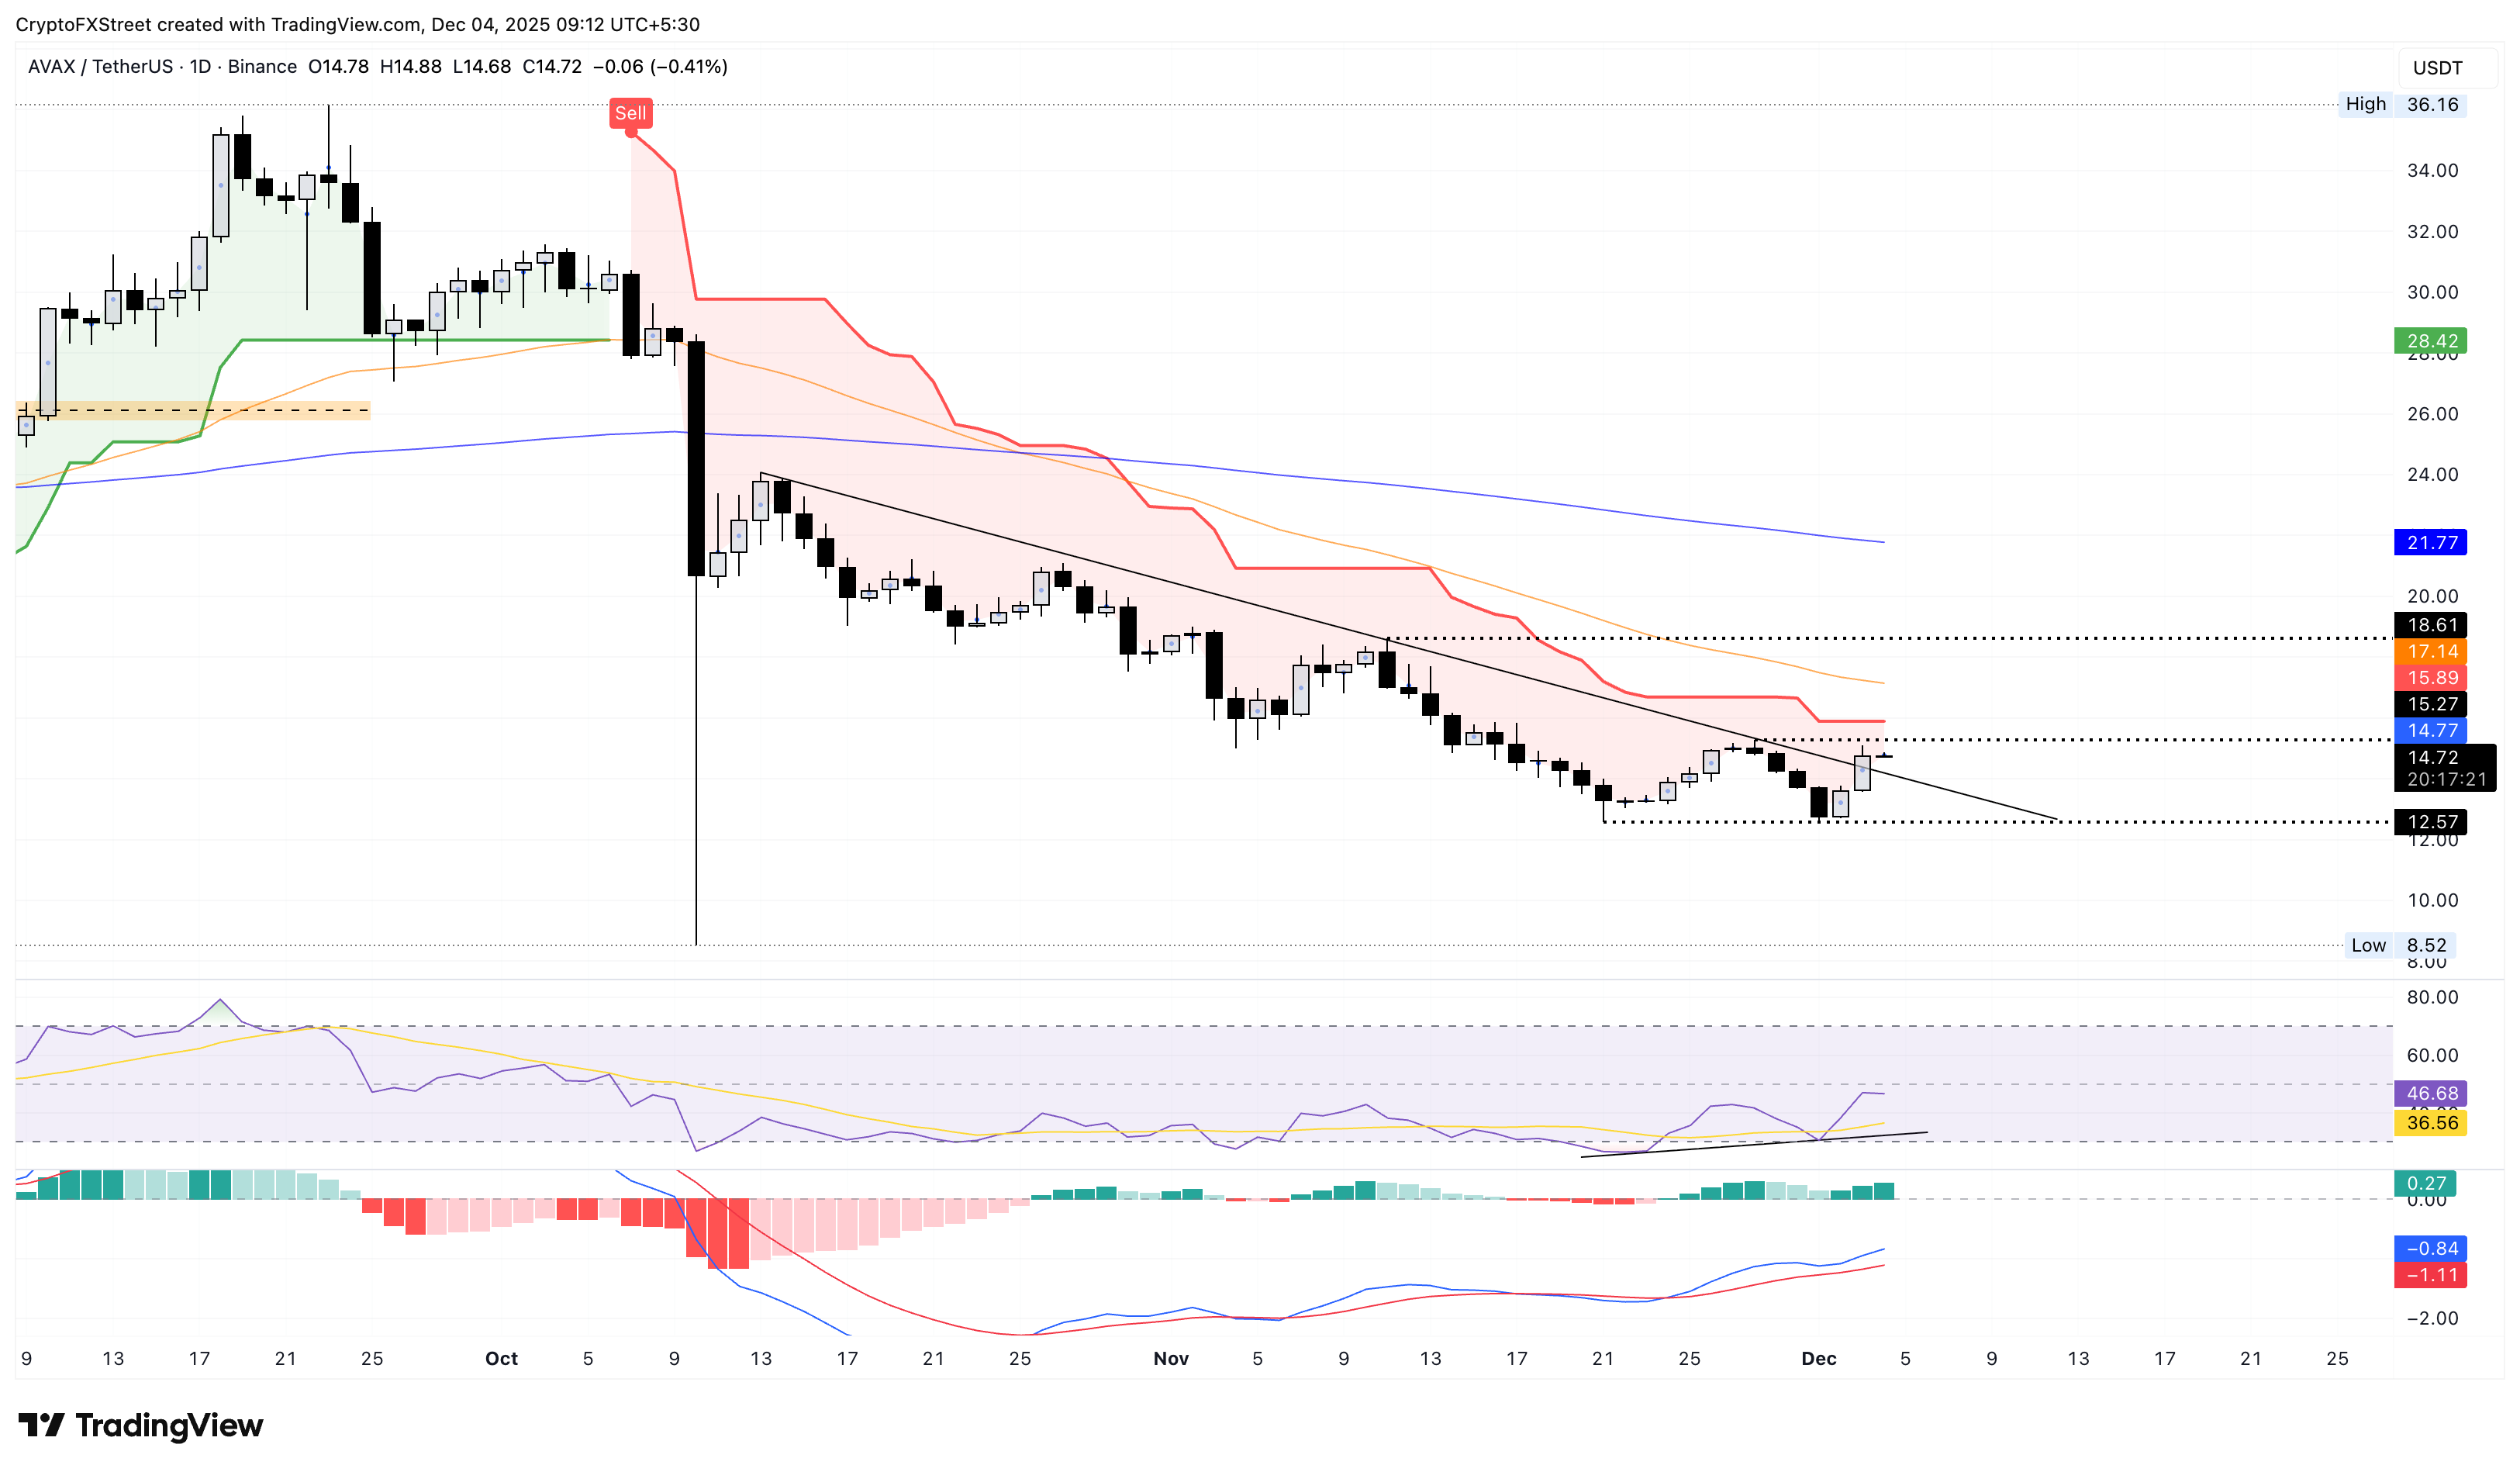
On the downside, if AVAX fails to cross above $14.77, it could decline to the November 21 low of $12.57.

يعتمد أكثر من مليون مستخدم على FXStreet للحصول على بيانات سوقية لحظية، وأدوات رسوم بيانية، ورؤى خبراء، وأخبار الفوركس. يساعد تقويمهم الاقتصادي الشامل والندوات التعليمية عبر الويب المتداولين على البقاء على اطلاع واتخاذ قرارات محسوبة. لدى FXStreet فريق يضم حوالي 60 محترفًا موزعين بين مقر برشلونة ومناطق عالمية مختلفة.
اقرأ المزيد


