
Trade The World
Cardano Price Forecast: ADA correction deepens as profit-taking activity increases
بواسطة Manish Chhetri
تاريخ النشر: 10 Oct 2025 | تاريخ التعديل: 10 Oct 2025


POPULAR ARTICLES

Cardano (ADA) price steadies at around $0.81 at the time of writing on Friday after falling more than 3% so far this week. On-chain and derivatives data further hint at a correction as profit-taking rises while bearish bets reach the highest level among ADA traders.
- Cardano price steadies around $0.81 on Friday after falling more than 3% so far this week.
- Metrics support further correction as profit-taking activity rises and bearish bets reach the highest monthly level.
- The technical analysis paints a bearish trend as indicators show signs of weakening momentum.
Cardano (ADA) price steadies at around $0.81 at the time of writing on Friday after falling more than 3% so far this week. On-chain and derivatives data further hint at a correction as profit-taking rises while bearish bets reach the highest level among ADA traders. Adding to this, the technical outlook suggests a downward trend on the horizon as indicators show signs of weakening momentum.
Profit-taking activity and bearish bets reach the highest monthly level
Santiment's Network Realized Profit/Loss (NPL) metric indicates that Cardano holders are booking some profits this week.
As shown in the chart below, the metric experienced a strong spike on Thursday, reaching its highest level since September 23. This spike indicates that holders are, on average, selling their bags at a significant profit, thereby increasing the selling pressure.
 [08-1760069792308-1760069792310.41.06, 10 Oct, 2025].png)
ADA NPL chart. Source: Santiment
On the derivatives side, CoinGlass’s ADA long-to-short ratio, which stands at 0.81 on Friday, is the highest level over a month. This ratio, below one, reflects bearish sentiment in the markets, as more traders are betting on the asset price to fall.
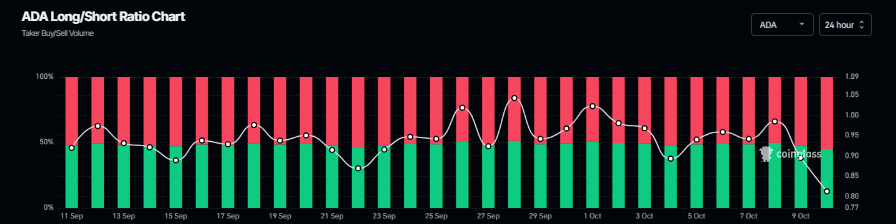
Cardano long-to-short chart. Source: CoinGlass
Cardano Price Forecast: ADA shows weakness in momentum
Cardano price failed to find support around the daily support level at $0.84 on Tuesday and corrected nearly 6%, closing below the 61.8% Fibonacci retracement level at $0.82. On Wednesday, ADA recovered slightly but faced rejection from the daily level the next day. At the time of writing on Friday, it trades at around $0.81.
If ADA continues its pullback, breaks and closes below the ascending trendline, it could extend the correction toward the next daily support at $0.70.
The Relative Strength Index (RSI) on the daily chart reads 45, which is below the neutral level of 50, indicating that bearish momentum is gaining traction. The Moving Average Convergence Divergence (MACD) lines flipped a bearish crossover on Thursday, giving sell signals and suggesting the start of a downward trend ahead.
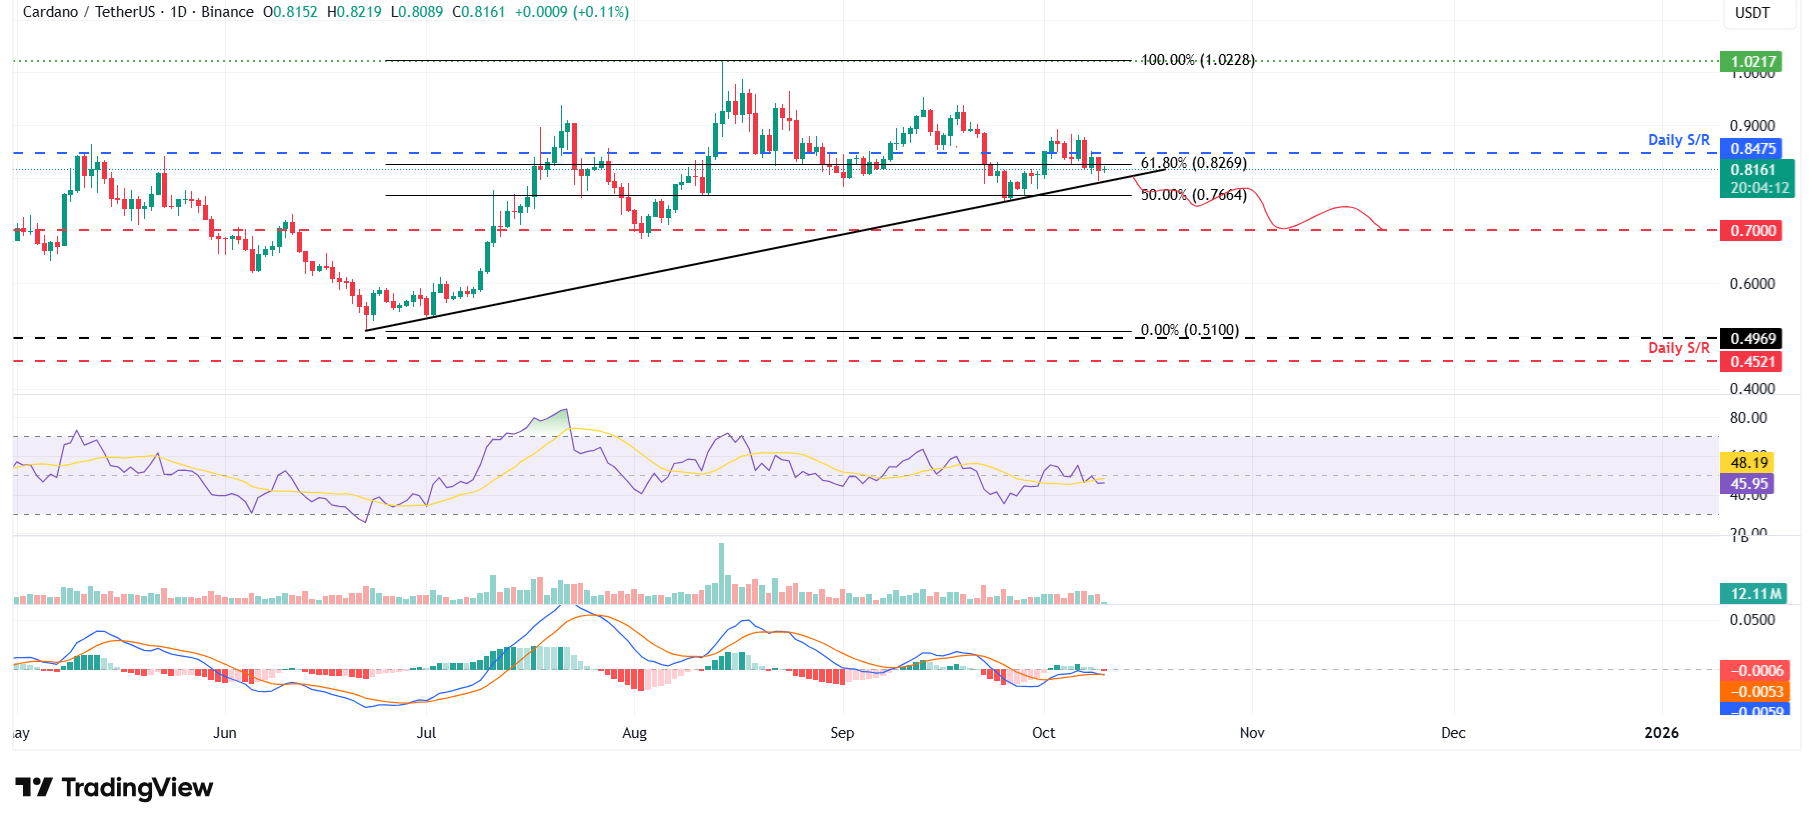
ADA/USDT daily chart
However, if ADA recovers, closes above the daily level at $0.84 and holds, it could extend the rally toward the psychological level at $1.

FXStreet
يعتمد أكثر من مليون مستخدم على FXStreet للحصول على بيانات سوقية لحظية، وأدوات رسوم بيانية، ورؤى خبراء، وأخبار الفوركس. يساعد تقويمهم الاقتصادي الشامل والندوات التعليمية عبر الويب المتداولين على البقاء على اطلاع واتخاذ قرارات محسوبة. لدى FXStreet فريق يضم حوالي 60 محترفًا موزعين بين مقر برشلونة ومناطق عالمية مختلفة.
Read More


