
Trade The World
Chainlink Price Forecast: LINK eyes upside as holders accumulate amid industry milestone
بواسطة Manish Chhetri
تاريخ النشر: 30 Sep 2025 | تاريخ التعديل: 30 Sep 2025


POPULAR ARTICLES

Chainlink (LINK) hovers around $21.50 at the time of writing on Tuesday after an 8% recovery since Friday. The momentum follows a major industry milestone, where LINK partnered with 24 leading financial institutions to streamline corporate actions using its oracle and blockchain technology.
- Chainlink’s price hovers around $21.50 on Tuesday, having recovered nearly 8% since Friday.
- LINK announced a major industry milestone in a global corporate actions initiative, collaborating with 24 of the world’s largest financial organizations.
- On-chain and derivatives back a rally as holders accumulate LINK tokens.
Chainlink (LINK) hovers around $21.50 at the time of writing on Tuesday after an 8% recovery since Friday. The momentum follows a major industry milestone, where LINK partnered with 24 leading financial institutions to streamline corporate actions using its oracle and blockchain technology. Additionally, bullish on-chain signals and a positive funding rate suggest that LINK could be positioned for further upside as holders continue to accumulate.
Chainlink’s growing industry adoption
Chainlink announced on Monday the results of the second phase of an industry initiative to standardize and streamline corporate actions processing using a combination of the Chainlink oracle platform, blockchain technology, and artificial intelligence (AI).
LINK has expanded to 24 global organizations, including some of the world’s largest financial and market infrastructures, such as DTCC, Swift, and Euroclear, as well as leading financial institutions, including UBS, DBS Bank, BNP Paribas’ Securities Services business, ANZ, Wellington Management, and Schroders.
Chainlink’s Sergey Nazarov emphasized in the press release that solving corporate action data validation “is a big leap forward.” Corporate actions processing costs the global financial industry an estimated $58 billion annually, with costs increasing by 10% year-over-year and automation rates falling below 40%.
At the same time, other leaders from DTCC, Euroclear, BNP Paribas, ANZ, and others noted its impact on efficiency, operational risk reduction, and scaling tokenized assets.
These growing developments and partnerships underscore Chainlink’s enhanced real-world utility, increased institutional credibility, and broader adoption, which support a bullish outlook for its native token in the long term.
Large holders accumulate, Funding Rate turns positive, boosting bullish sentiment
Santiment’s Supply Distribution data supports a bullish outlook for Chainlink, as the number of large-wallet holders (whales) is increasing.
The metric indicates that whales holding between 1 million and 10 million LINK tokens (yellow line) have accumulated 3.7 million tokens from September 24 to Tuesday. During the same period, wallets holding between 100,000 and 1 million LINK tokens (red line) have shed 3.38 million tokens.
This shows that the second cohort of whales could have fallen prey to the capitulation event. In contrast, the first set of wallets seized the opportunity and accumulated Chainlink at a discount.
 [09-1759207848737-1759207848739.04.32, 30 Sep, 2025].png)
Chainlink supply distribution chart. Source: Santiment
Apart from the holders accumulating, Coinglass’s OI-Weighted Funding Rate data shows that the number of traders betting that the price of LINK will slide further is lower than that anticipating a price increase. Generally, a positive rate (longs pay shorts) indicates bullish sentiment, while negative numbers (shorts pay longs) indicate bearishness.
The metric has flipped a positive rate and reads 0.0075% on Tuesday, indicating that longs are paying shorts. Historically, as shown in the chart below, when the funding rates have flipped from negative to positive, the Chainlink price has rallied sharply.
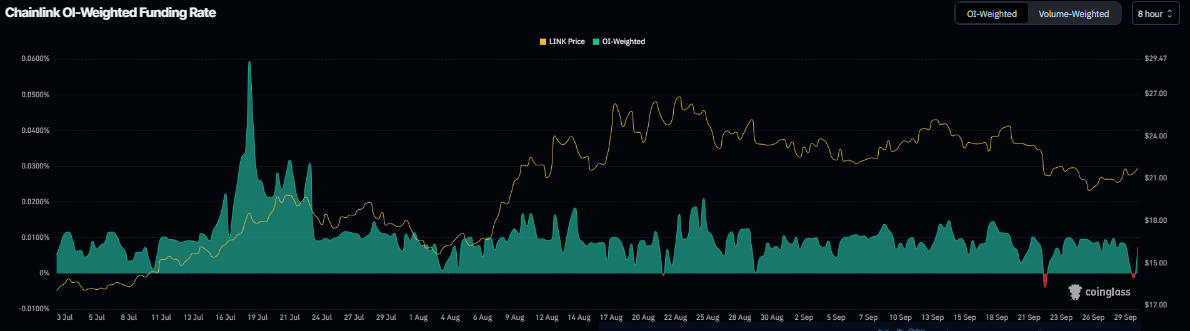
Chainlink funding rate chart. Source: Coinglass
Chainlink Price Forecast: LINK could rally higher if it closes above $22.05
Chainlink price retested and found support around the ascending trendline (drawn by connecting multiple lows since early July) on Friday and rose 9% by Monday. This trendline roughly coincides with the 50% Fibonacci retracement level at $20.29, making this a key support zone. At the time of writing on Tuesday, it trades at around $21.50.
If LINK continues its upward trend and closes above the daily resistance at $22.05, it could extend the rally toward the next daily resistance at $26.37.
The Relative Strength Index (RSI) on the daily chart reads 44, nearing its neutral level of 50, which indicates a fading bearish momentum. For the recovery rally to be sustained, the RSI must move above the neutral level.
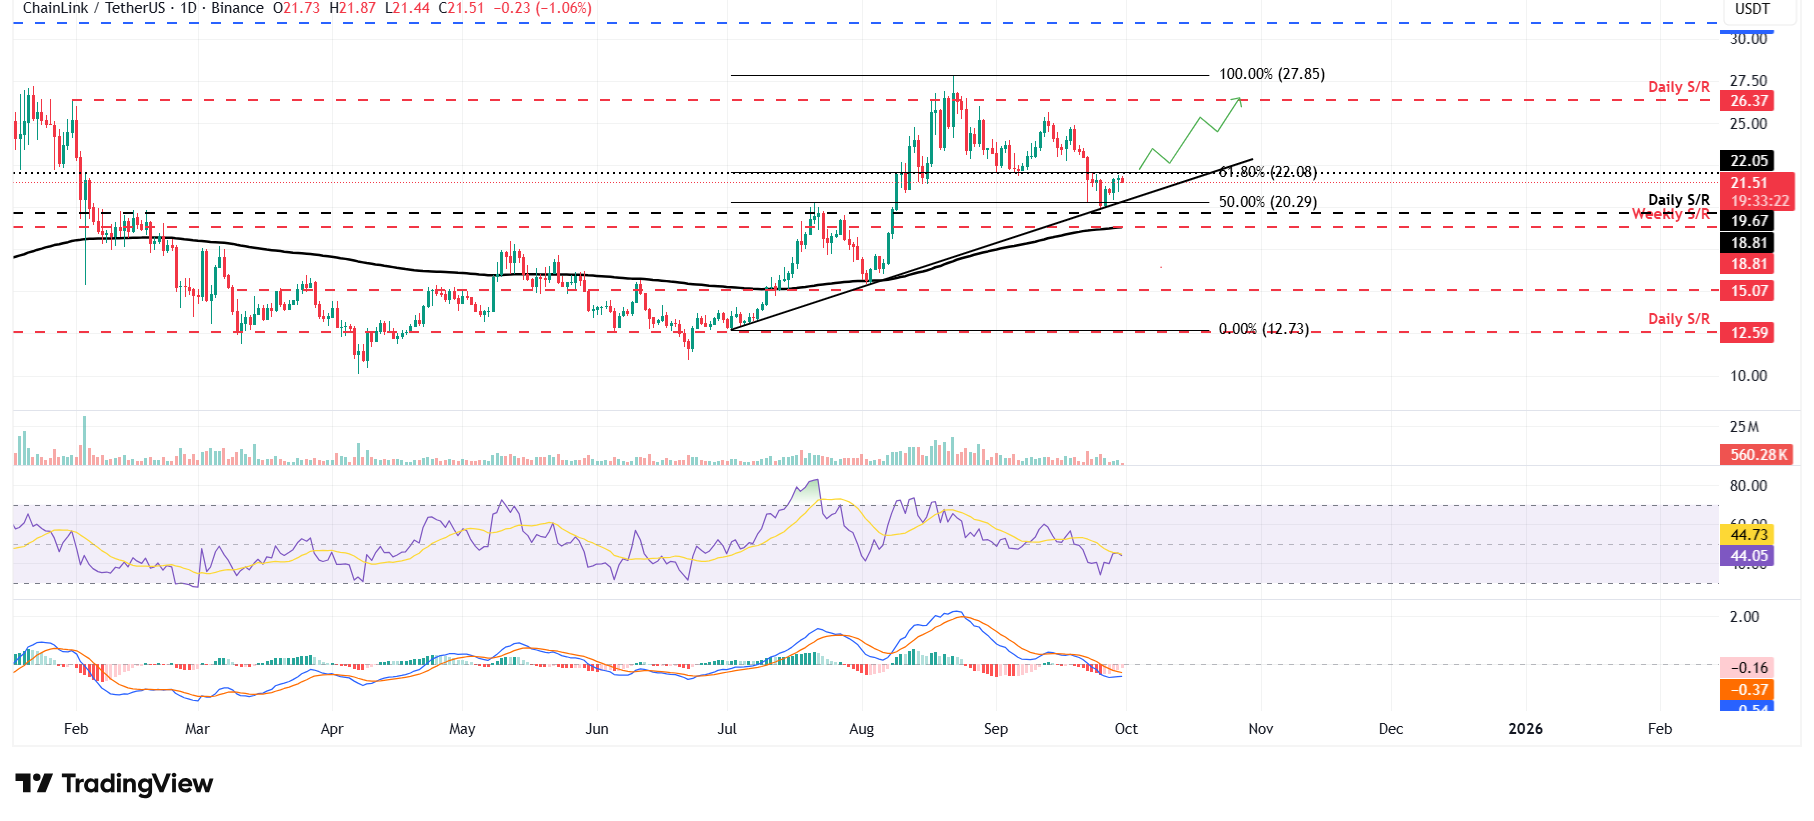
LINK/USDT daily chart
However, if LINK faces a correction, it could extend the decline toward the daily support at $19.67.

FXStreet
يعتمد أكثر من مليون مستخدم على FXStreet للحصول على بيانات سوقية لحظية، وأدوات رسوم بيانية، ورؤى خبراء، وأخبار الفوركس. يساعد تقويمهم الاقتصادي الشامل والندوات التعليمية عبر الويب المتداولين على البقاء على اطلاع واتخاذ قرارات محسوبة. لدى FXStreet فريق يضم حوالي 60 محترفًا موزعين بين مقر برشلونة ومناطق عالمية مختلفة.
Read More


