
Trade The World
EUR/USD Price Forecast: Could test 1.1750 amid strengthening bullish bias
بواسطة Akhtar Faruqui
تاريخ النشر: 18 Dec 2025 | تاريخ التعديل: 18 Dec 2025


POPULAR ARTICLES

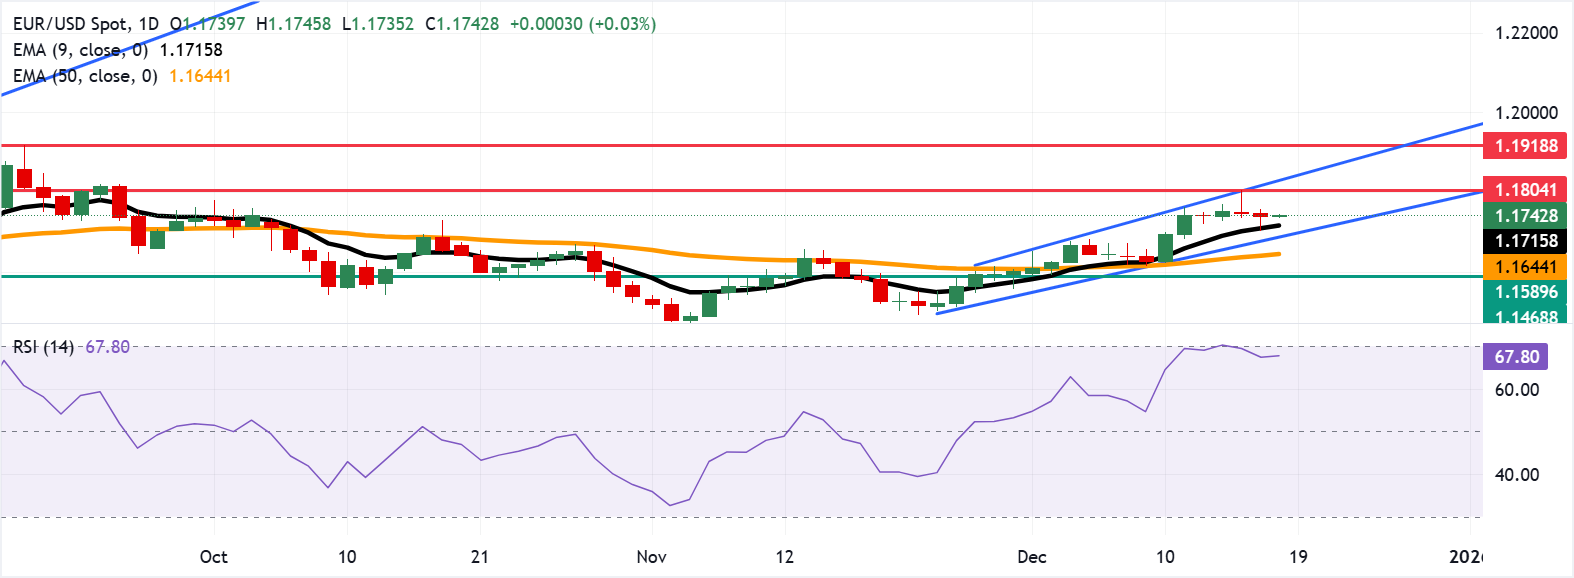
EUR/USD remains flat after two days of small losses, trading around 1.1740 during the Asian hours on Thursday. On the daily chart, technical analysis indicates a strengthening of a bullish bias, as the pair continues to trade within an ascending channel pattern.
- EUR/USD may approach the two-month high of 1.1804.
- The 14-day Relative Strength Index stands at 67.47, indicating strong upside momentum.
- The primary support lies at the nine-day EMA of 1.1715.
EUR/USD remains flat after two days of small losses, trading around 1.1740 during the Asian hours on Thursday. On the daily chart, technical analysis indicates a strengthening of a bullish bias, as the pair continues to trade within an ascending channel pattern.
The EUR/USD pair holds above the rising nine- and 50-day Exponential Moving Averages (EMAs), reinforcing a bullish bias. The nine-day EMA stands above the 50-day, and both slopes are higher.
The 14-day Relative Strength Index (RSI) prints 67.47, near overbought, signaling strong upside momentum. A break above 70 mark would indicate a downward correction in a short period.
The EUR/USD pair could target the two-month high of 1.1804, reached on December 16, followed by the upper boundary of the ascending channel around 1.1820. A daily close above the first barrier could extend gains toward the upper level, while failure to clear it would keep pullbacks contained toward the short-term average. A break above the confluence resistance zone would support the pair to explore the region around 1.1918, the highest since June 2021.
The immediate support lies at the nine-day EMA of 1.1715, followed by a psychological level of 1.1700 and the lower ascending channel boundary around 1.1690. A break below this support area would weaken the short-term price momentum and put downward pressure on the EUR/USD pair to test the 50-day EMA at 1.1644, followed by the three-week low of 1.1589, which was recorded on December 1.
Euro Price Today
The table below shows the percentage change of Euro (EUR) against listed major currencies today. Euro was the strongest against the New Zealand Dollar.
| USD | EUR | GBP | JPY | CAD | AUD | NZD | CHF | |
|---|---|---|---|---|---|---|---|---|
| USD | -0.03% | 0.07% | 0.03% | -0.03% | 0.05% | 0.26% | -0.07% | |
| EUR | 0.03% | 0.10% | 0.05% | 0.00% | 0.09% | 0.29% | -0.04% | |
| GBP | -0.07% | -0.10% | -0.04% | -0.11% | -0.02% | 0.19% | -0.14% | |
| JPY | -0.03% | -0.05% | 0.04% | -0.06% | 0.02% | 0.20% | -0.10% | |
| CAD | 0.03% | -0.00% | 0.11% | 0.06% | 0.09% | 0.27% | -0.04% | |
| AUD | -0.05% | -0.09% | 0.02% | -0.02% | -0.09% | 0.20% | -0.12% | |
| NZD | -0.26% | -0.29% | -0.19% | -0.20% | -0.27% | -0.20% | -0.33% | |
| CHF | 0.07% | 0.04% | 0.14% | 0.10% | 0.04% | 0.12% | 0.33% |
The heat map shows percentage changes of major currencies against each other. The base currency is picked from the left column, while the quote currency is picked from the top row. For example, if you pick the Euro from the left column and move along the horizontal line to the US Dollar, the percentage change displayed in the box will represent EUR (base)/USD (quote).
(The technical analysis of this story was written with the help of an AI tool.)

FXStreet
يعتمد أكثر من مليون مستخدم على FXStreet للحصول على بيانات سوقية لحظية، وأدوات رسوم بيانية، ورؤى خبراء، وأخبار الفوركس. يساعد تقويمهم الاقتصادي الشامل والندوات التعليمية عبر الويب المتداولين على البقاء على اطلاع واتخاذ قرارات محسوبة. لدى FXStreet فريق يضم حوالي 60 محترفًا موزعين بين مقر برشلونة ومناطق عالمية مختلفة.
Read More


