
Hyperliquid Price Forecast: HYPE gains momentum amid staking, Open Interest rebound
بواسطة John Isige
تاريخ النشر: 14 Jan 2026 | تاريخ التعديل: 14 Jan 2026


المقالات الشائعة

Hyperliquid (HYPE) is showing renewed strength, trading above $26.00 at the time of writing on Wednesday, as bulls regain control following a period of consolidation. The rebound is largely supported by improving on-chain metrics and growing derivatives market activity.
- Hyperliquid extends its recovery as bulls position for a potential short-term breakout.
- HYPE’s staking balance increases by nearly 6% to $1.37 billion as recovery momentum builds.
- Retail demand is strengthening the Hyperliquid derivatives market, with Open Interest rising to $1.41 billion.
Hyperliquid (HYPE) is showing renewed strength, trading above $26.00 at the time of writing on Wednesday, as bulls regain control following a period of consolidation. The rebound is largely supported by improving on-chain metrics and growing derivatives market activity.
Hyperliquid’s DeFi growth fuels recovery optimism
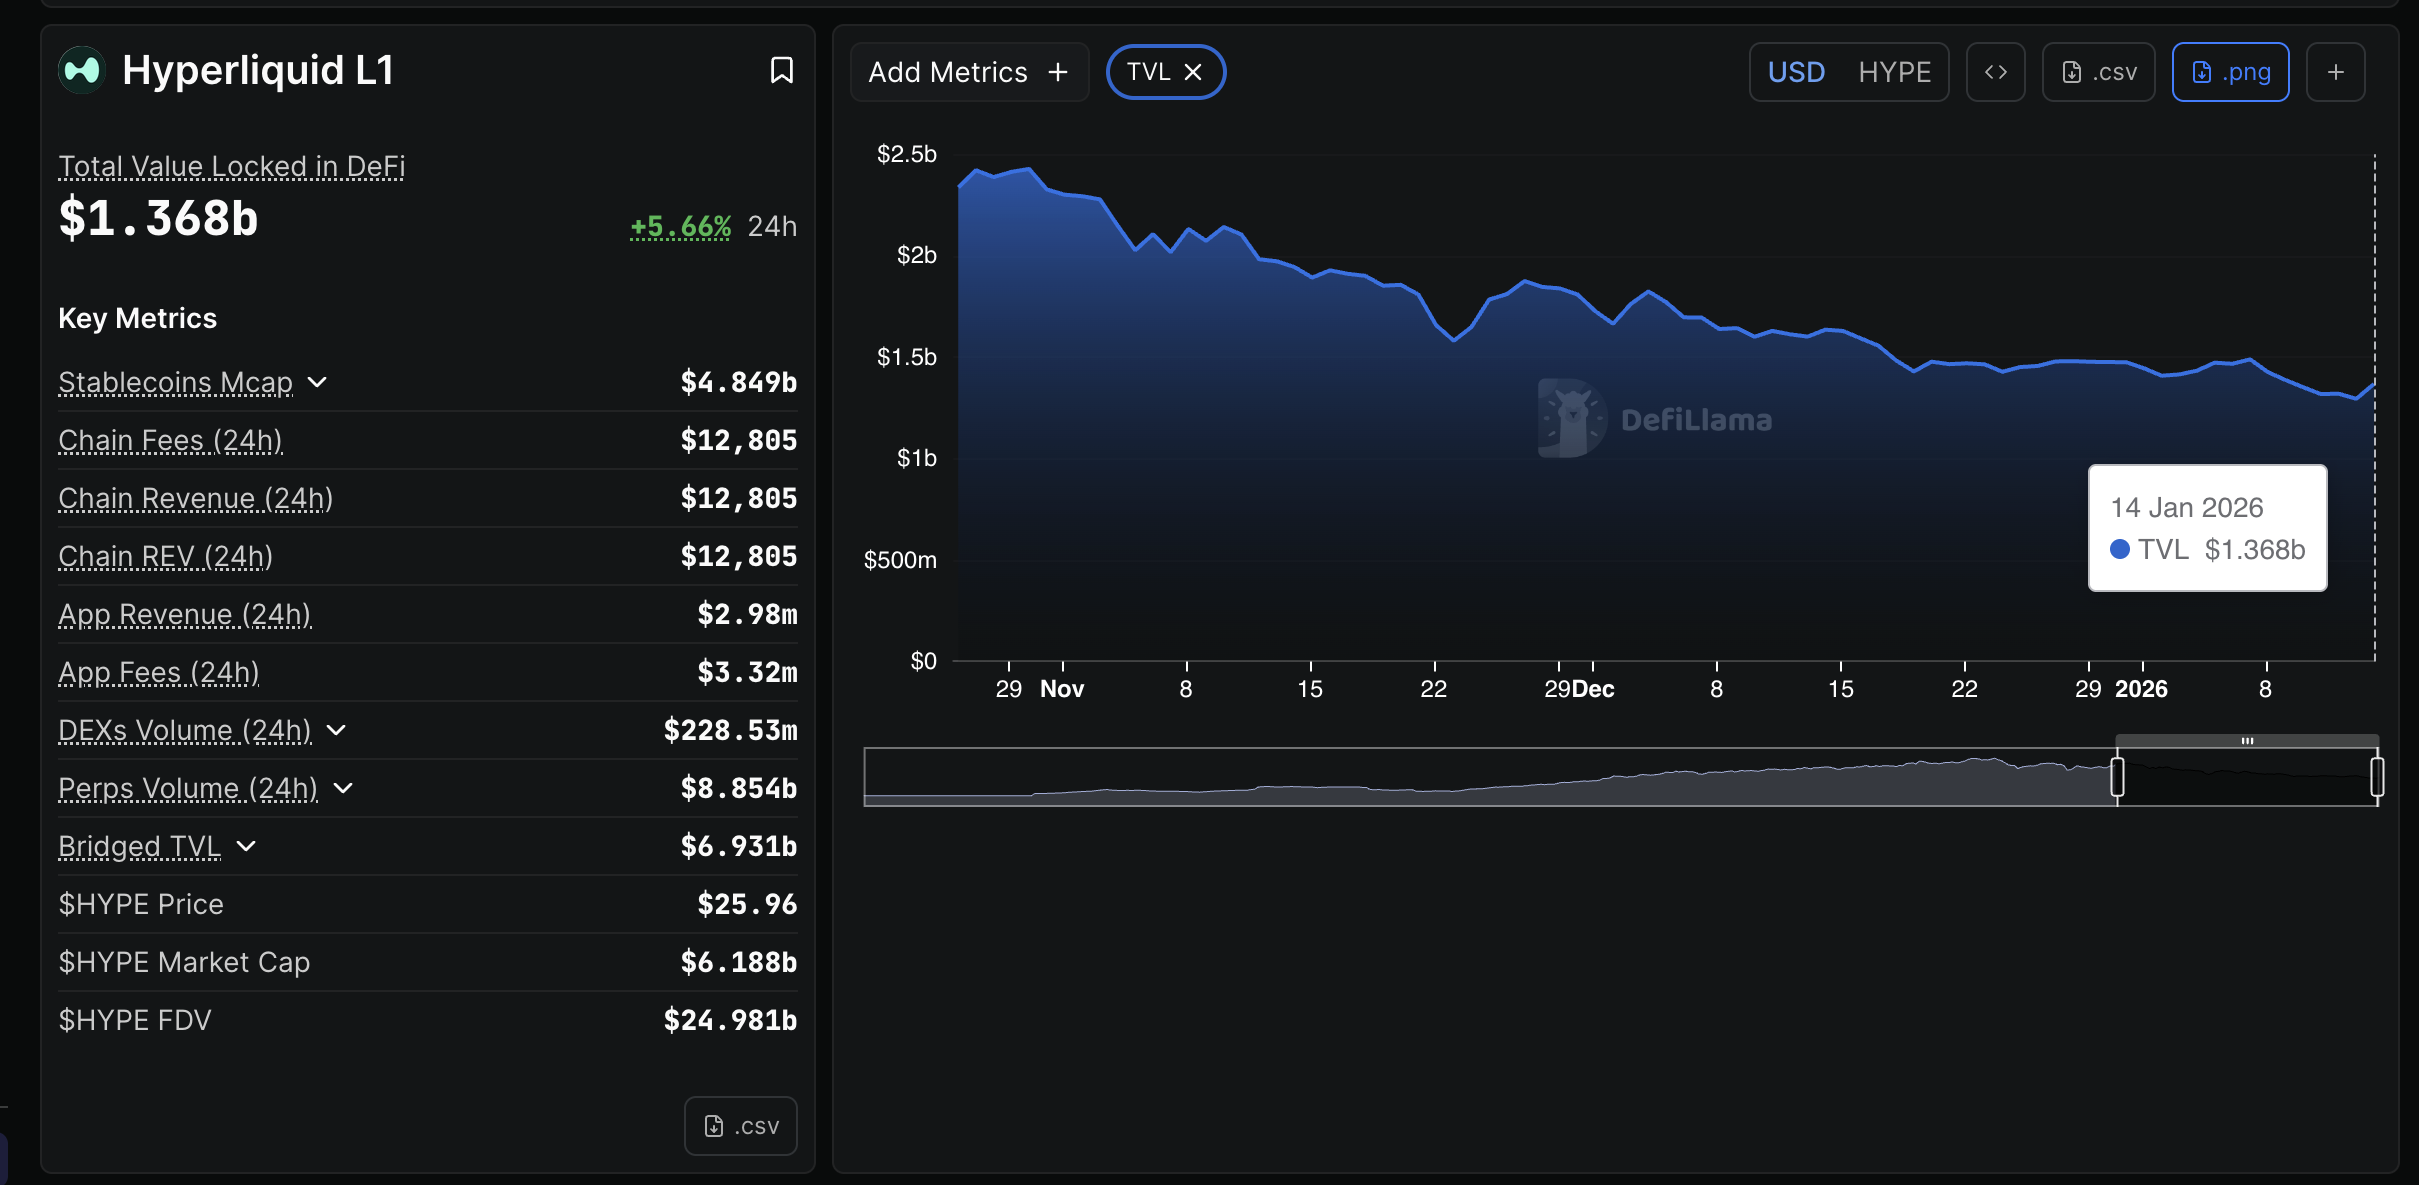
Hyperliquid staking activity has surged by nearly 6% to reach $1.37 billion on Wednesday, signaling increased confidence among long-term holders.
The surge marks a significant turnaround in the Total Value Locked (TVL) in the network’s Decentralized Finance (DeFi) ecosystem, which had declined to $1.3 billion as of Tuesday, down from a record high of $2.79 billion on September 19.
Investors lock their holdings in smart contracts when they intend to hold for the long term. Increasing staking balance often has a bullish effect on prices, as the available supply in the open market narrows.
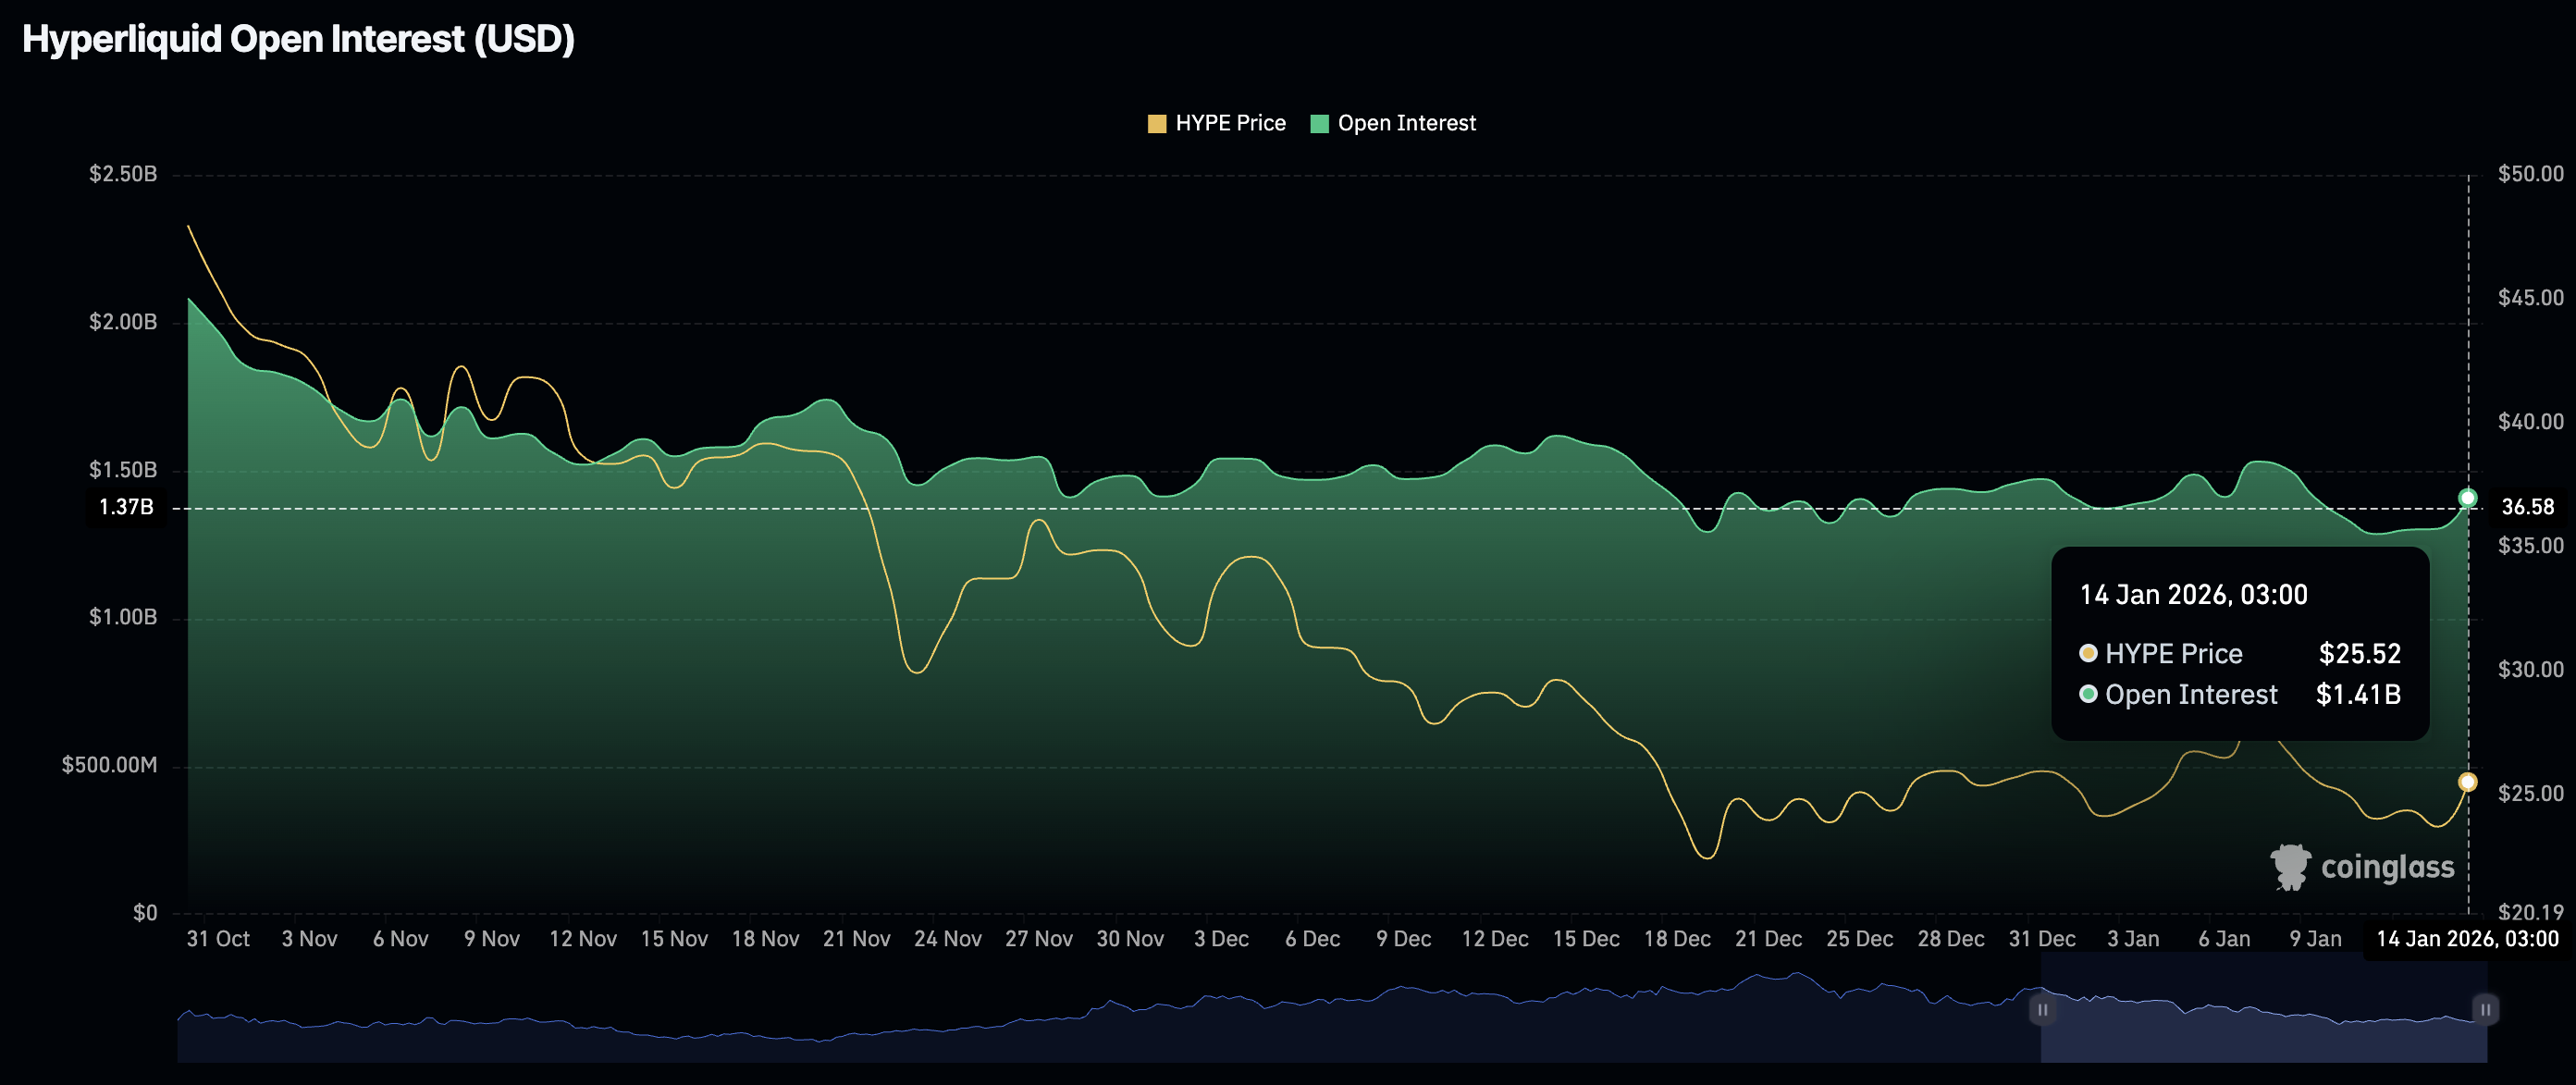
Meanwhile, the Hyperliquid derivatives market reflects investors’ optimism for a price recovery, with futures Open Interest (OI) rising to $1.41 billion on Wednesday from $1.3 billion on Tuesday.
The growth in OI, which represents the notional value of outstanding futures contracts, reflects the strengthening retail demand and trader positioning ahead of a potential short-term breakout.
Technical outlook: Hyperliquid poised for breakout
Hyperliquid is trading above $26.00 at the time of writing on Wednesday, reflecting positive sentiment in the broader cryptocurrency market. This rebound is supported by the Relative Strength Index (RSI), which is near the midline on the daily chart, suggesting a neutral-to-bullish transition.
The Moving Average Convergence Divergence (MACD) indicator on the daily chart is above the red signal line, suggesting traders should lean into risk. If the green histogram above the zero line continues to expand, HYPE will likely gain momentum for a breakout above the 50-day Exponential Moving Average (EMA) at $28.22.
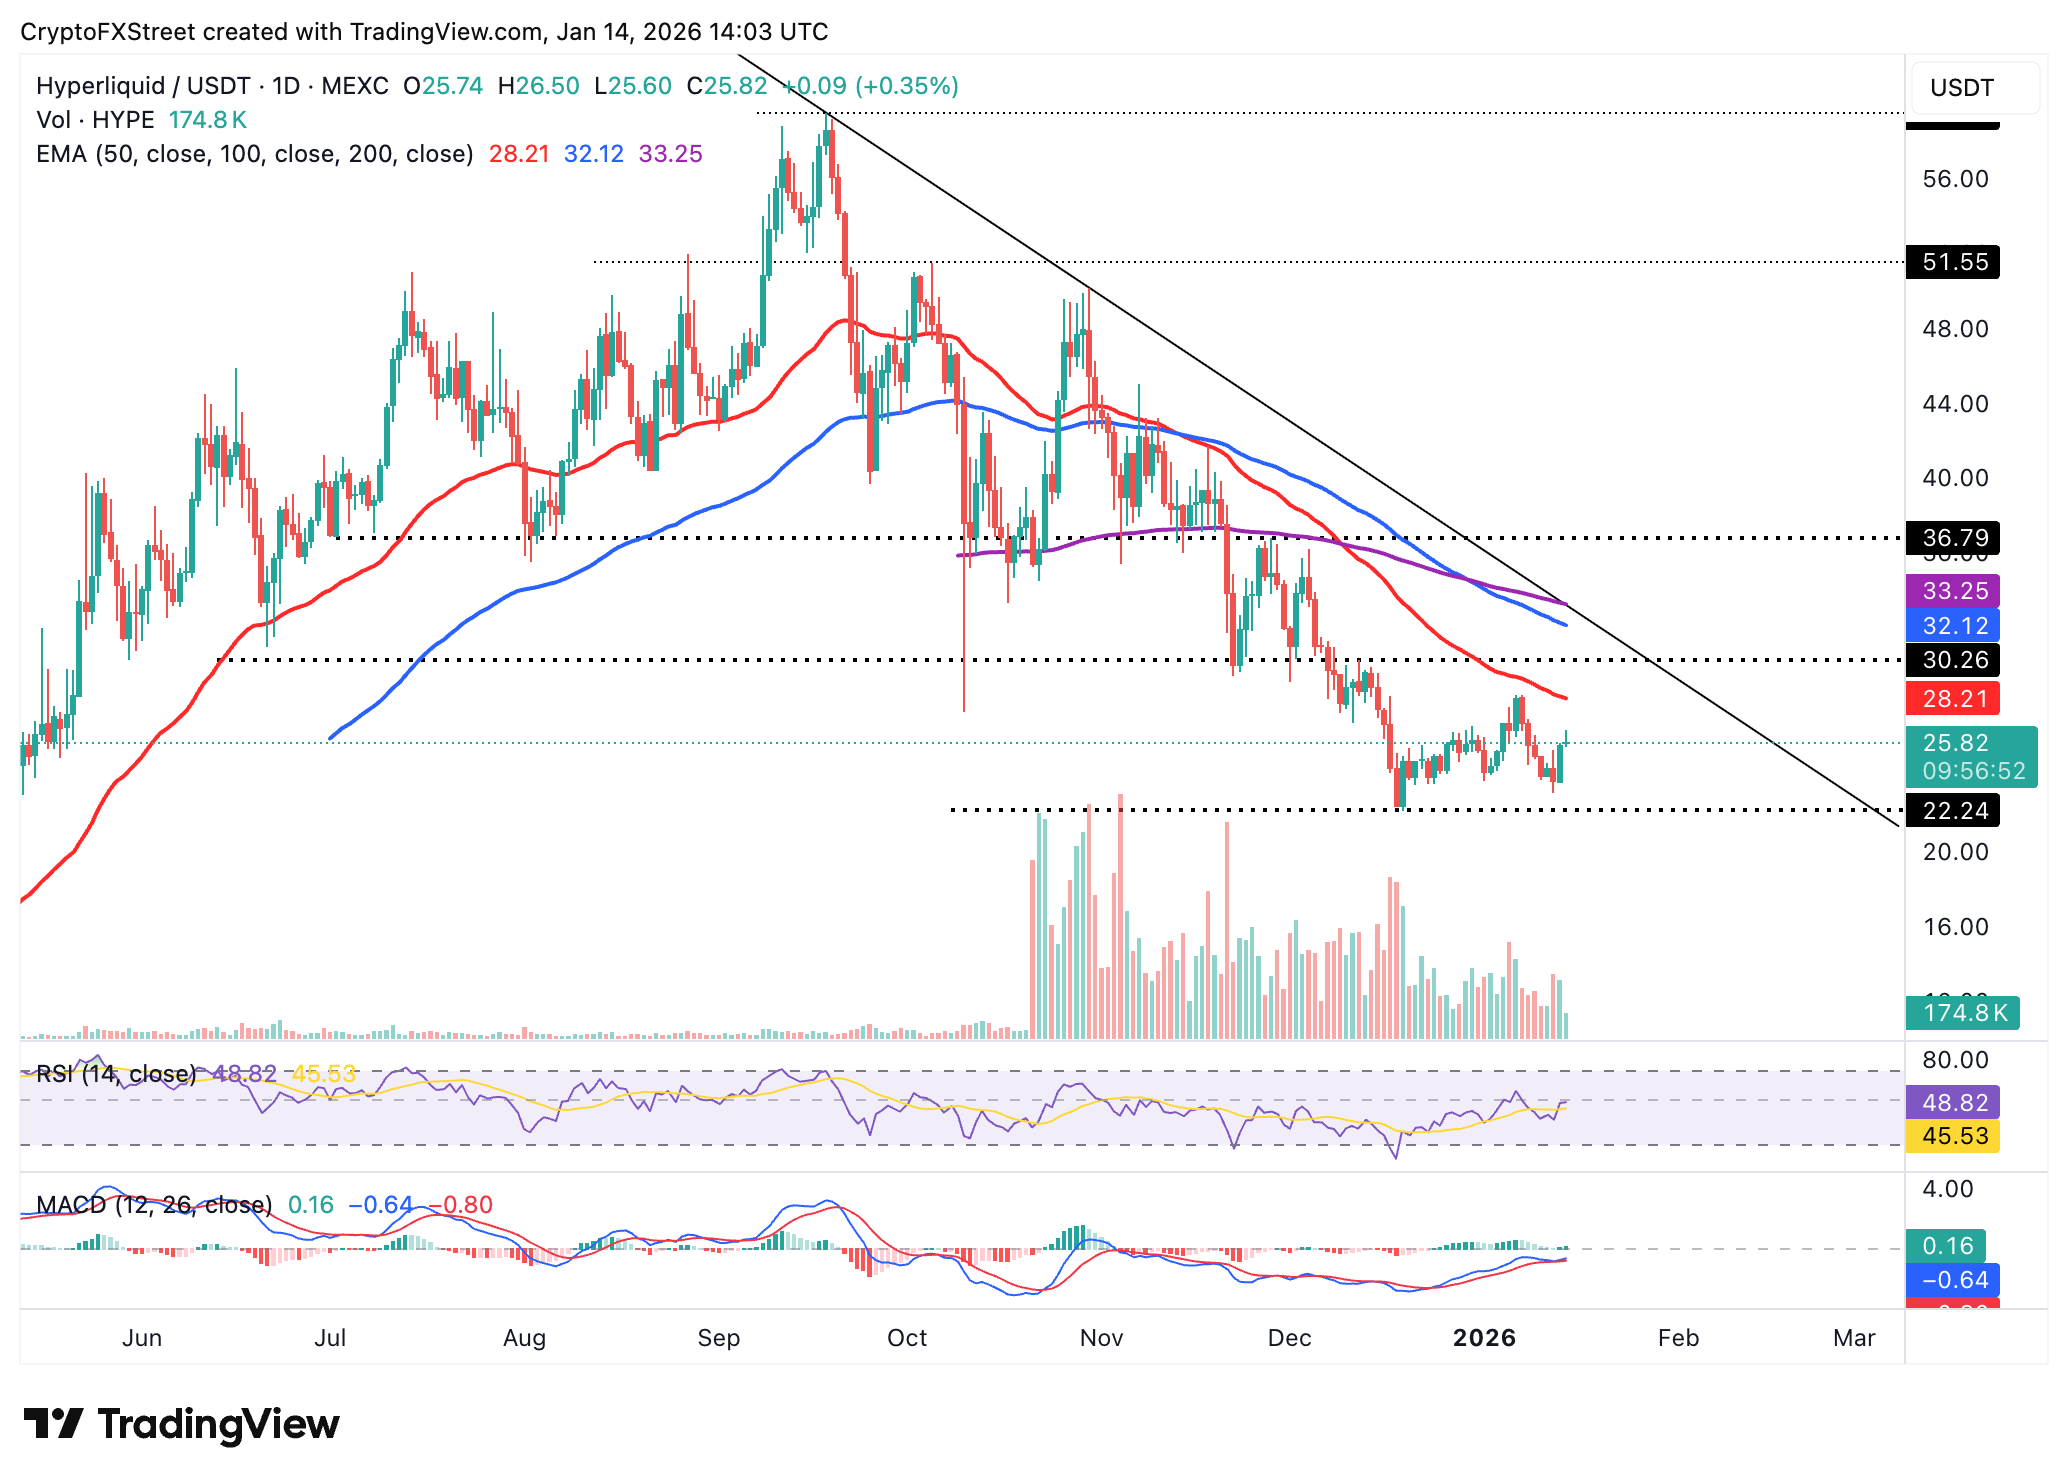
Still, three moving averages, including the 50-day EMA at $28.22, the 100-day EMA at $32.13 and the 200-day EMA at $33.25, are sloping downward, suggesting that the overall trend remains largely bearish. A close above this moving average cluster and the descending trendline would be required to confirm Hyperliquid’s transition from bearish to bullish.
Open Interest, funding rate FAQs
Higher Open Interest is associated with higher liquidity and new capital inflow to the market. This is considered the equivalent of increase in efficiency and the ongoing trend continues. When Open Interest decreases, it is considered a sign of liquidation in the market, investors are leaving and the overall demand for an asset is on a decline, fueling a bearish sentiment among investors.
Funding fees bridge the difference between spot prices and prices of futures contracts of an asset by increasing liquidation risks faced by traders. A consistently high and positive funding rate implies there is a bullish sentiment among market participants and there is an expectation of a price hike. A consistently negative funding rate for an asset implies a bearish sentiment, indicating that traders expect the cryptocurrency’s price to fall and a bearish trend reversal is likely to occur.

يعتمد أكثر من مليون مستخدم على FXStreet للحصول على بيانات سوقية لحظية، وأدوات رسوم بيانية، ورؤى خبراء، وأخبار الفوركس. يساعد تقويمهم الاقتصادي الشامل والندوات التعليمية عبر الويب المتداولين على البقاء على اطلاع واتخاذ قرارات محسوبة. لدى FXStreet فريق يضم حوالي 60 محترفًا موزعين بين مقر برشلونة ومناطق عالمية مختلفة.
اقرأ المزيد


