
Litecoin Price Forecast: LTC whale and derivatives activity rises amid weak price action
بواسطة Michael Ebiekutan
تاريخ النشر: 15 Jan 2026 | تاريخ التعديل: 15 Jan 2026


المقالات الشائعة

Litecoin (LTC) has seen a surge in whale activity and derivatives interest over the past three days, despite subdued prices.
- Litecoin whale activity has reached a five-week high over the past three days.
- Litecoin open interest also surged to 8.25 million LTC on Wednesday, its highest level since the October 10 leverage flush.
- LTC faces rejection at the 20-day EMA after a brief rise.
Litecoin (LTC) has seen a surge in whale activity and derivatives interest over the past three days, despite subdued prices.
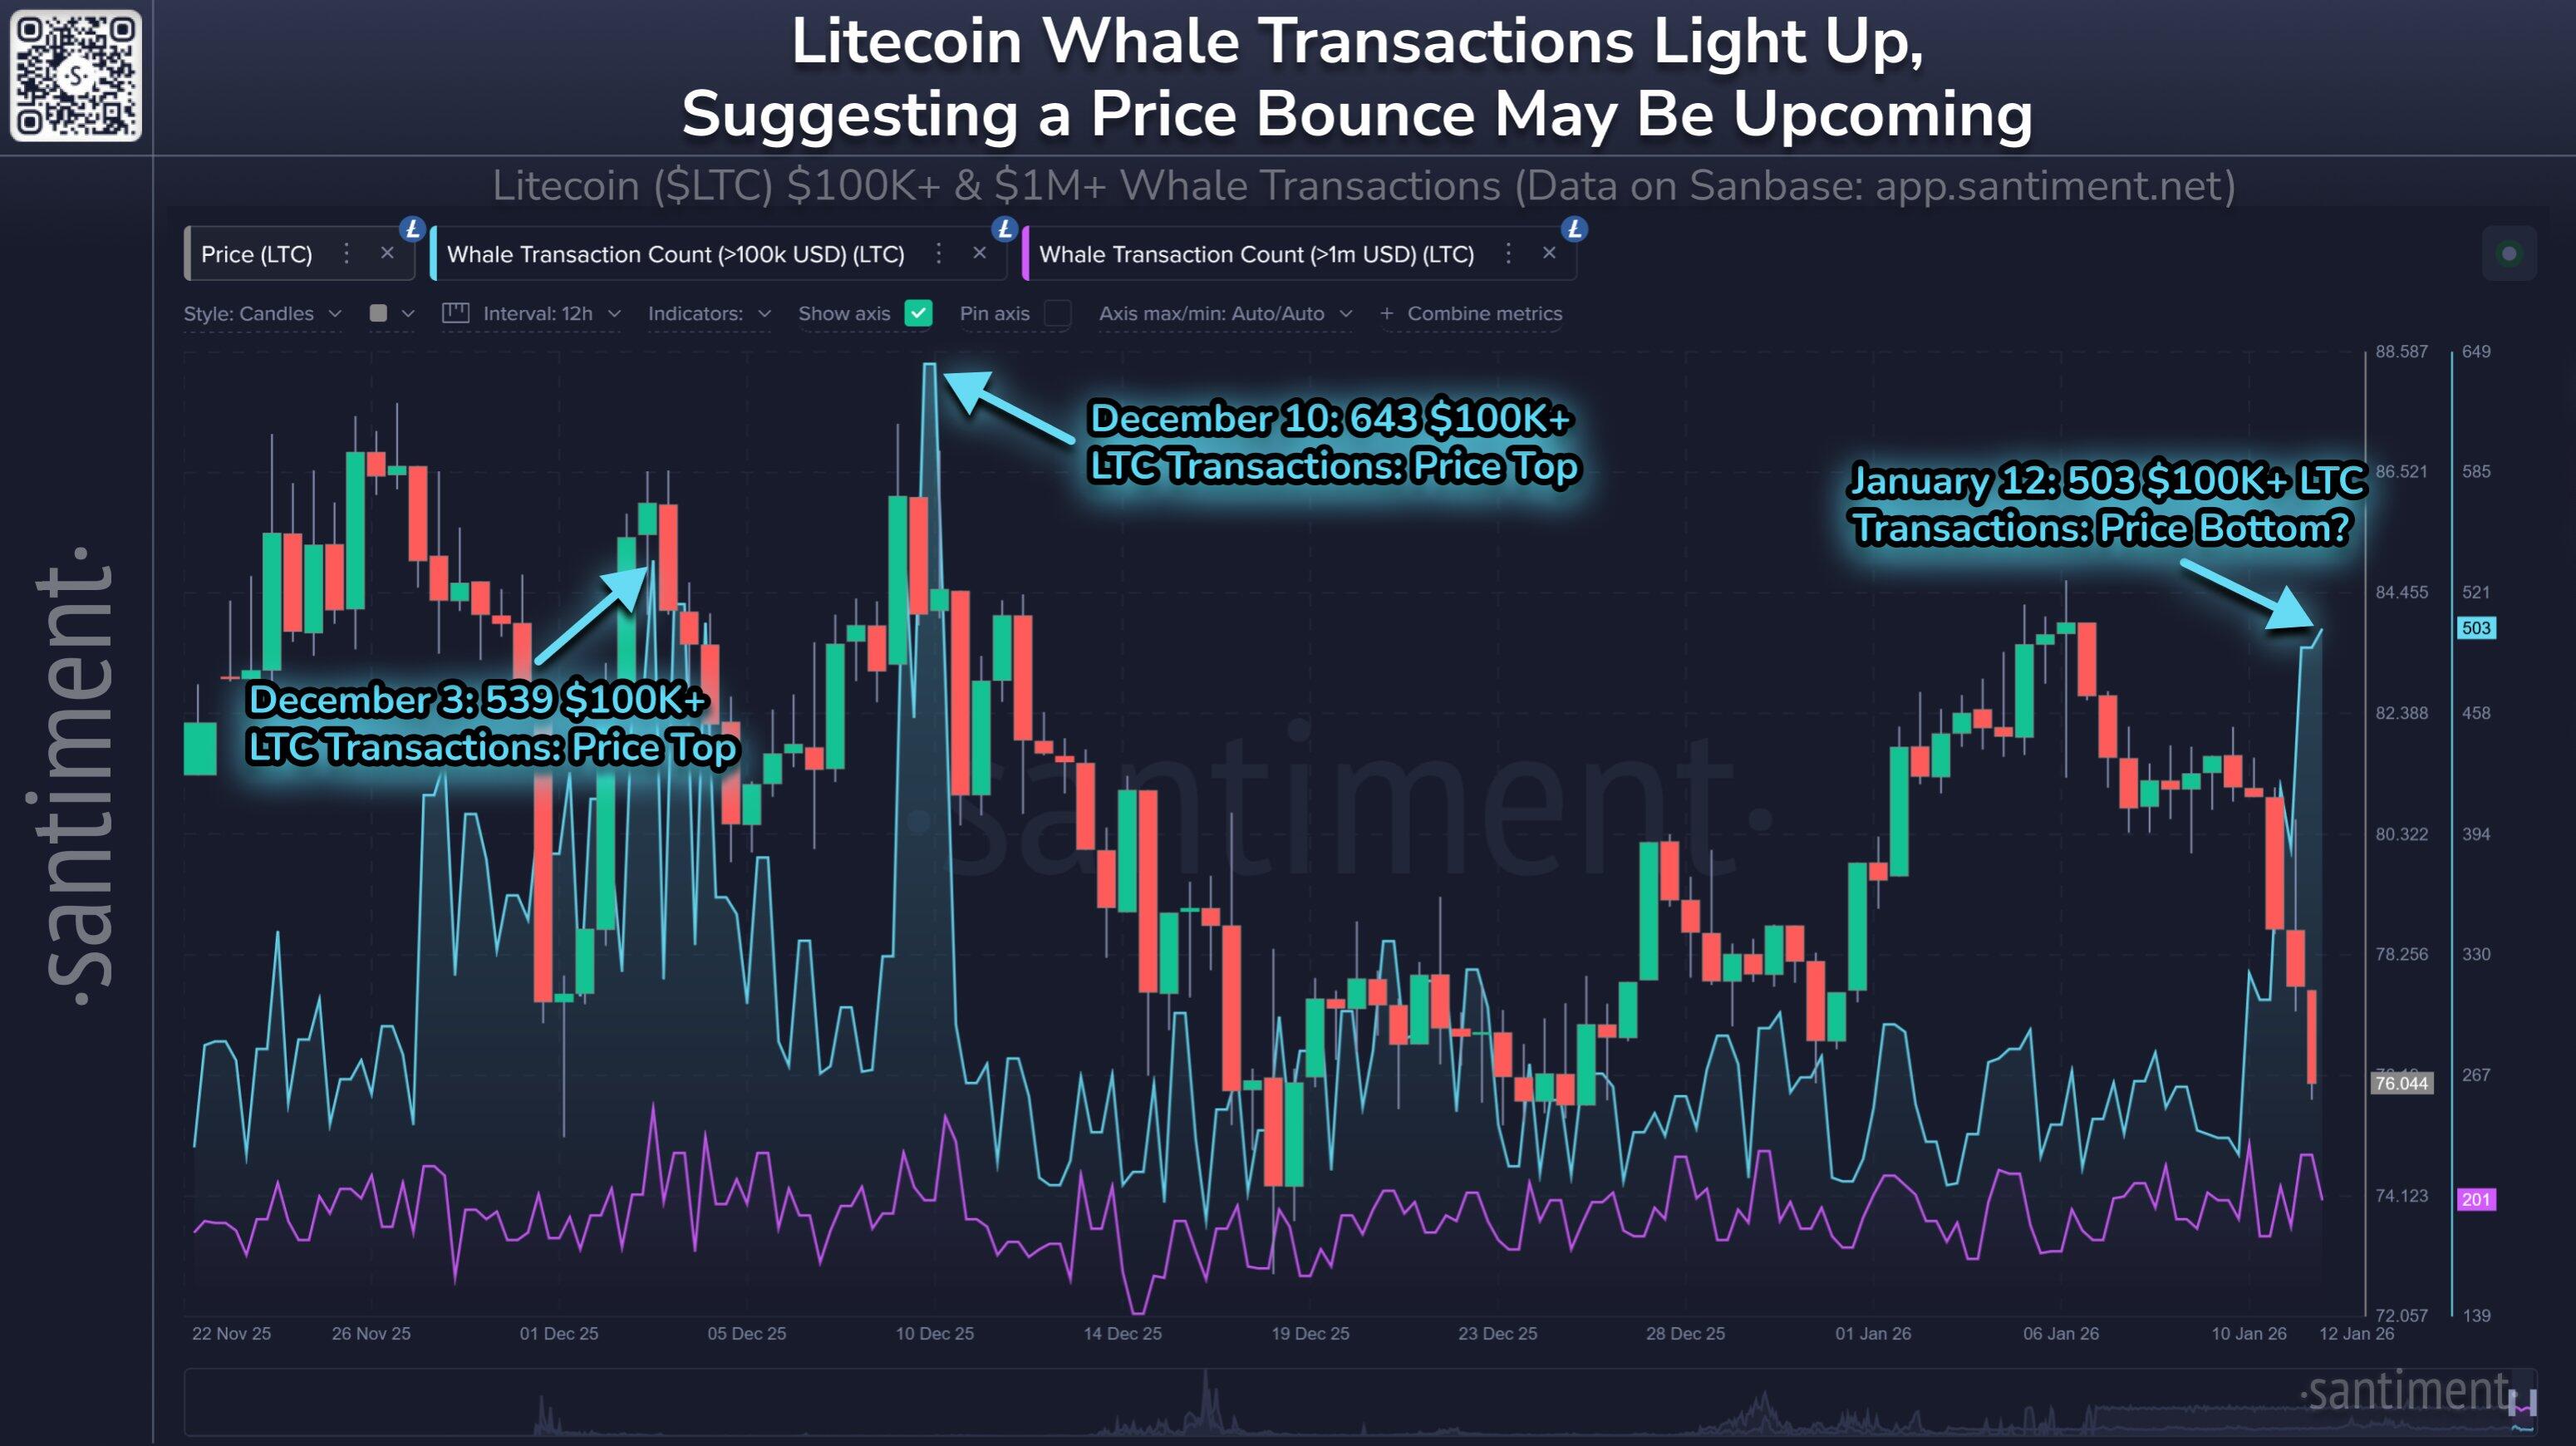
Whale transactions (>$100K) have risen consistently over the past three days, reaching a five-week high. In contrast to the current move, LTC's price was higher the last time whale activity reached these levels.
"Historically, an asset has a significantly higher likelihood of reversal on whale spikes," wrote Santiment in an X post on Tuesday.
These whale transactions may have largely been targeted at buying activity as Litecoin exchanges have recorded net outflows of more than $45 million over the past three days, according to Coinglass data.
Simultaneously, Litecoin open interest (OI) has also surged during the same period. Between Monday and Wednesday, LTC OI has risen over 54% to 8.25 million LTC, its highest level since the October 10 leverage flush. Litecoin's price was sitting above $100 the last time OI was around such levels.
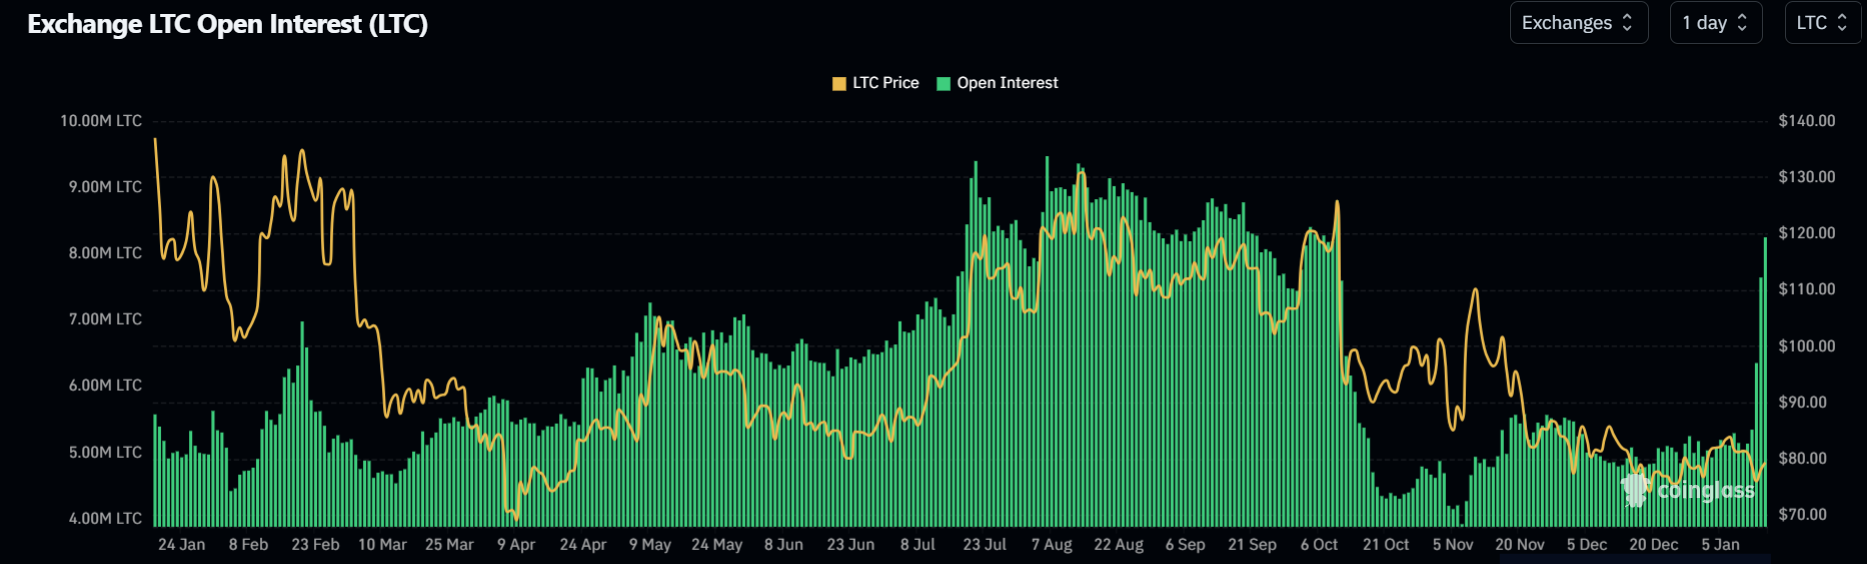
Open interest is the total worth of outstanding contracts in a derivatives market. The increase indicates a return of risk appetite in LTC derivatives trading avenues.
Litecoin Price Forecast: LTC struggles near 20-day EMA
Litecoin is struggling on Wednesday to break above the 20-day and 50-day Exponential Moving Averages (EMAs) after finding support at $75. A firm rise above these EMAs could see LTC test a descending trendline resistance extending from November.
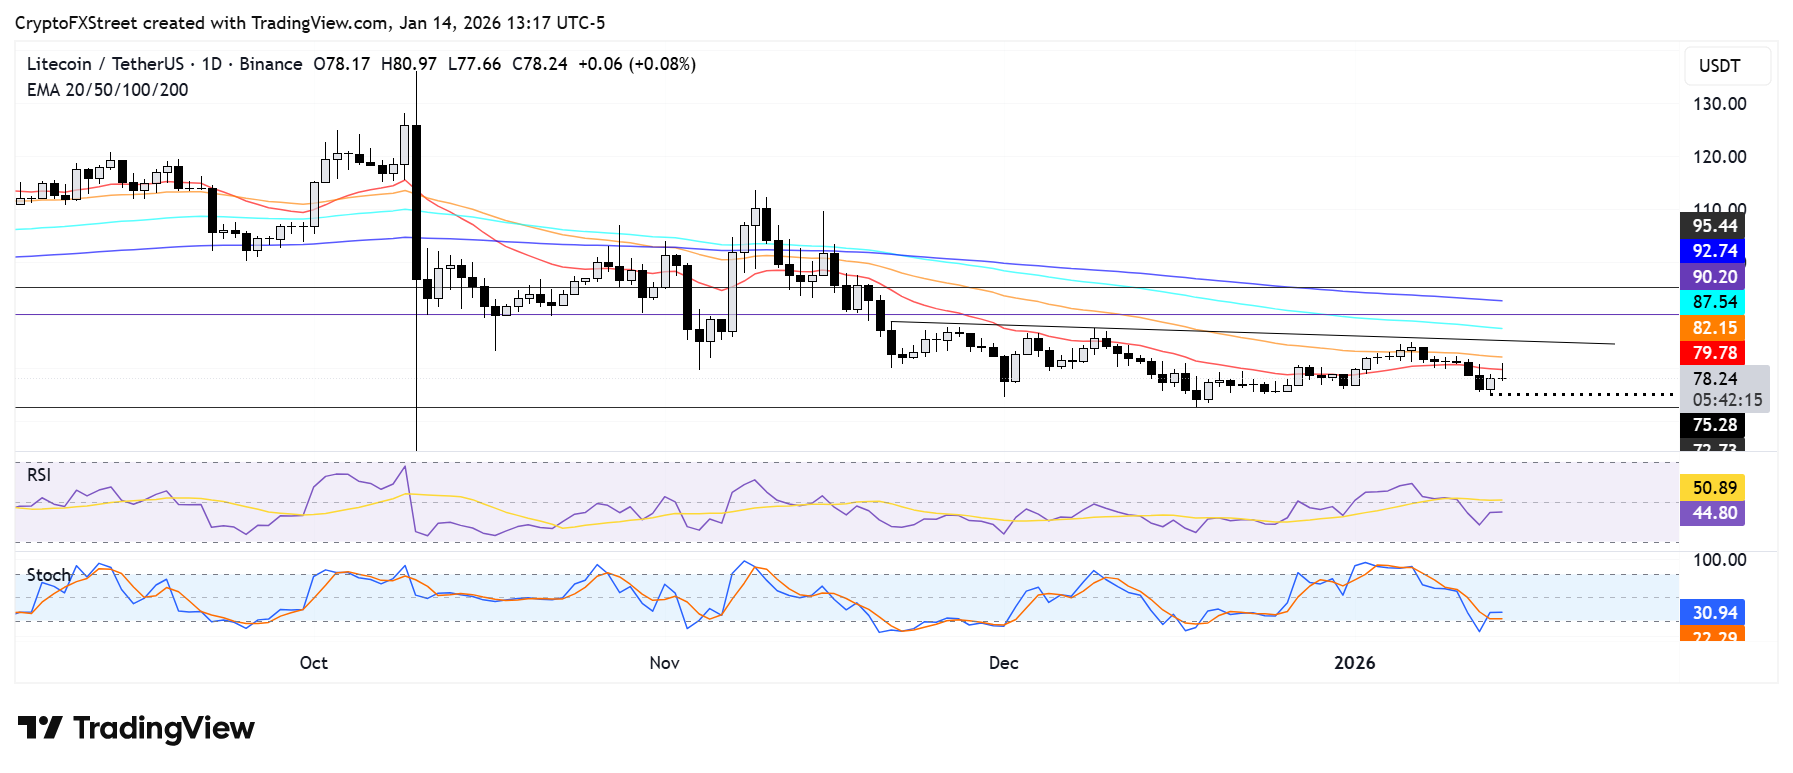
The Relative Strength Index (RSI) and Stochastic Oscillator (Stoch) remain below their neutral levels after a brief upward rise, indicating dominant bearish momentum lingers.

يعتمد أكثر من مليون مستخدم على FXStreet للحصول على بيانات سوقية لحظية، وأدوات رسوم بيانية، ورؤى خبراء، وأخبار الفوركس. يساعد تقويمهم الاقتصادي الشامل والندوات التعليمية عبر الويب المتداولين على البقاء على اطلاع واتخاذ قرارات محسوبة. لدى FXStreet فريق يضم حوالي 60 محترفًا موزعين بين مقر برشلونة ومناطق عالمية مختلفة.
اقرأ المزيد


