
Trade The World
Meme Coins Price Prediction: Dogecoin, Shiba Inu, Pepe rally as risk-on sentiment wakes
بواسطة Vishal Dixit
تاريخ النشر: 10 Nov 2025 | تاريخ التعديل: 10 Nov 2025


POPULAR ARTICLES

Meme Coins, such as Dogecoin (DOGE), Shiba Inu (SHIB), and Pepe (PEPE), are regaining momentum as the broader cryptocurrency market starts the week on a bullish note. The rising retail interest in DOGE, SHIB, and PEPE backs the short-term recovery, as bulls anticipate further gains.
- Dogecoin rally holds above $0.1800, targeting the $0.2000 psychological level.
- Shiba Inu approaches a key resistance level, with bulls anticipating a potential breakout rally.
- Pepe gains traction as retail demand backs short-term recovery.
Meme Coins, such as Dogecoin (DOGE), Shiba Inu (SHIB), and Pepe (PEPE), are regaining momentum as the broader cryptocurrency market starts the week on a bullish note. The rising retail interest in DOGE, SHIB, and PEPE backs the short-term recovery, as bulls anticipate further gains.
Risk-on sentiment returns among investors
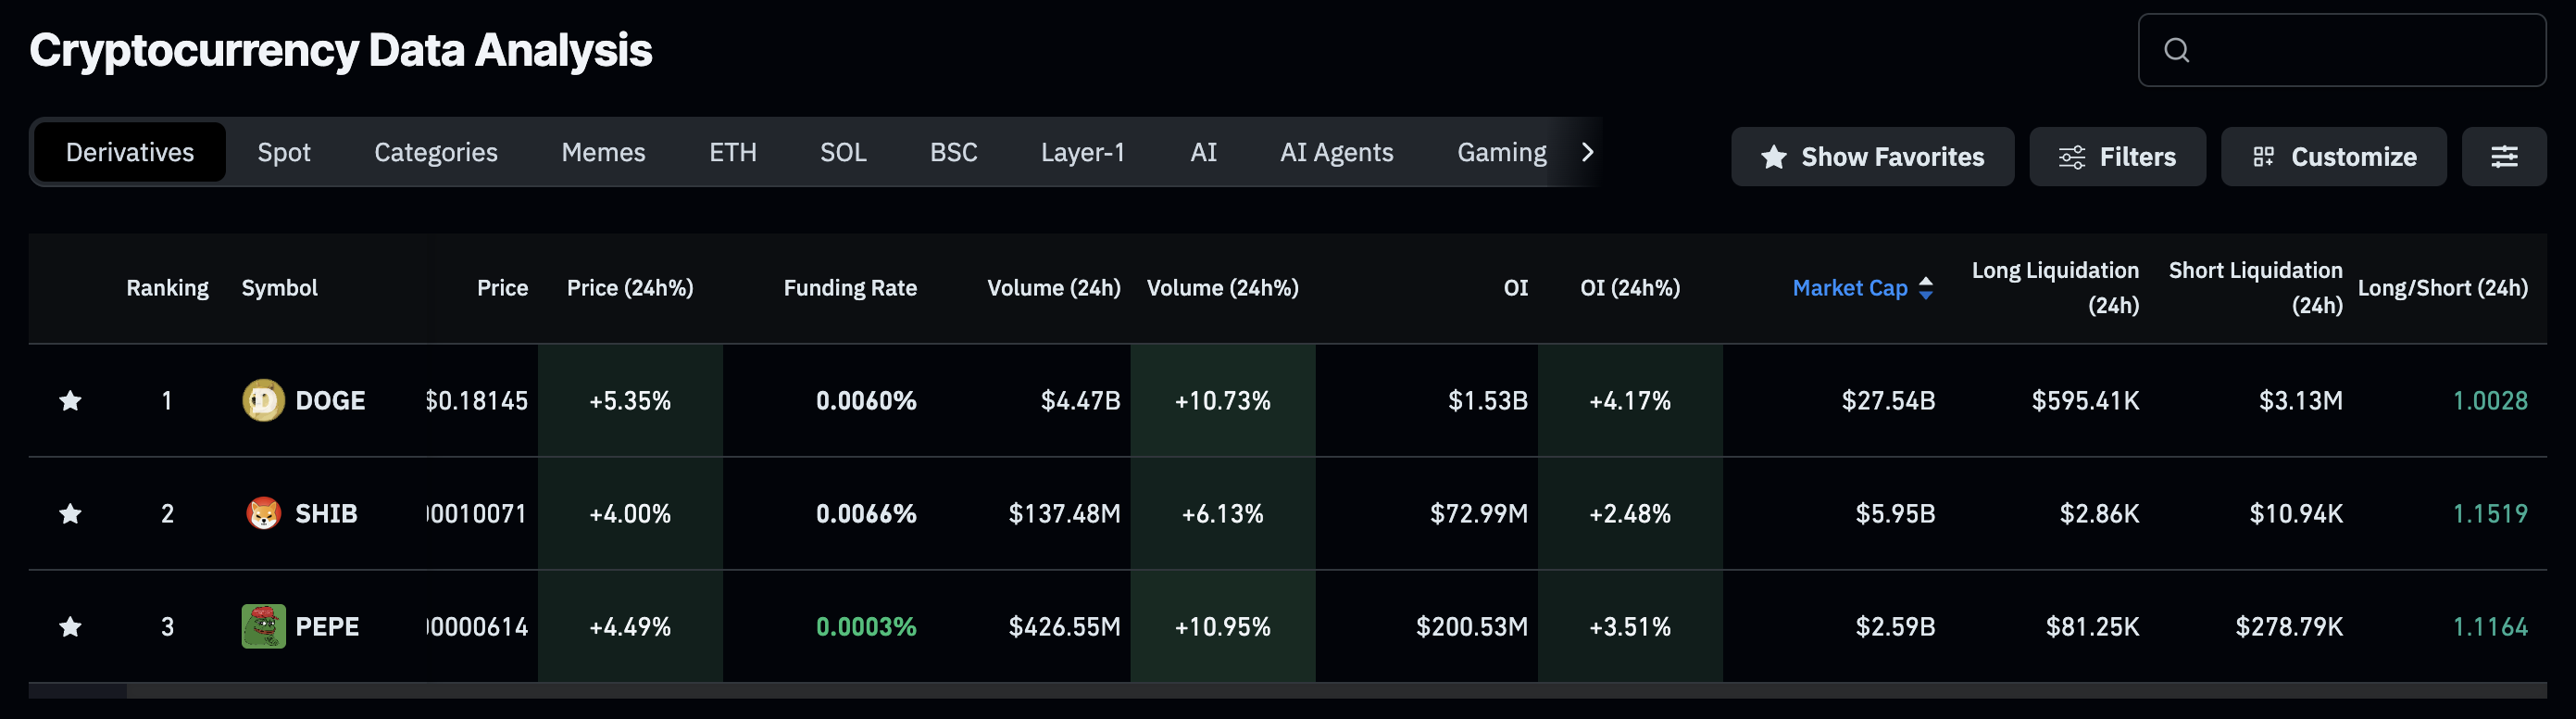
The speculative nature of meme coins typically sees an increase in investor interest during recovery and bullish phases. CoinGlass data shows that the futures Open Interest (OI) of DOGE, SHIB, and PEPE have increased by 4%, 2% and 3%, respectively, in the last 24 hours, reaching $1.53 billion, $72.99 million, and $200.53 million. This rise in the notional value of existing futures contracts suggests that investors are increasing their risk exposure.
Dogecoin recovery run gains traction
Dogecoin recovers above $0.1800 by press time on Monday, extending the nearly 2% gains from the previous day. DOGE’s double bottom reversal from $0.15704 support struggles to surpass the 100-period Exponential Moving Average (EMA) at $0.18154 on the 4-hour chart.
If the meme coin successfully clears this dynamic resistance, it could test the 200-period EMA at $0.19386, followed by a descending trendline formed by connecting the October 14 and October 27 highs, near $0.20000 psychological mark.
The recovery run in DOGE gains traction, as evidenced by the Relative Strength Index (RSI) at 61, which is rising towards the overbought zone on the 4-hour chart. Corroborating this, the Moving Average Convergence Divergence (MACD) reverts to an upward trend, avoiding a cross below the signal line.
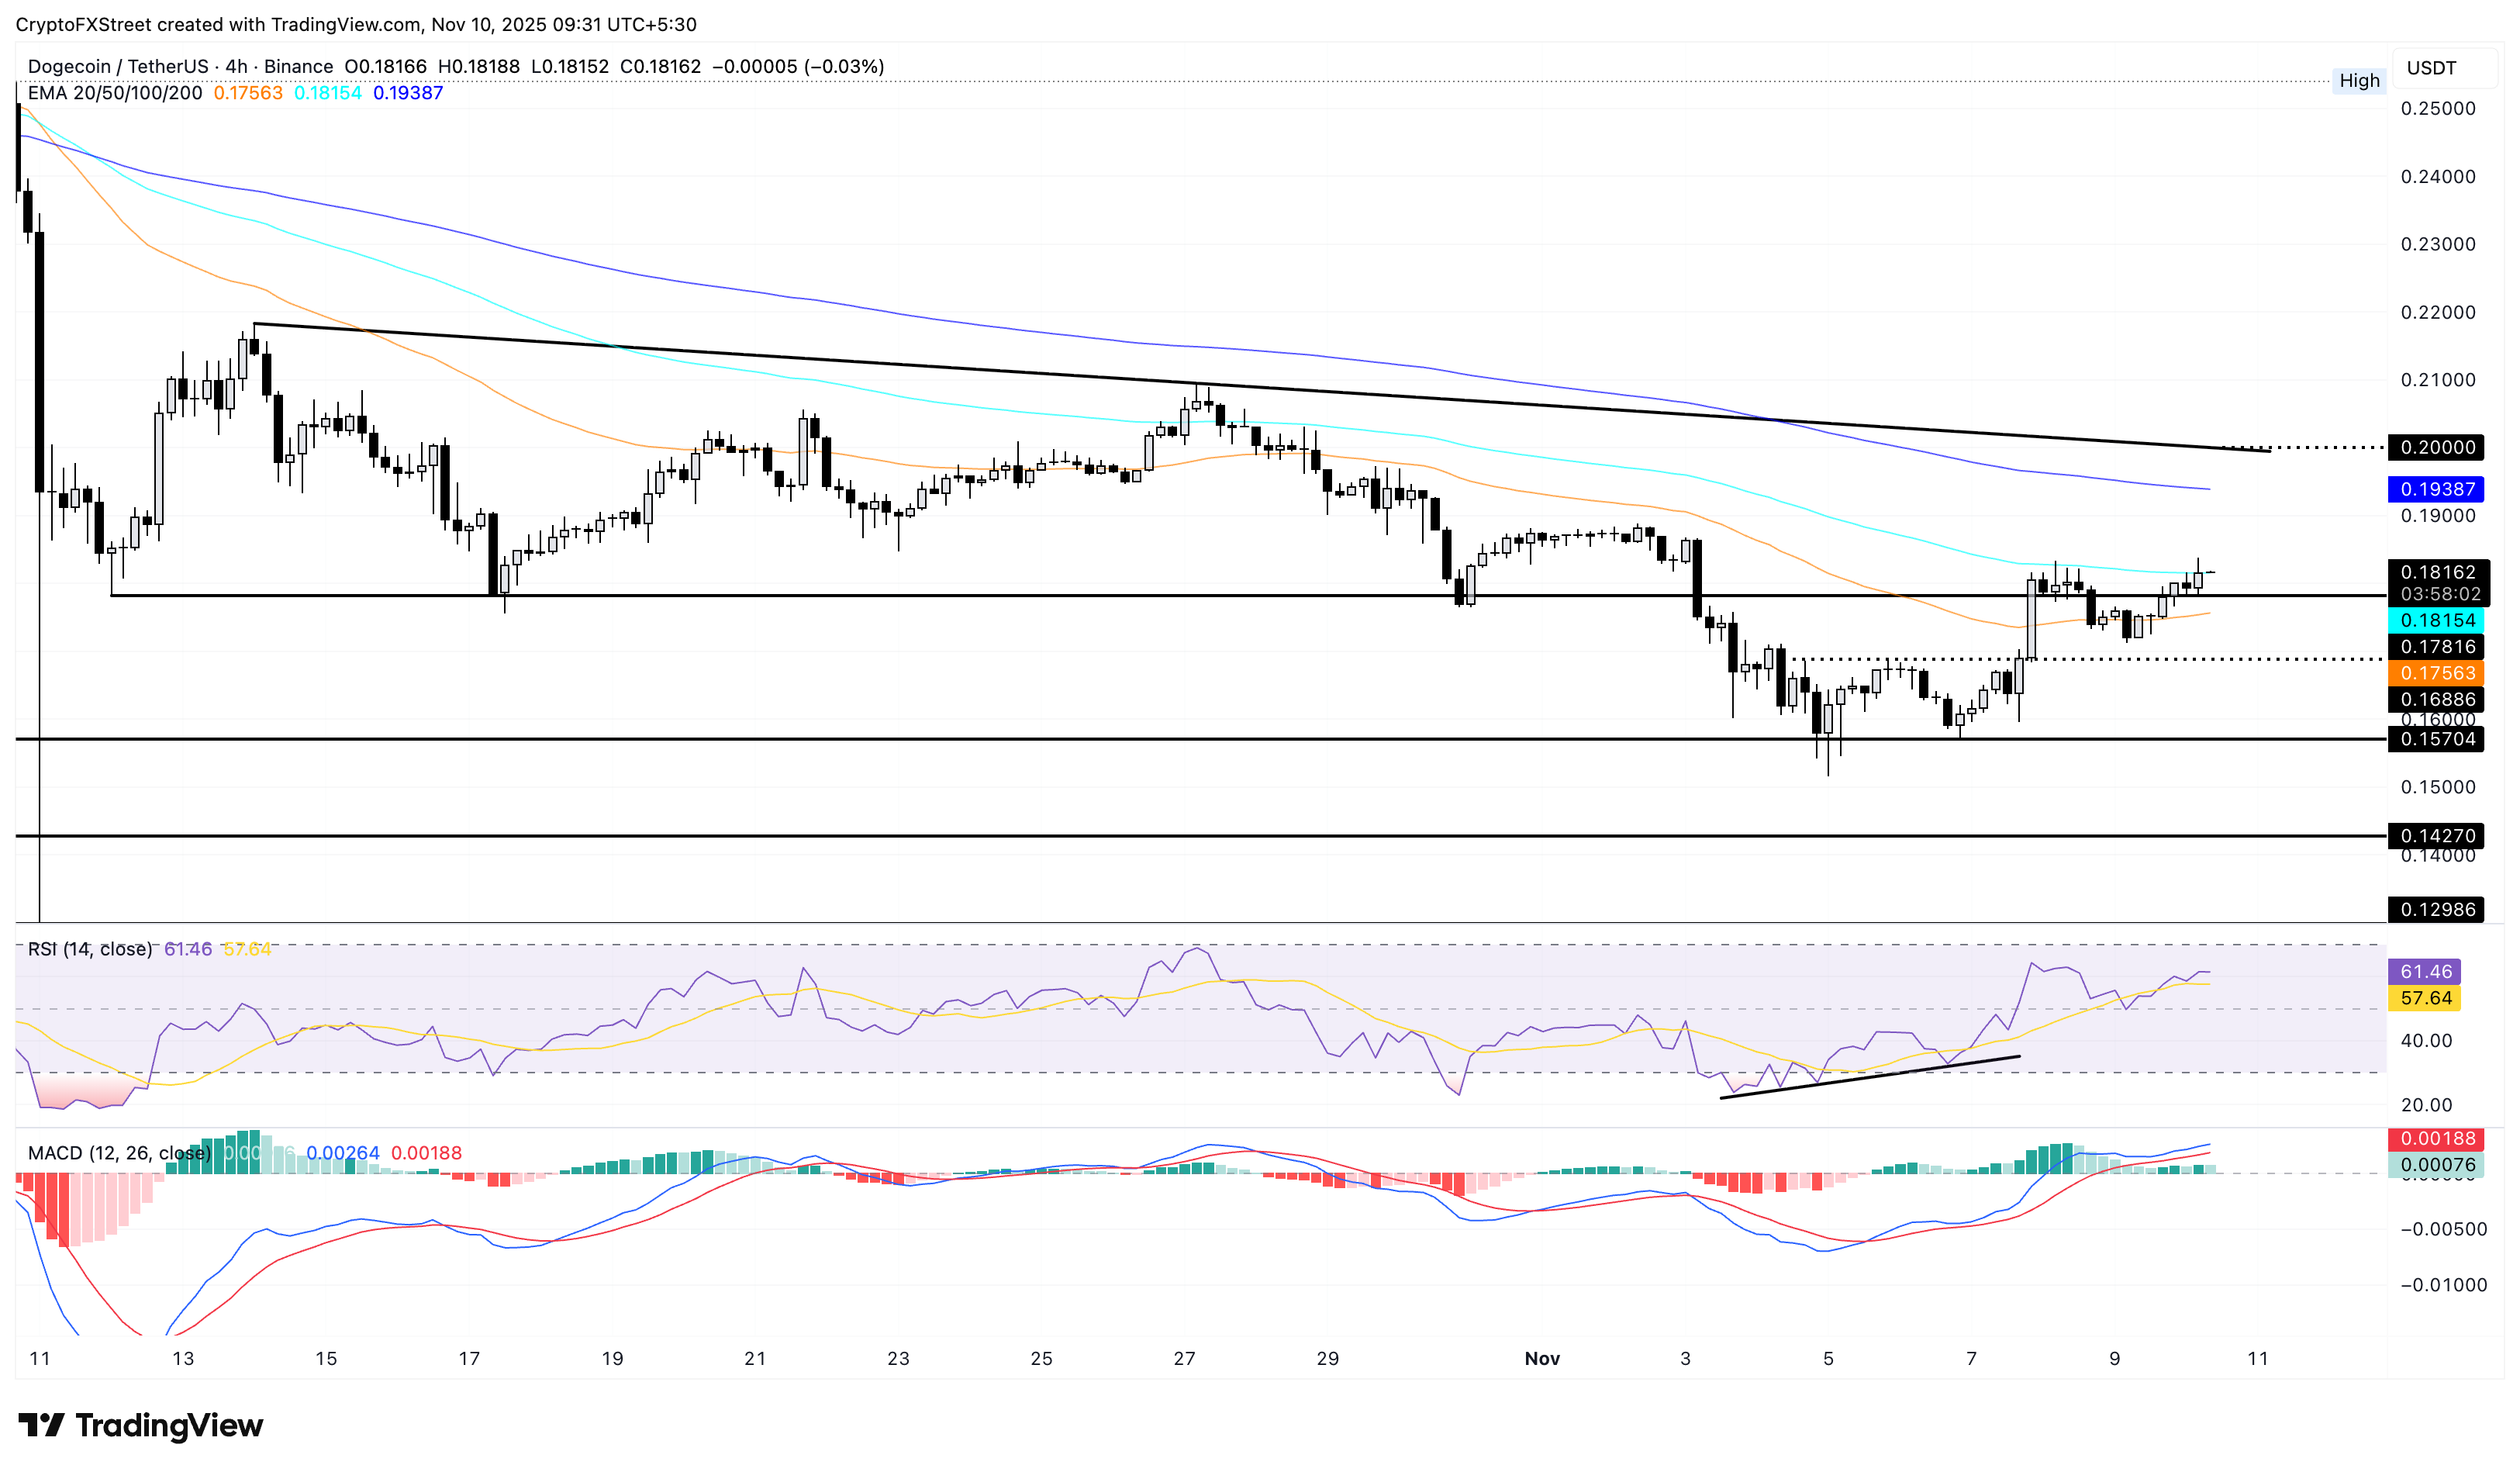
If DOGE fails to hold above the 50-period EMA at $0.17563, it could threaten the $0.16886 level, which acted as the double bottom’s neckline.
Shiba Inu eyes trendline breakout rally
Shiba Inu recovers by 1% at press time on Monday, approaching a key resistance trendline formed by the October 14 and October 27 peaks, which is close to the 200-period EMA on the 4-hour price chart. The resurgence of retail demand in this meme coin anticipates a potential breakout rally.
If SHIB marks a 4-hour candle close above the 200-period EMA at $0.00001029, it would confirm the trendline breakout.
However, the momentum indicators on the 4-hour chart display mixed signals as the RSI, at 59, hovers above the neutral zone, while the MACD risks crossing below the signal line.
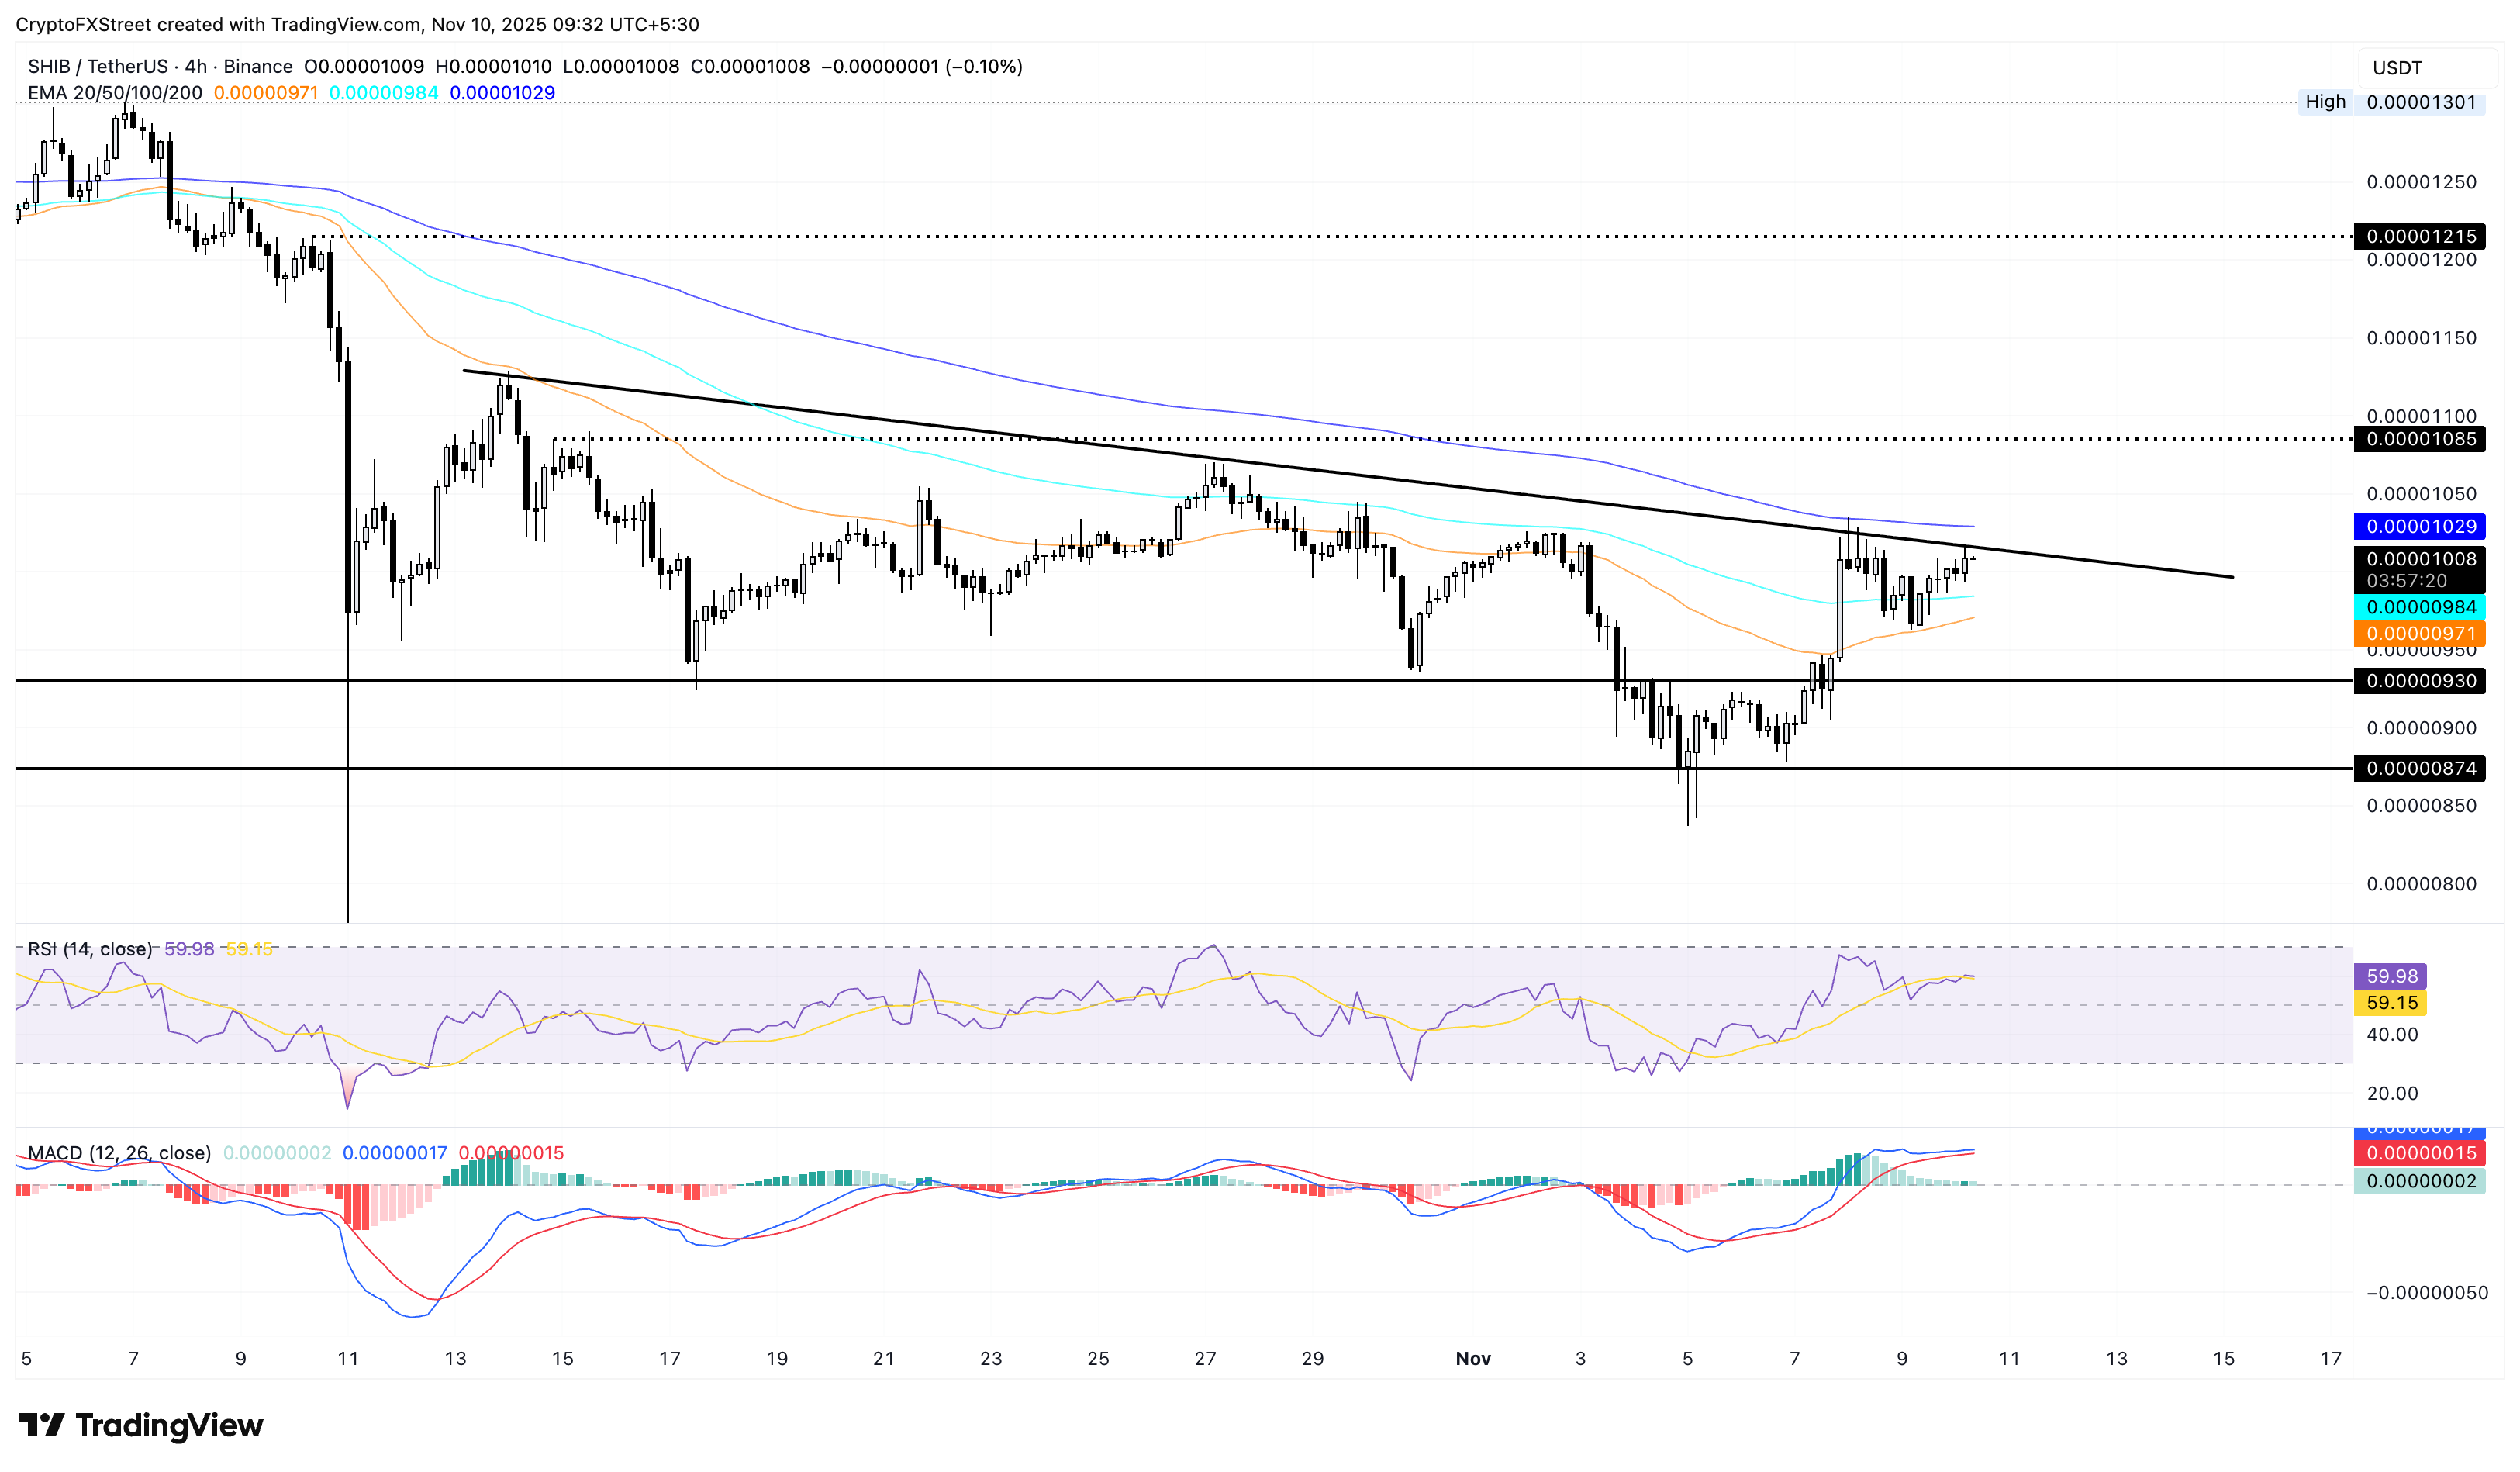
In case of a reversal from the trendline, Shiba Inu could test the 50-period EMA at $0.00000971.
Pepe upcycle could lift the sideways trend bullish
Pepe edges higher by nearly 2% at the time of writing on Monday, remaining within a sideways track between $0.00000629 and $0.00000583, marked by lows on October 17 and Sunday, respectively. If the recovery run in PEPE surfaces above the upper ceiling at $0.00000629, it could test a resistance trendline at $0.00000685, formed by connecting the highs of October 13 and October 27.
Similar to SHIB, the momentum indicators on the 4-hour chart show mixed signals as the RSI at 56 rises above the midpoint line. Meanwhile, the MACD nears the signal line, risking a potential crossover that could trigger a sell signal.
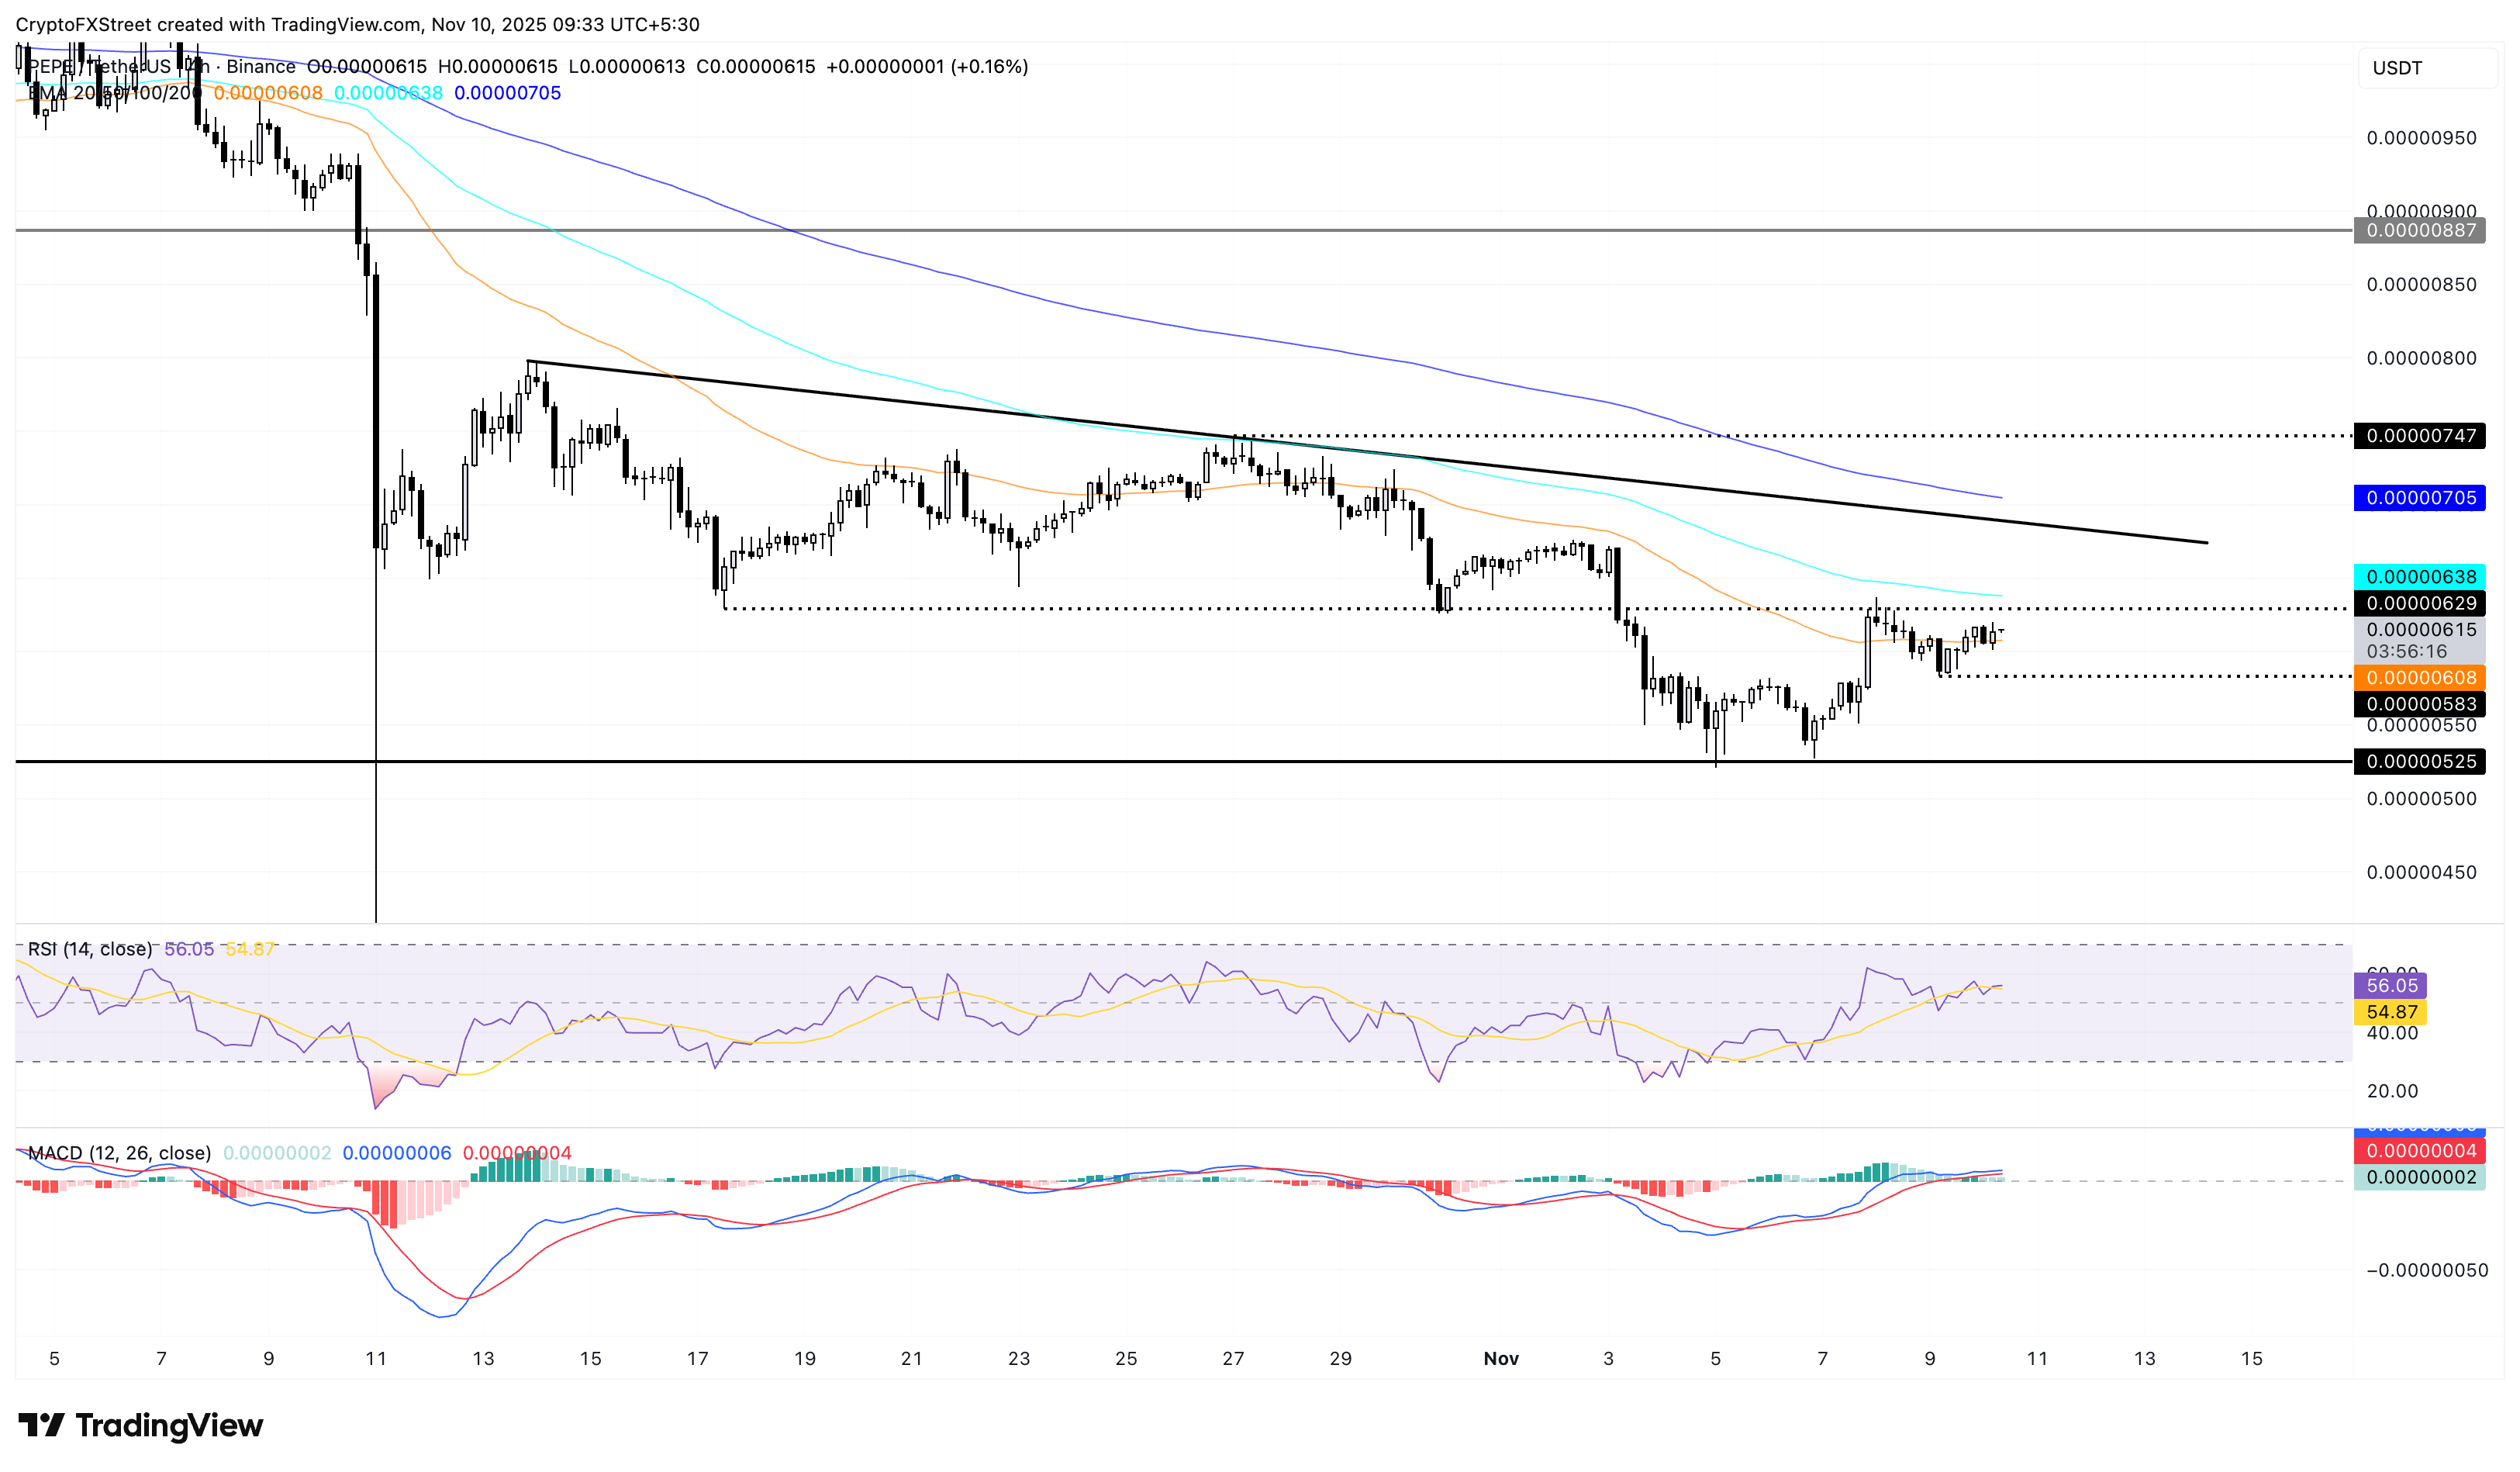
On the flip side, if PEPE slips below $0.00000583, it could extend the decline to last week’s support floor at $0.00000525.

FXStreet
يعتمد أكثر من مليون مستخدم على FXStreet للحصول على بيانات سوقية لحظية، وأدوات رسوم بيانية، ورؤى خبراء، وأخبار الفوركس. يساعد تقويمهم الاقتصادي الشامل والندوات التعليمية عبر الويب المتداولين على البقاء على اطلاع واتخاذ قرارات محسوبة. لدى FXStreet فريق يضم حوالي 60 محترفًا موزعين بين مقر برشلونة ومناطق عالمية مختلفة.
Read More


