
Trade The World
SPX6900 Price Forecast: SPX slips 13% as derivatives data show bearish bias
بواسطة Manish Chhetri
تاريخ النشر: 3 Nov 2025 | تاريخ التعديل: 3 Nov 2025


POPULAR ARTICLES
SPX6900 (SPX) extends its decline, trading below $0.77 at the time of writing on Monday after falling 22% in the previous week. The derivatives data projects a bearish sentiment, with SPX’s Open Interest (OI) falling and bearish bets rising among traders.
- SPX6900 price slips below $0.77 on Monday after falling over 22% in the previous week.
- Derivatives data show falling Open Interest and rising bearish positions, suggesting growing downside pressure.
- The technical outlook suggests weakness, with bears targeting a drop toward $0.63.
SPX6900 (SPX) extends its decline, trading below $0.77 at the time of writing on Monday after falling 22% in the previous week. The derivatives data projects a bearish sentiment, with SPX’s Open Interest (OI) falling and bearish bets rising among traders. The technical side further supports a bearish outlook, suggesting that SPX6900 could extend its decline toward $0.63 level.
SPX6900 drops amid rising bearish signals in the derivatives market
Derivatives metrics for SPX6900 show a bearish bias. CoinGlass’s long-to-short ratio for SPX at 0.83 on Monday, the lowest level in over a month, rising bearish bets among traders.
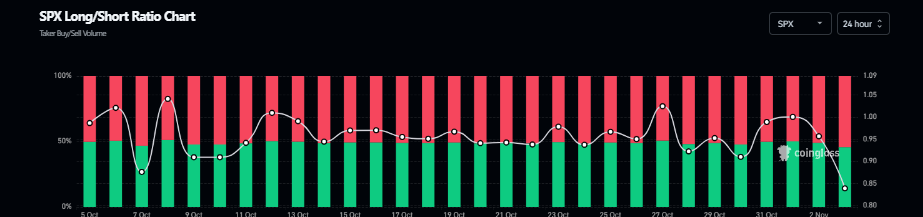
SPX long-to-short ratio chart. Source: Coinglass
Coinglass’s futures Open Interest for the SPX meme coin drops to $9.30 million on Monday, compared to $18.96 million on October 7. This drop in OI, which has been falling since July, signals waning investor participation and reinforces a weakening market sentiment for the SPX meme coin.
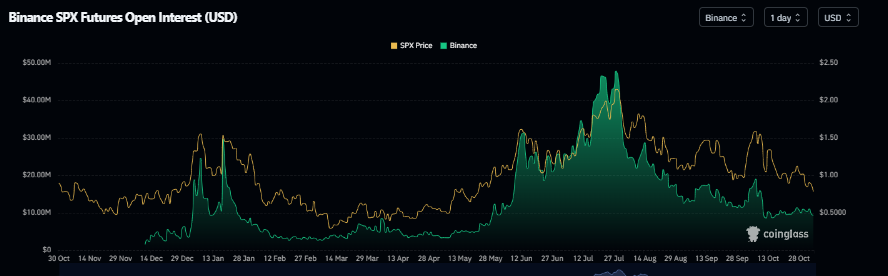
SPX open interest chart. Source: Coinglass
SPX6900 Price Forecast: SPX drops 13% as bears take control of momentum
SPX6900 price corrected by more than 22% in the previous week after being rejected around the 50-day Exponential Moving Average (EMA) at $1.11 and retested the May 27 low at $0.81. At the time of writing on Monday, SPX extends its correction by 13% trading at $0.75.
If SPX continues its correction, it could extend the correction toward the daily support at $0.63.
The Relative Strength Index (RSI) on the daily chart is 35, below the neutral 50 level, indicating strong bearish momentum. Additionally, the Moving Average Convergence Divergence (MACD) showed a bearish crossover last week, which remains in effect, further supporting the bearish view.
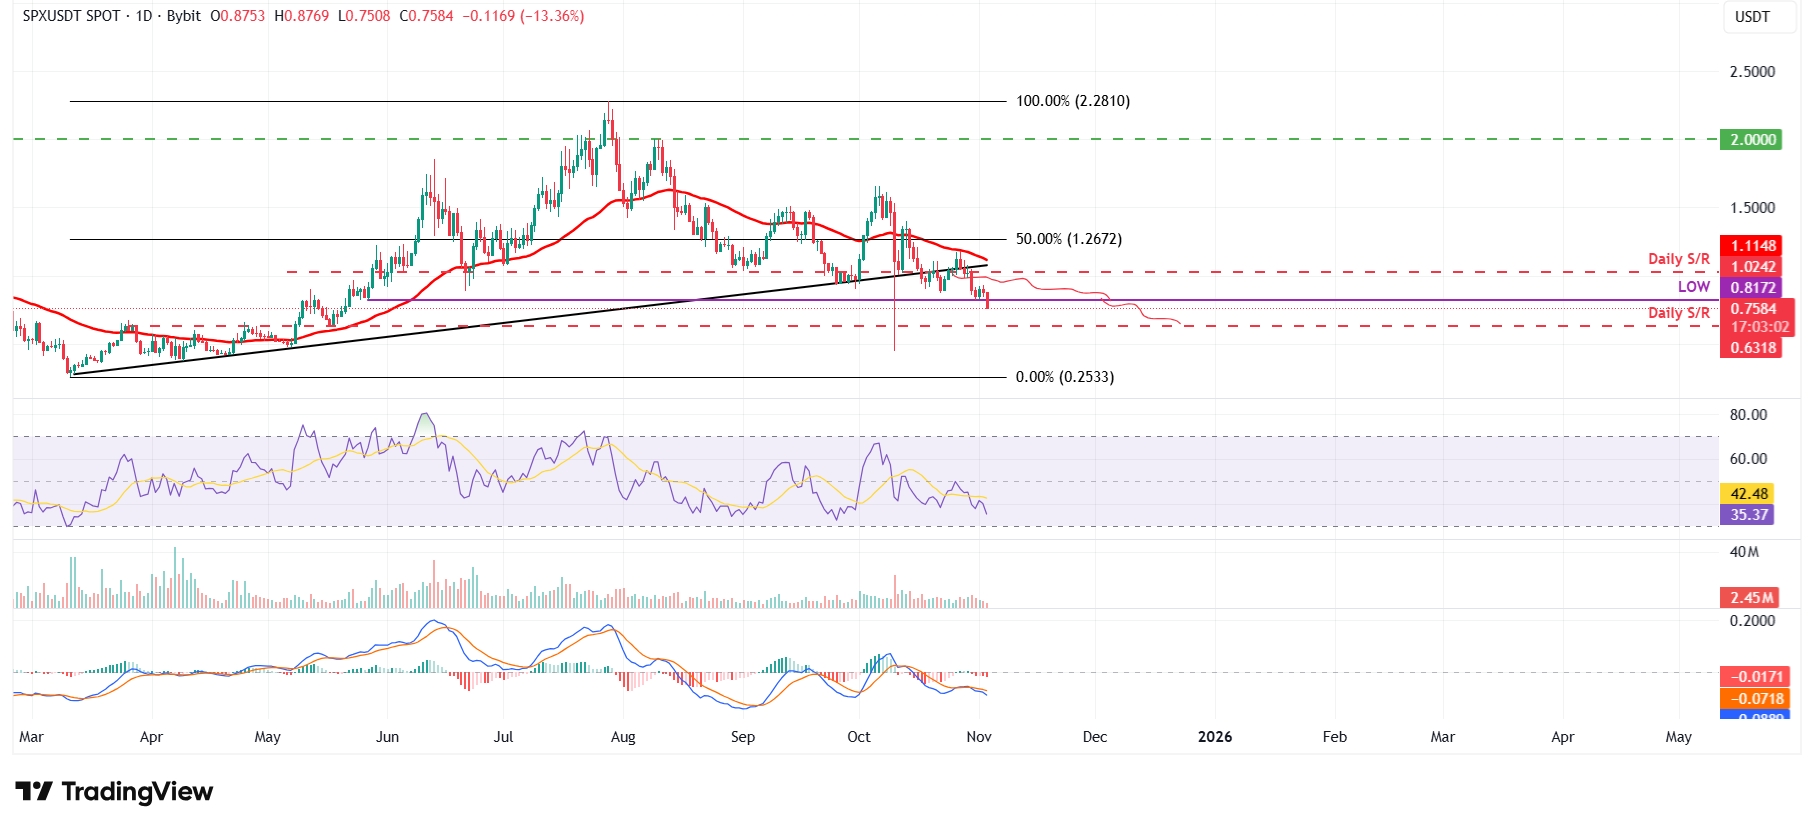
SPX/USDT daily chart
On the other hand, if SPX recovers, it could extend the recovery toward the daily resistance at $1.02.

FXStreet
يعتمد أكثر من مليون مستخدم على FXStreet للحصول على بيانات سوقية لحظية، وأدوات رسوم بيانية، ورؤى خبراء، وأخبار الفوركس. يساعد تقويمهم الاقتصادي الشامل والندوات التعليمية عبر الويب المتداولين على البقاء على اطلاع واتخاذ قرارات محسوبة. لدى FXStreet فريق يضم حوالي 60 محترفًا موزعين بين مقر برشلونة ومناطق عالمية مختلفة.
Read More


