
Trade The World
Sui Price Forecast: SUI reclaims $2.00 despite DeFI TVL logging 15% drop
بواسطة John Isige
تاريخ النشر: 12 Nov 2025 | تاريخ التعديل: 12 Nov 2025


POPULAR ARTICLES

Sui trades above $2.00, supported by a strengthening short-term technical structure.
- Sui trades above $2.00, supported by a strengthening short-term technical structure.
- Sui DeFi TVL extends decline to $1.35 billion as risk-off sentiment persists in the ecosystem.
- Retail demand remains subdued, with SUI's Open Interest steady at $781 million.
Sui (SUI) is rising in tandem with the cryptocurrency market, trading above $2.00 at the time of writing on Wednesday. The bullish wave behind Sui's 3.5% increase followed a correction that erased gains from $2.20 to $1.98 the previous day.
Sui price gains despite falling DeFi TVL
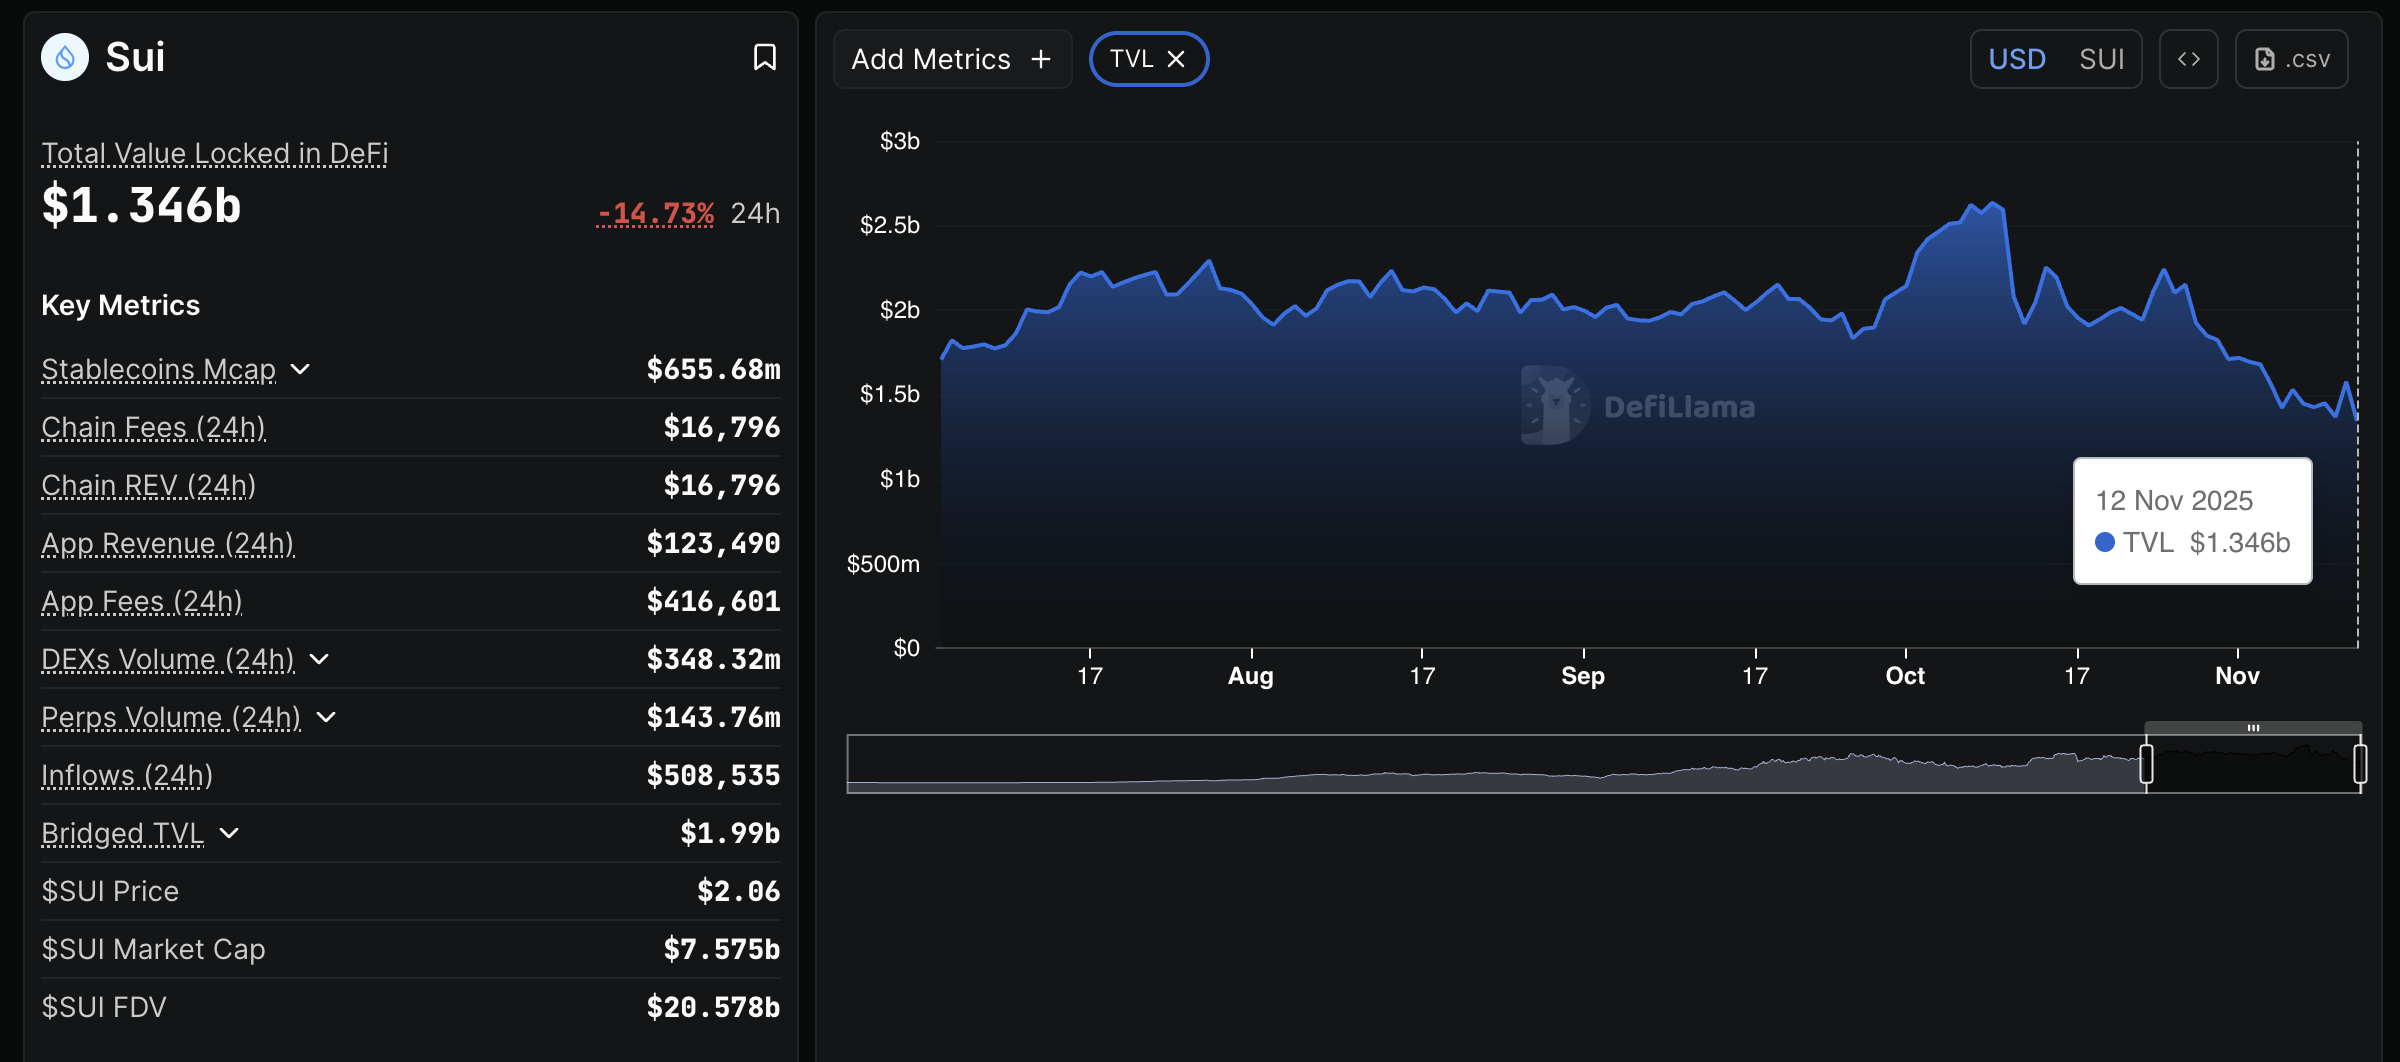
Interest in Sui's Decentralized Finance (DeFi) sectors continues to decline, as evidenced by the steady drop in its total value locked (TVL). According to DefiLlama data, TVL, which measures the notional value of all staked assets on the protocol, is down by 15% to $1.35 billion over the past 24 hours.
Sui's TVL, which hit a record high of $2.63 billion on October 9, has maintained a downtrend, reflecting the risk-off sentiment in the broader cryptocurrency market.
Traders are withdrawing assets from staking protocols, indicating waning confidence in the token and the ecosystem's growth potential. As these tokens re-enter circulation, selling pressure increases, raising the likelihood of a gradual decline in Sui's price.
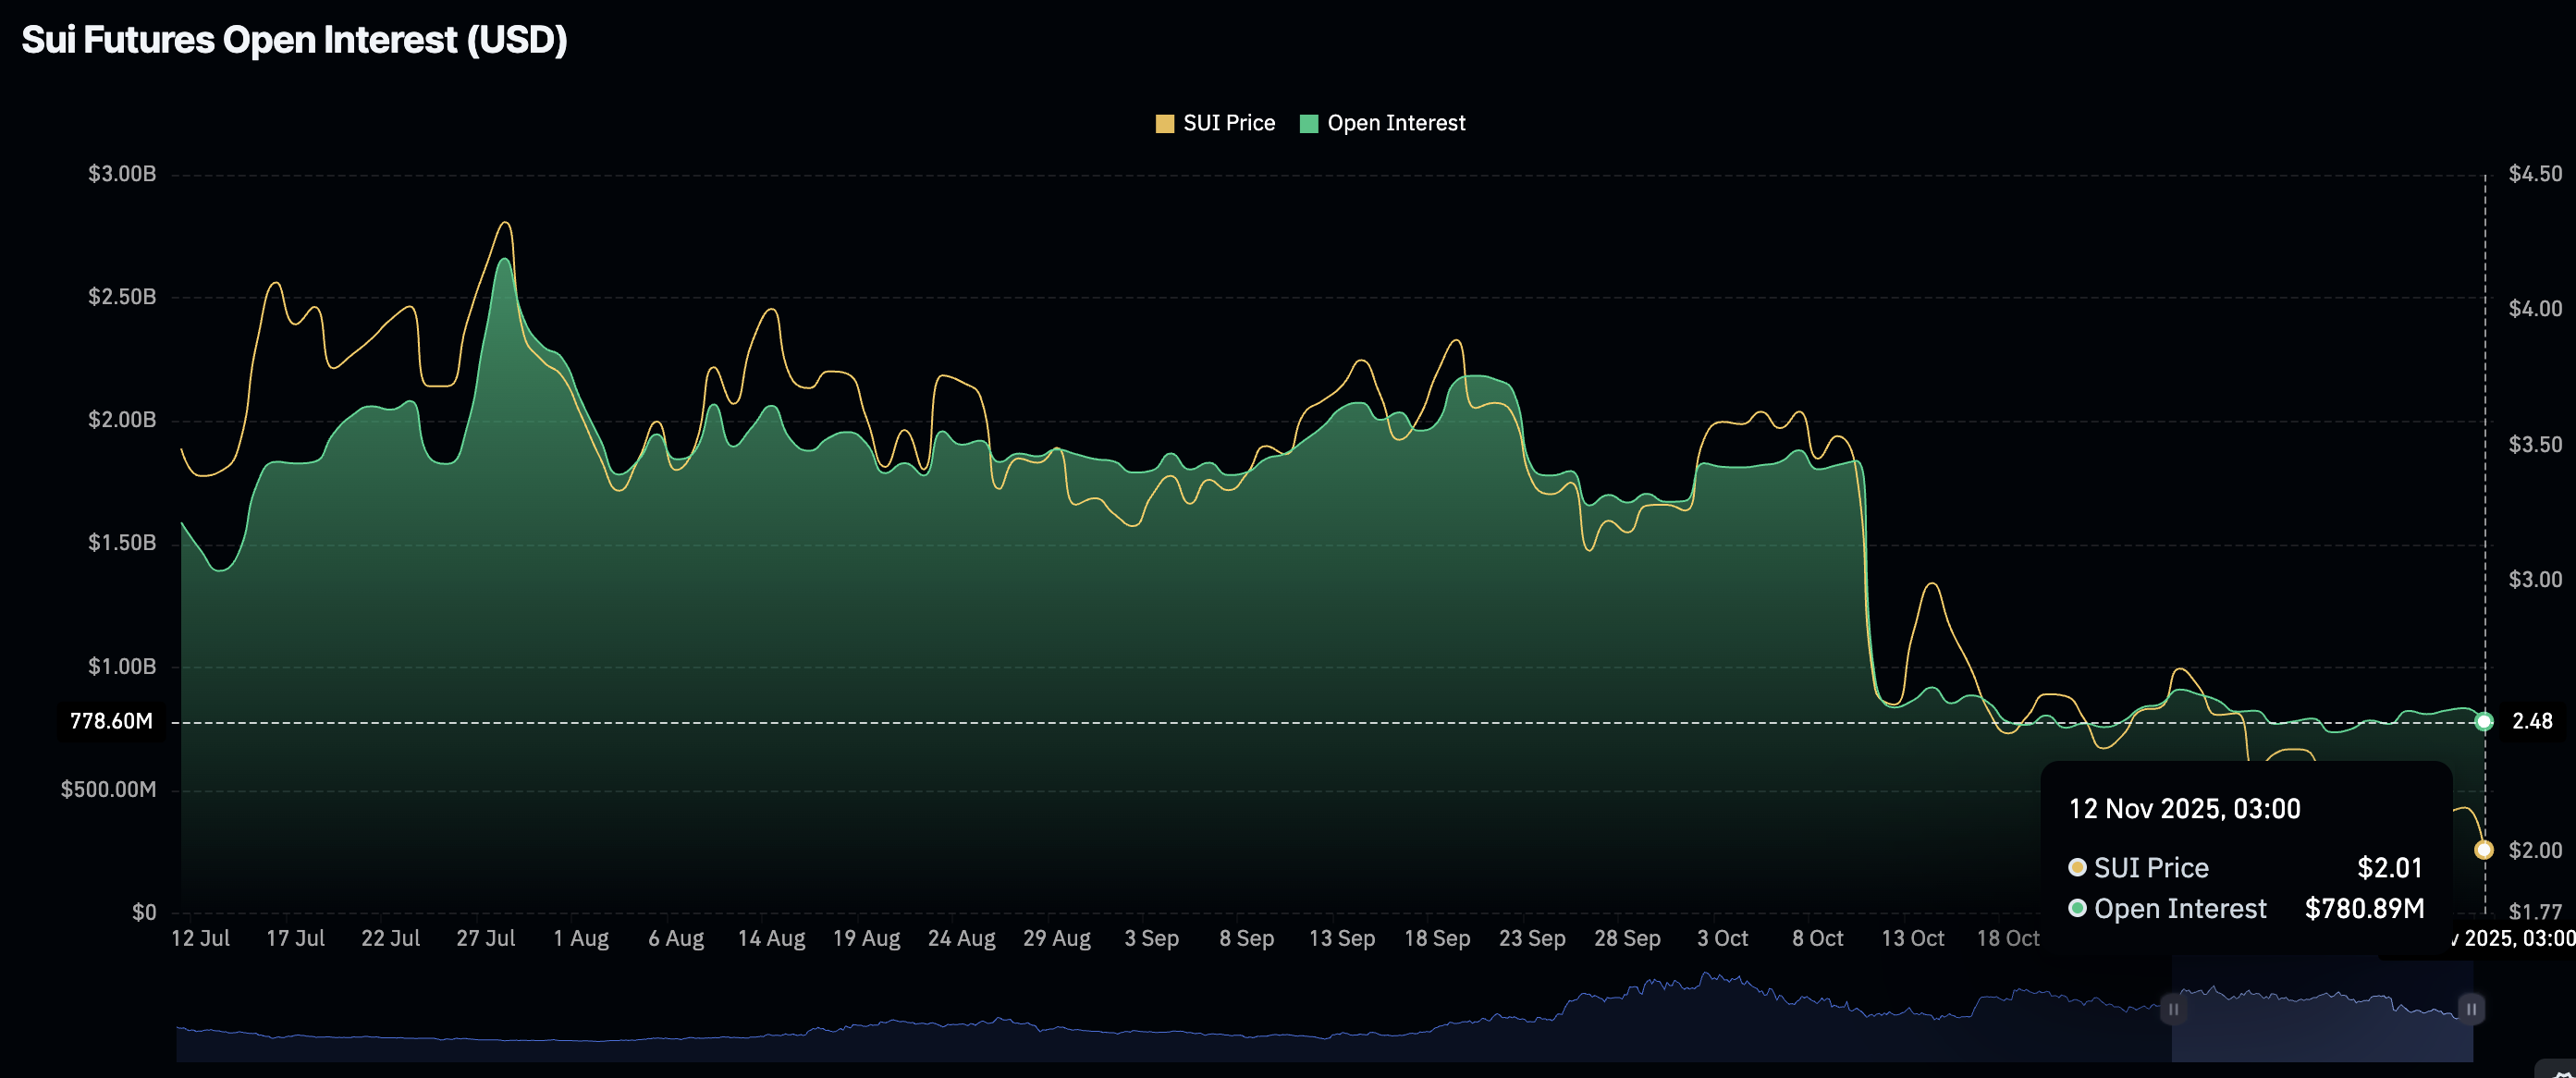
Meanwhile, retail interest in Sui has remained significantly muted since mid-October, suggesting that investors are not convinced the Layer-1 token can sustain a short-term recovery.
The futures Open Interest (OI) has fallen to approximately $781 million on Wednesday, from $835 million on Tuesday and $1.84 billion on October 1. OI needs to rise steadily to support Sui's recovery. Otherwise, the downtrend could continue below $2.00.
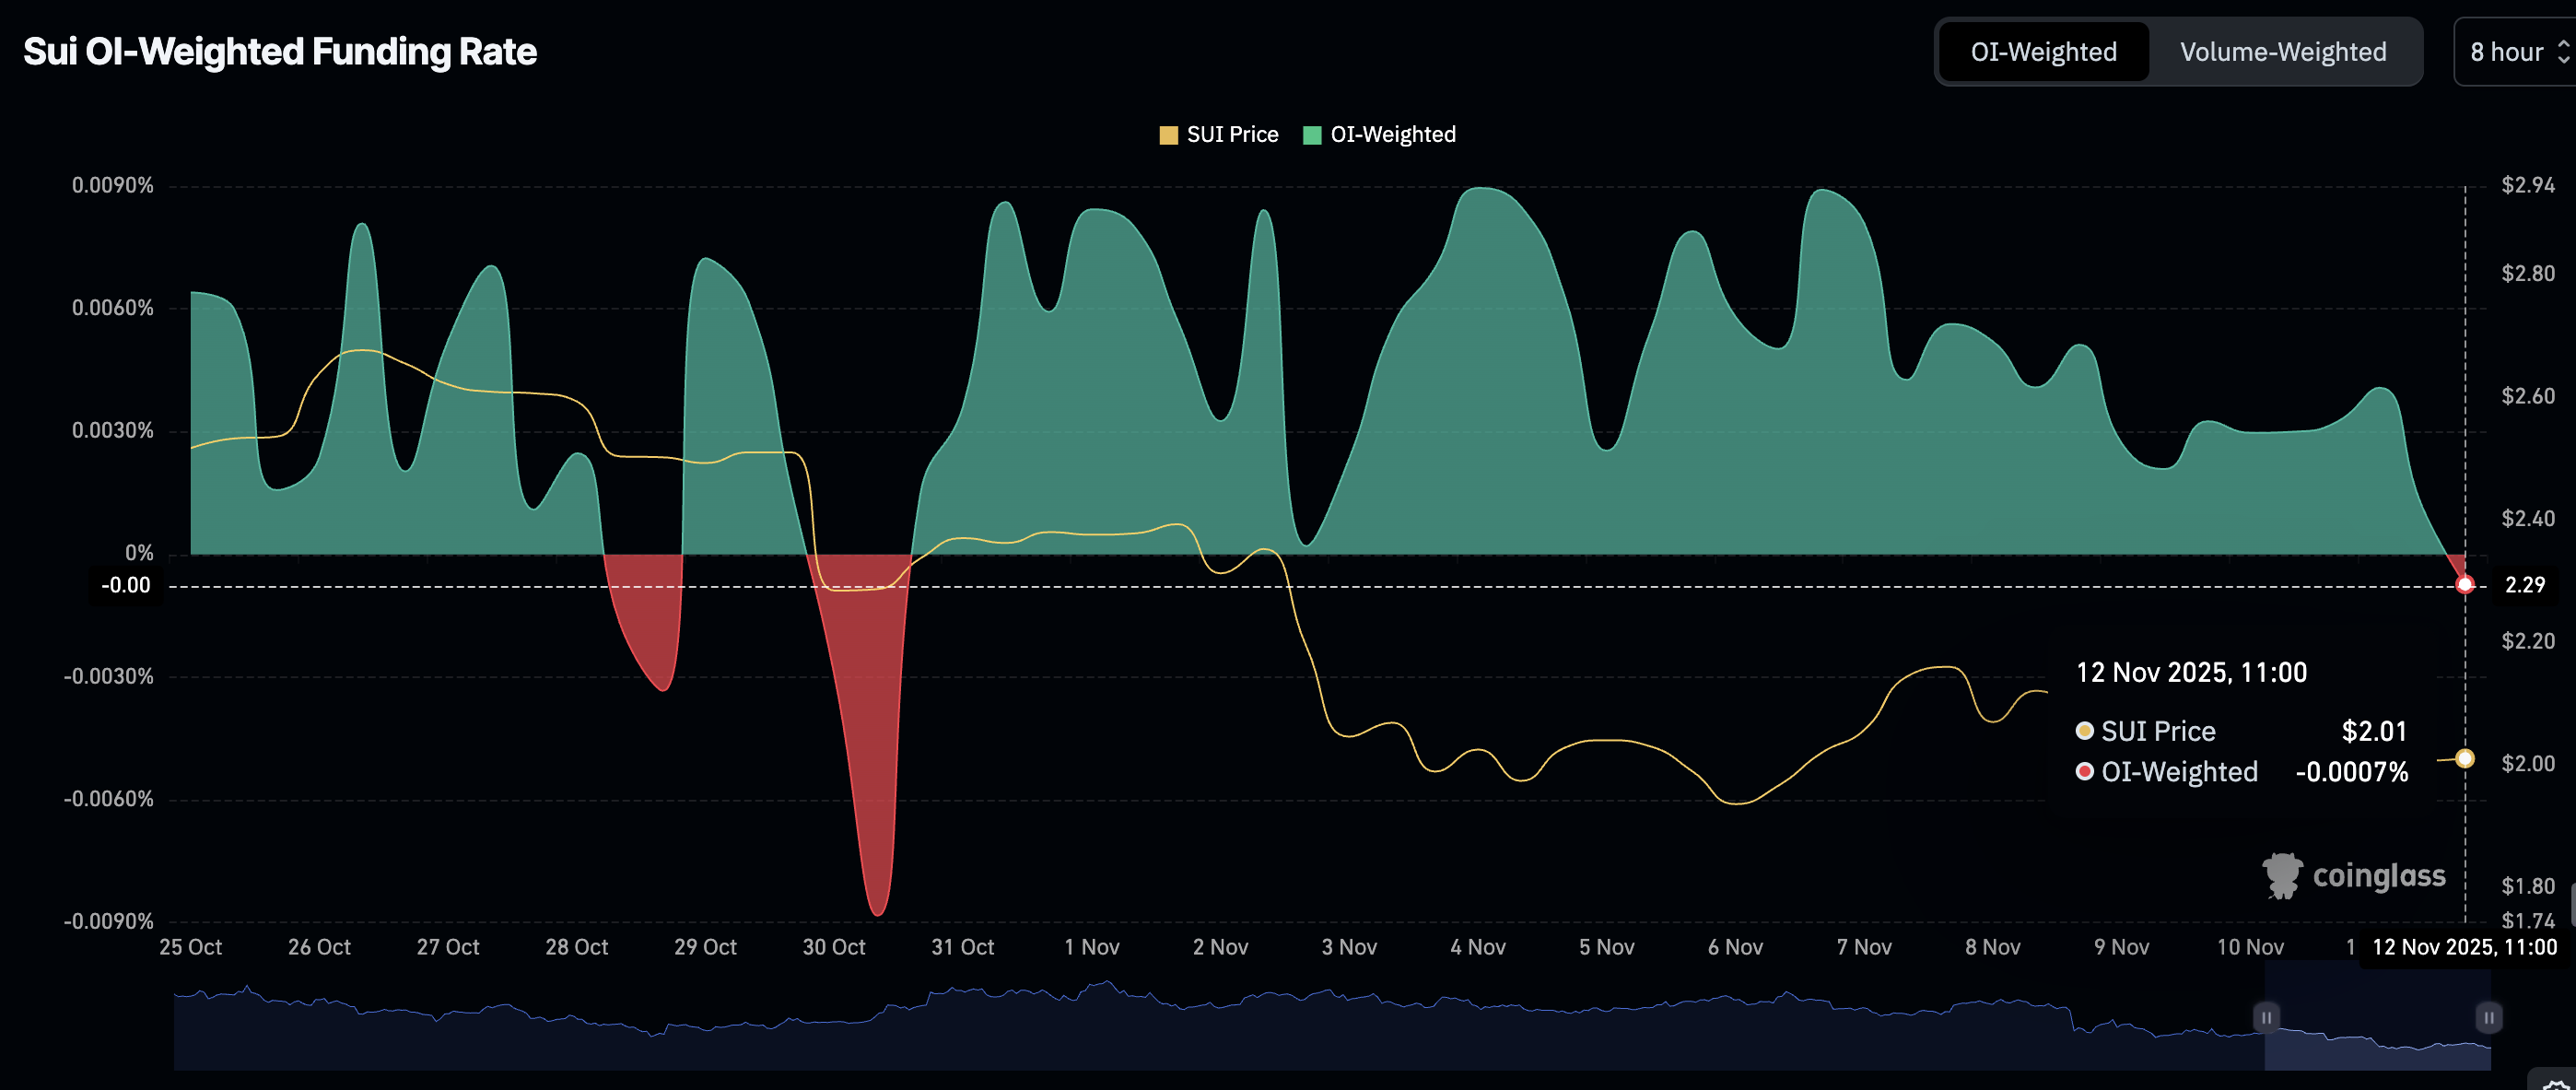
The OI-Weighted Funding Rate metric has extended the decline to -0007% at the time of writing, suggesting that traders are increasingly piling into short positions and contributing to selling pressure.
Technical outlook: Sui holds key support
Sui is trading above $2.00 at the time of writing on Wednesday, driven by positive sentiment in the larger crypto market. The Relative Strength Index's (RSI) rebound to 37 from 35 the previous days suggests that bearish momentum is easing.
A buy signal from the Moving Average Convergence Divergence (MACD) indicator since Sunday is encouraging investors to buy SUI, anticipating further price increases.
The next key resistance lies at $2.20, which was tested on Tuesday, the 50-day Exponential Moving Average (EMA) at $2.62 and the 200-day EMA at $3.06.

Still, Sui's position below key moving averages, such as the 50-day, 100-day and 200-day EMAs, highlights a sticky bearish sentiment. A significant shift in dynamics is required to sustain the short-term uptrend and favour Sui's bullish outlook.
Open Interest, funding rate FAQs
Higher Open Interest is associated with higher liquidity and new capital inflow to the market. This is considered the equivalent of increase in efficiency and the ongoing trend continues. When Open Interest decreases, it is considered a sign of liquidation in the market, investors are leaving and the overall demand for an asset is on a decline, fueling a bearish sentiment among investors.
Funding fees bridge the difference between spot prices and prices of futures contracts of an asset by increasing liquidation risks faced by traders. A consistently high and positive funding rate implies there is a bullish sentiment among market participants and there is an expectation of a price hike. A consistently negative funding rate for an asset implies a bearish sentiment, indicating that traders expect the cryptocurrency’s price to fall and a bearish trend reversal is likely to occur.

FXStreet
يعتمد أكثر من مليون مستخدم على FXStreet للحصول على بيانات سوقية لحظية، وأدوات رسوم بيانية، ورؤى خبراء، وأخبار الفوركس. يساعد تقويمهم الاقتصادي الشامل والندوات التعليمية عبر الويب المتداولين على البقاء على اطلاع واتخاذ قرارات محسوبة. لدى FXStreet فريق يضم حوالي 60 محترفًا موزعين بين مقر برشلونة ومناطق عالمية مختلفة.
Read More


