
Trade The World
Top Crypto Gainers: JasmyCoin rallies as Cosmos and Bittensor retreat
بواسطة Vishal Dixit
تاريخ النشر: 7 Jan 2026 | تاريخ التعديل: 7 Jan 2026


POPULAR ARTICLES

JasmyCoin (JASMY), Cosmos (ATOM), and Bittensor (TAO) are among the top-performing cryptocurrency assets in the last 24 hours.
- JasmyCoin approaches $0.01000 after a 27% jump on Tuesday, marking its sixth consecutive day of gains.
- Cosmos is down 2% following Tuesday’s 7% rise, breaking the streak of six consecutive daily gains.
- Bittensor loses over 3% after Tuesday’s 10% jump, failing to surpass the $300 mark.
JasmyCoin (JASMY), Cosmos (ATOM), and Bittensor (TAO) are among the top-performing cryptocurrency assets in the last 24 hours. JasmyCoin leads the rally with double-digit gains, and bulls are targeting further gains, while Cosmos and Bittensor struggle to extend their gains after six consecutive days of recovery.
JasmyCoin inches closer to reclaiming a psychological level
JasmyCoin trades above $0.00950 at press time on Wednesday following the 27% surge on the previous day. The ongoing recovery in JASMY aims for the 200-day Exponential Moving Average (EMA) at $0.01105.
A clean push above this moving average could extend the rally to $0.01361, last tested on October 3.
The technical indicators on the daily chart suggest intense buying pressure. The Relative Strength Index (RSI) is at 79, deep into the overbought zone, but it warns of a potential reversal as buying pressure nears unsustainable levels.
At the same time, the intense buying fuels trend momentum indicated by a steady rise in the Moving Average Convergence Divergence (MACD) and green histogram bars.
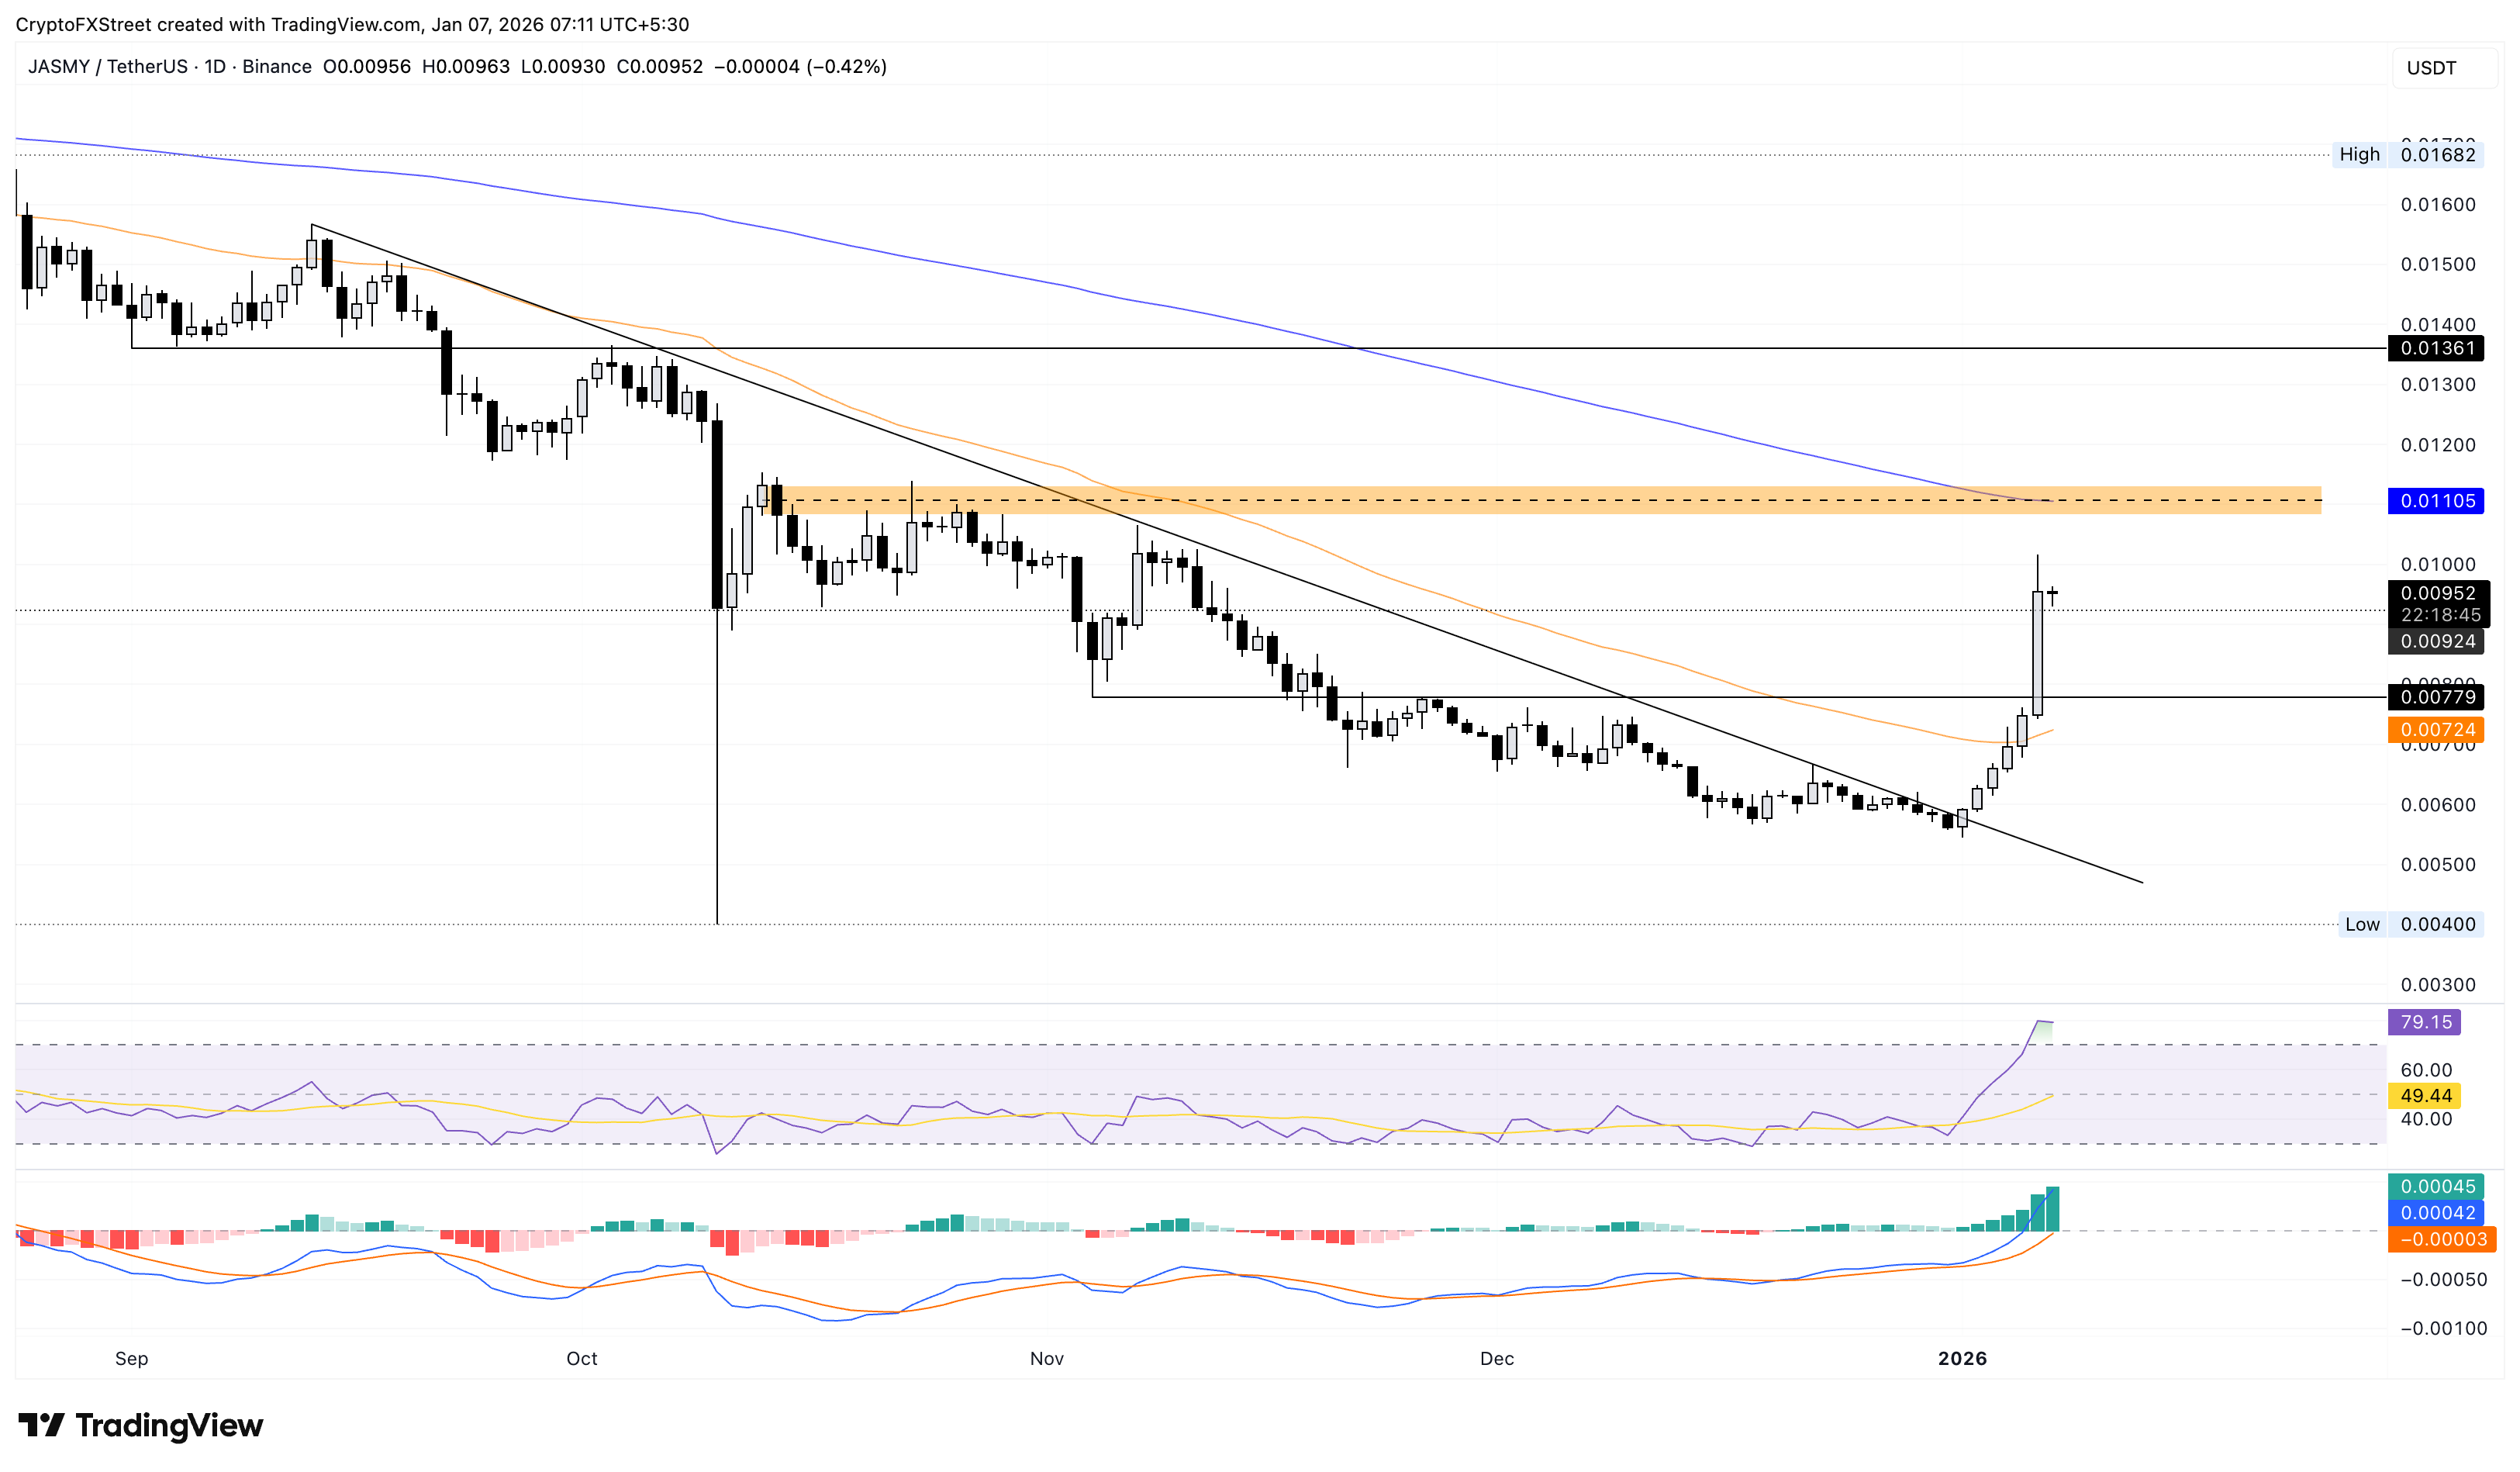
On the flip side, if JASMY reverses from $0.01000, it could retest the $0.00779 level, marked by the November 4 low.
Cosmos fails to extend the six-day recovery
Cosmos edges lower by 2% at the time of writing on Wednesday, halting the six consecutive days of recovery. The intraday pullback approaches the November 4 low at $2.346, close to the 50-day EMA at $2.321.
The momentum indicators on the daily chart are mixed amid the sudden shift of the ATOM price trend. The RSI is at 66, reversing from the overbought boundary, indicating a decline in buying pressure. Meanwhile, the MACD and signal line continue to extend the uptrend, suggesting that the prevailing bullish momentum remains intact.
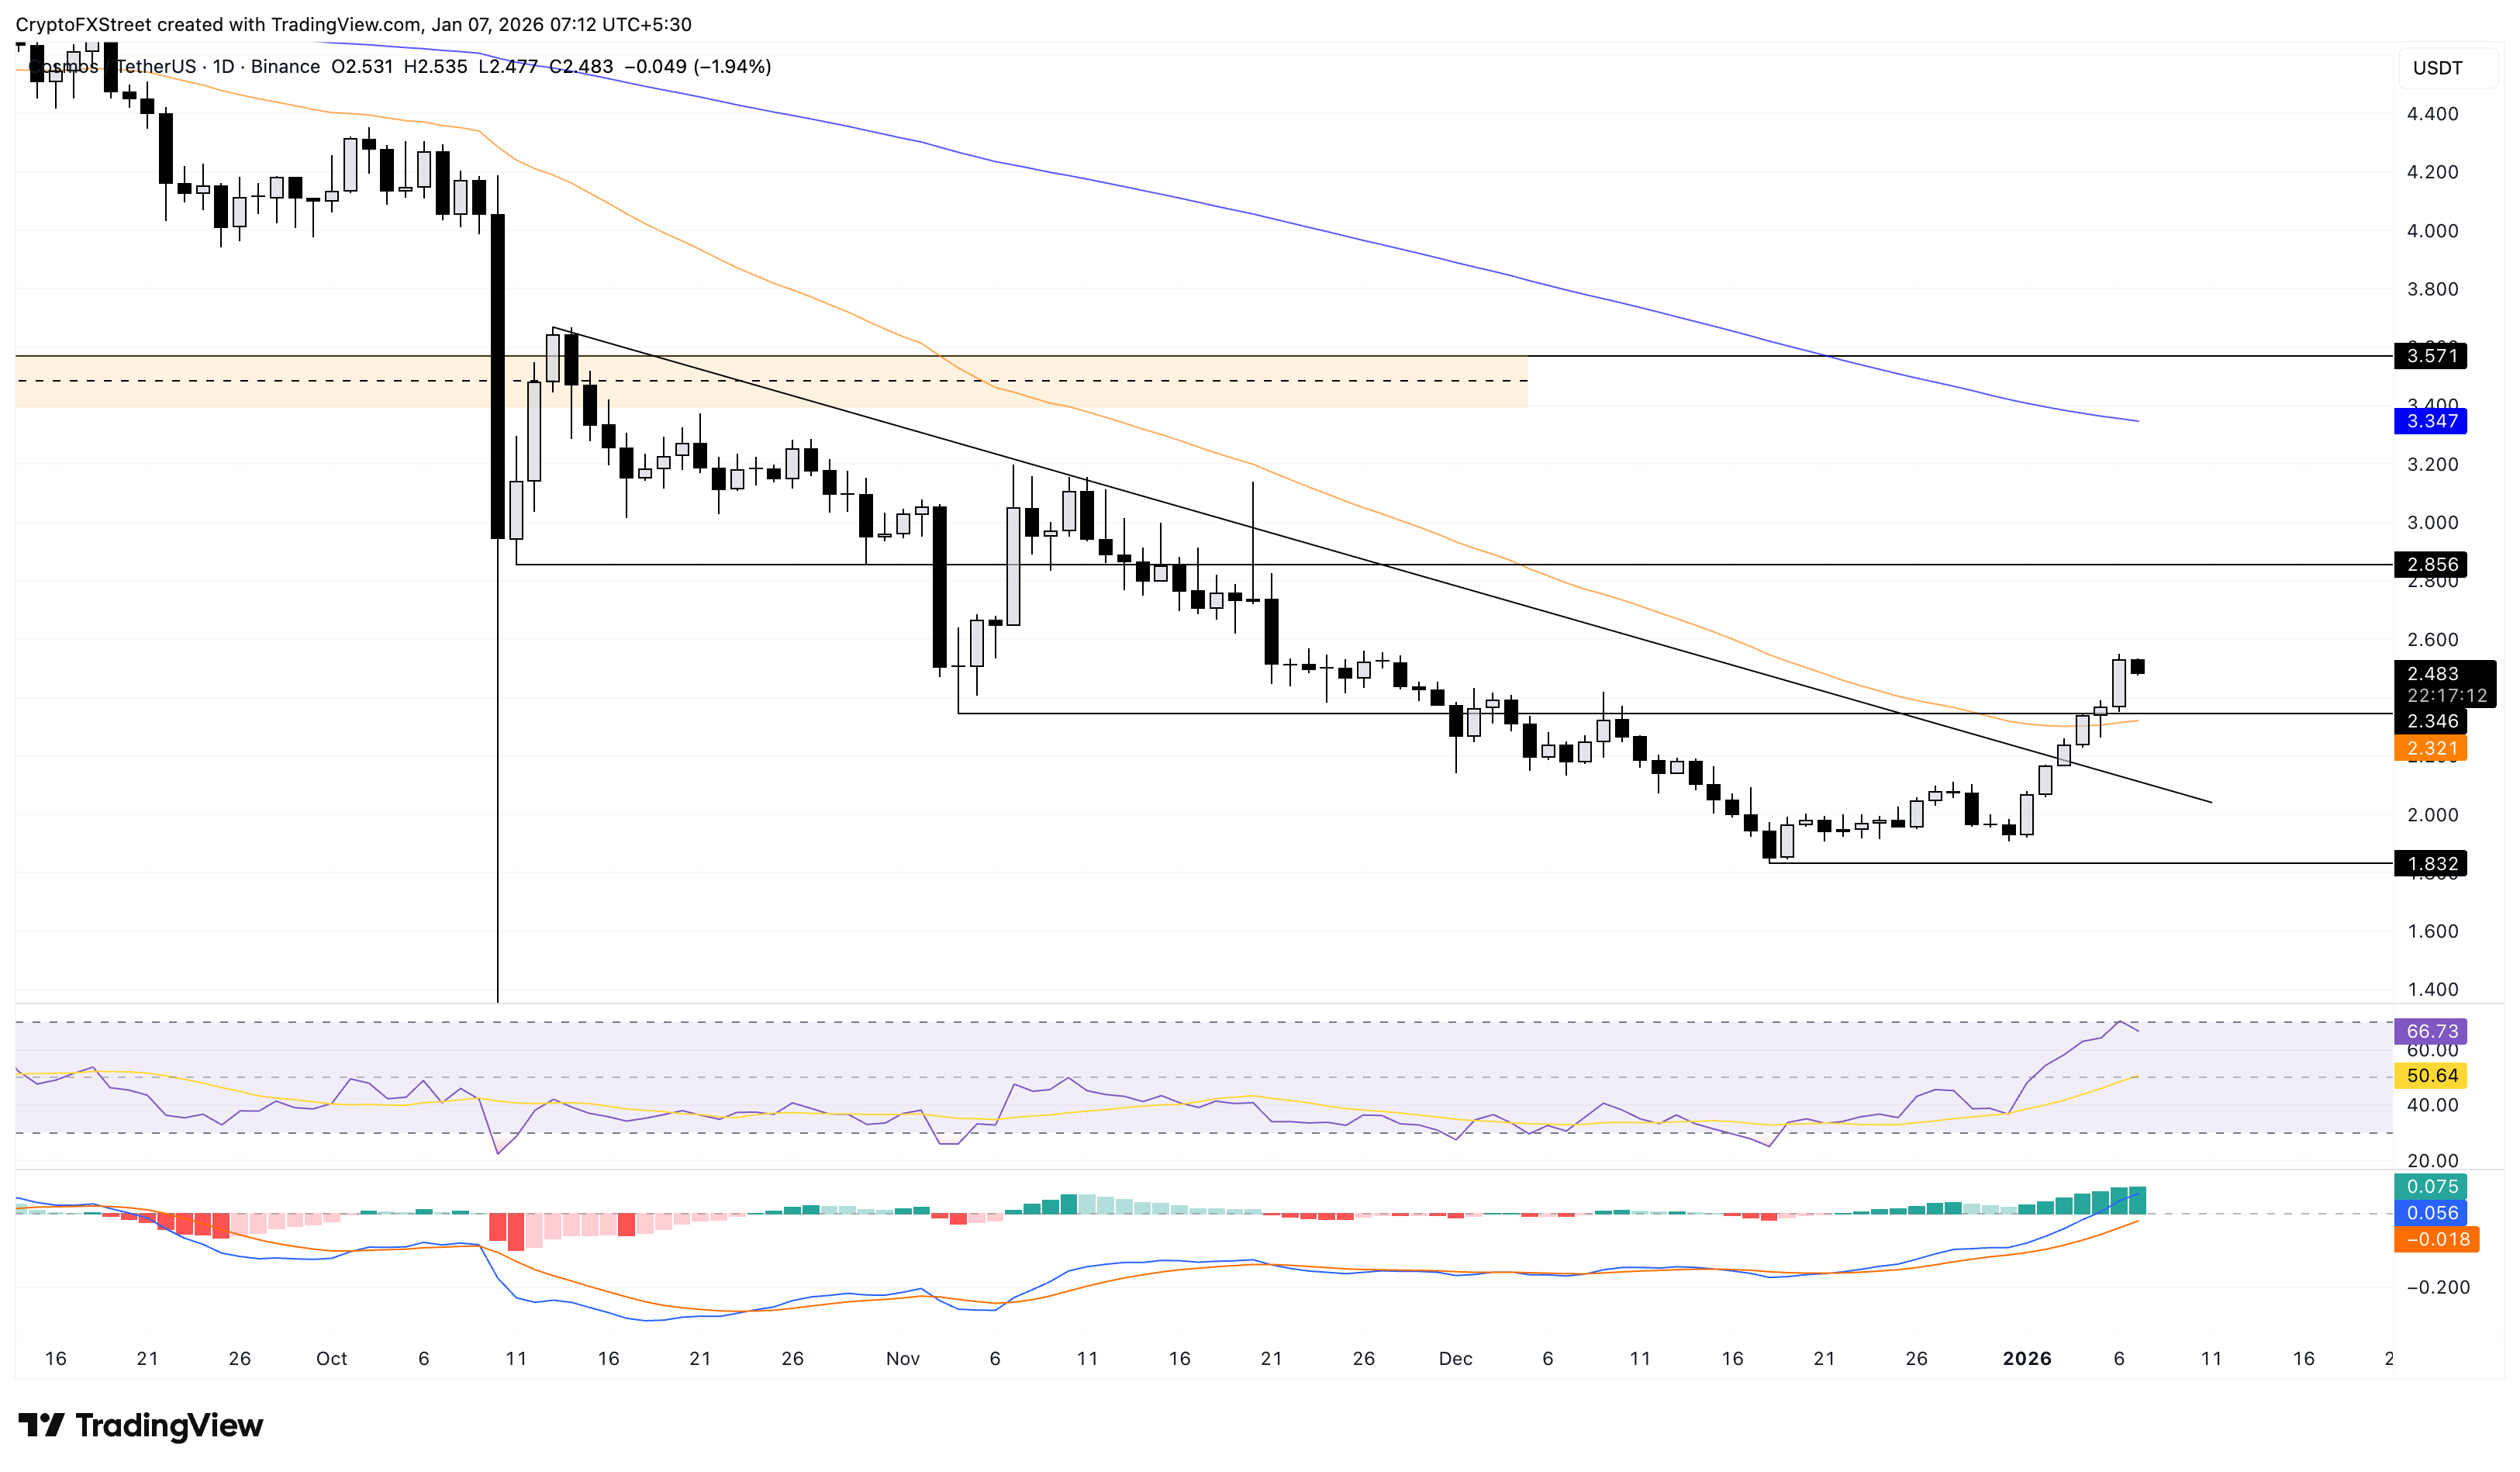
Looking up, the October 11 low at $2.856 serves as the immediate resistance level.
Bittensor’s recovery falls short of the $300 mark
Bittensor failed to extend the six-day recovery and fell short of the $300 mark. At the time of writing, TAO is down over 3% on Wednesday, approaching the 50-day EMA at $271, slightly above the $260 support level.
If TAO falls below $260, it could extend the decline to the $206 level, marked by the December 24 low.
Similar to Cosmos, the momentum indicators remain mixed, with the RSI at 62 reversing from near the overbought zone, while the MACD and signal line rise.
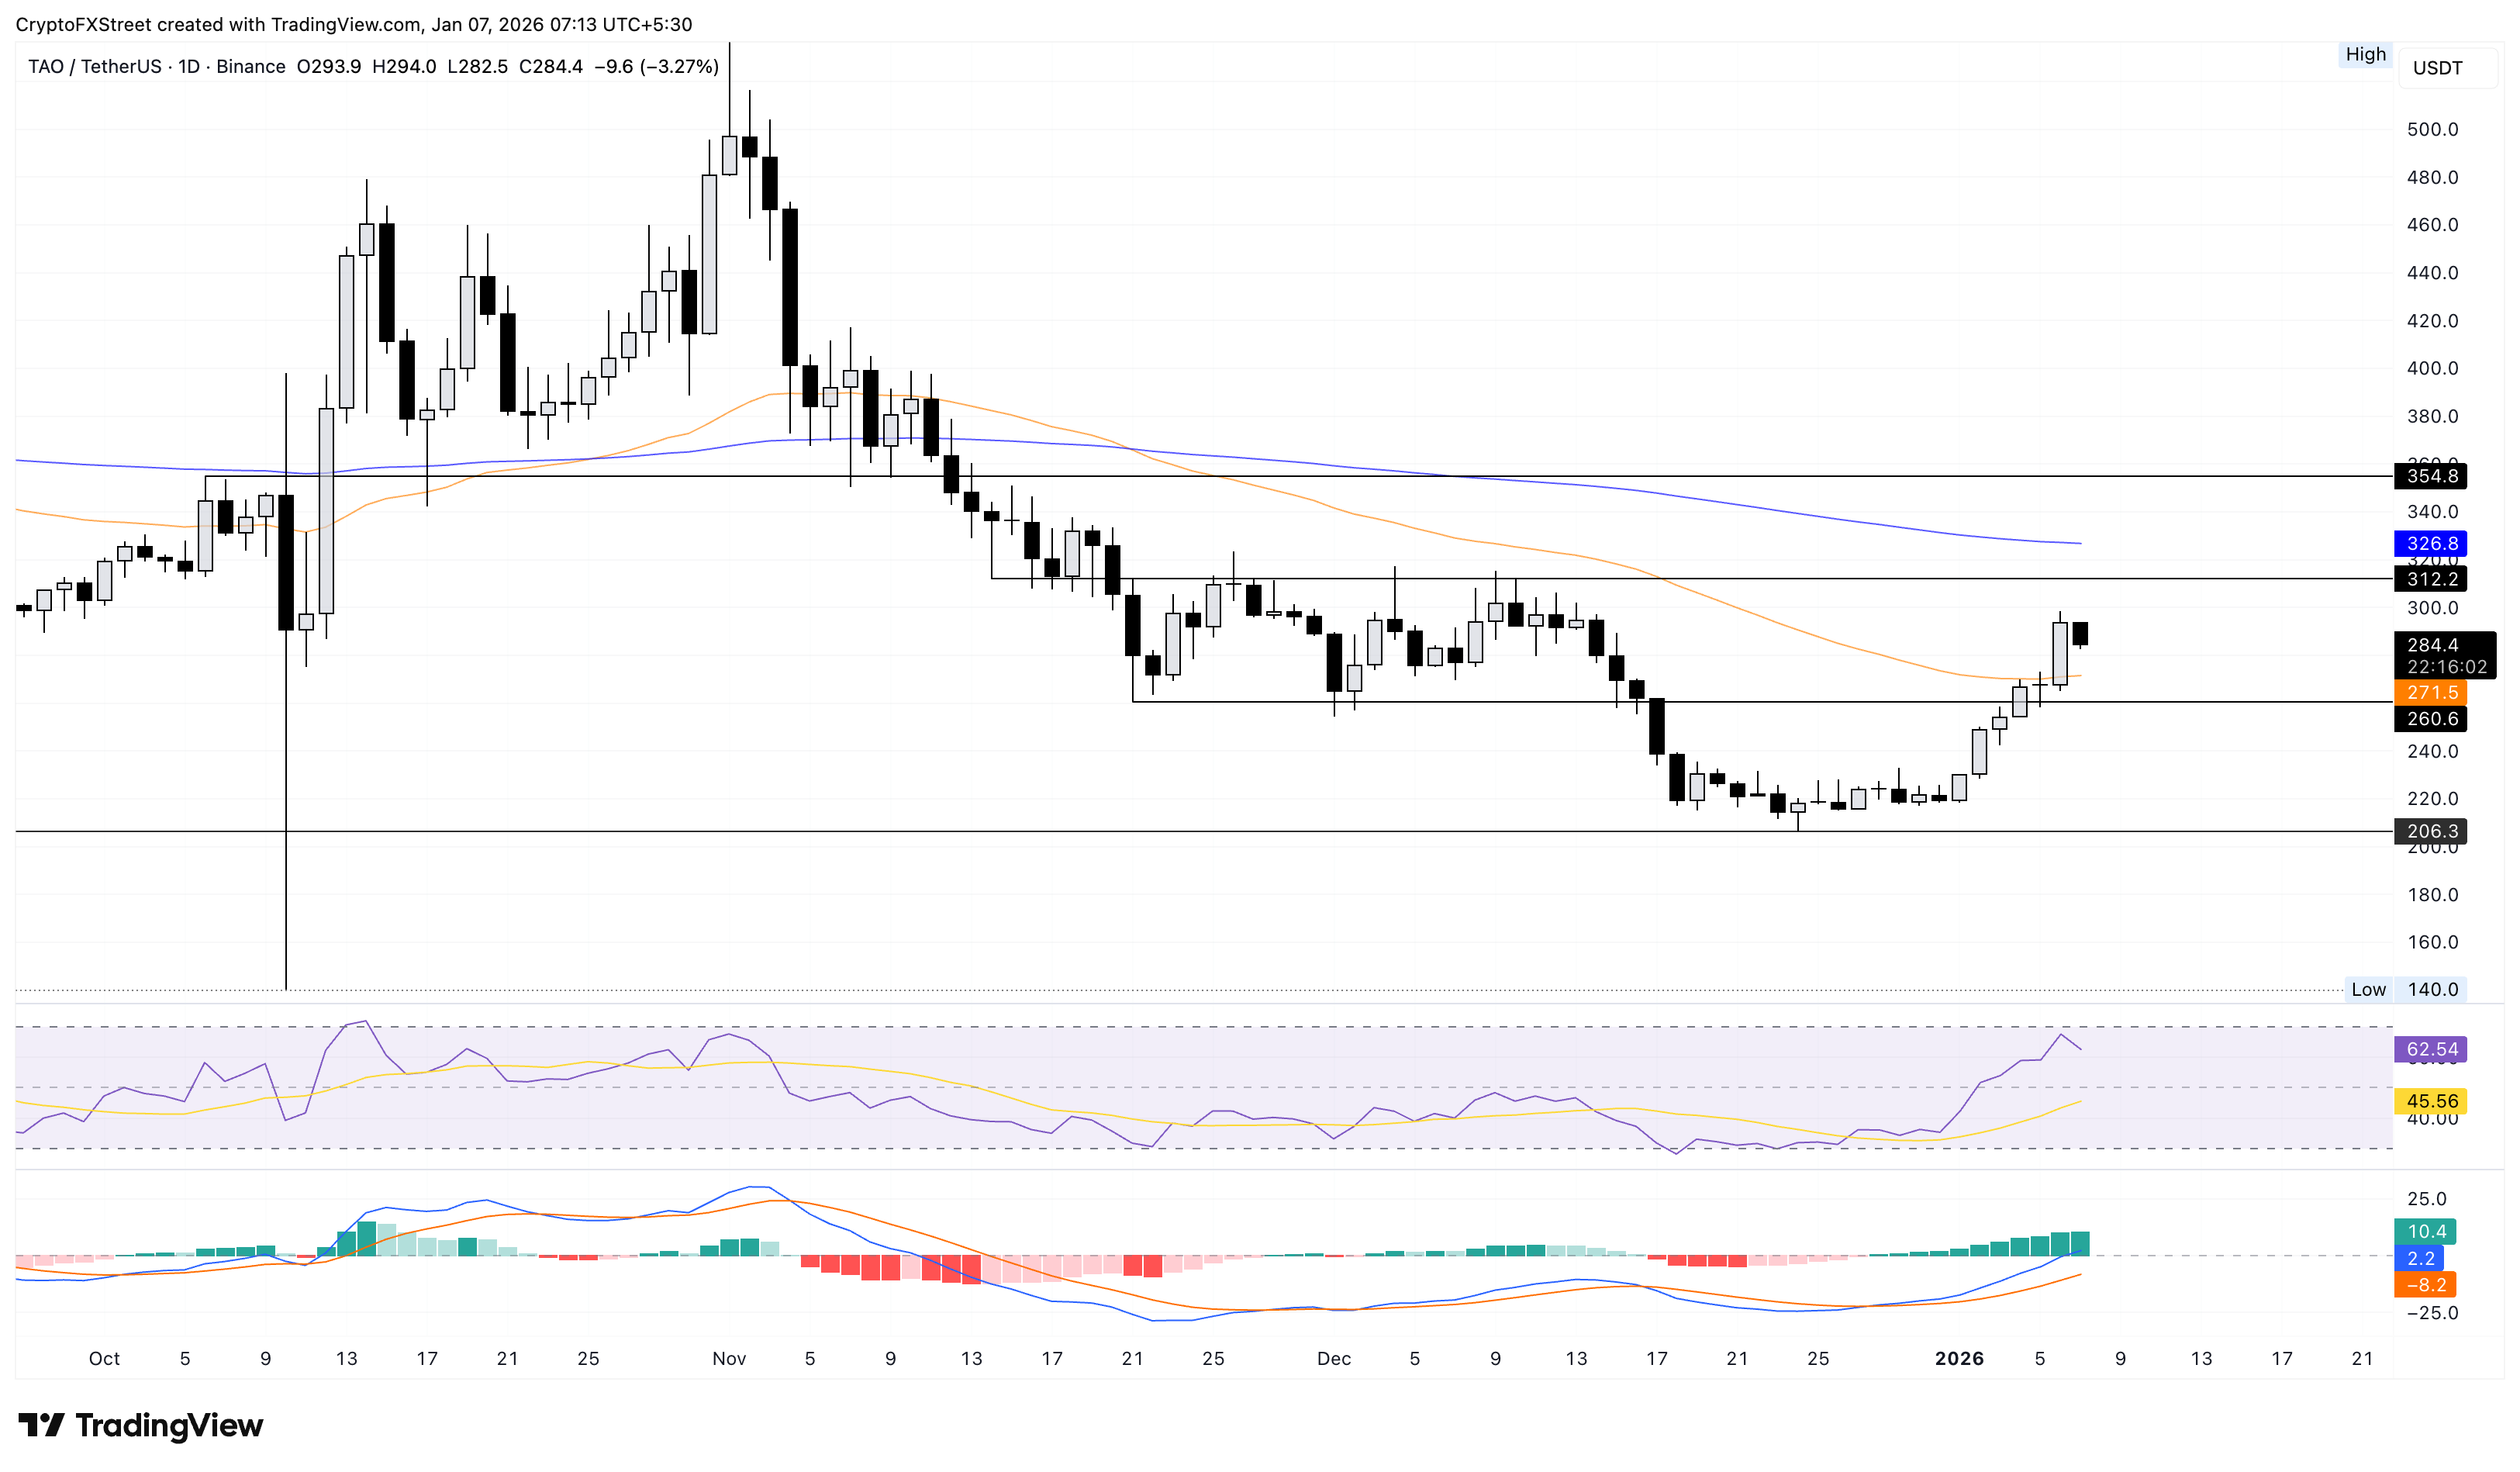
If TAO reclaims $300, it could struggle to exceed the $312 level, last tested on December 12.

FXStreet
يعتمد أكثر من مليون مستخدم على FXStreet للحصول على بيانات سوقية لحظية، وأدوات رسوم بيانية، ورؤى خبراء، وأخبار الفوركس. يساعد تقويمهم الاقتصادي الشامل والندوات التعليمية عبر الويب المتداولين على البقاء على اطلاع واتخاذ قرارات محسوبة. لدى FXStreet فريق يضم حوالي 60 محترفًا موزعين بين مقر برشلونة ومناطق عالمية مختلفة.
Read More


