
Trade The World
US Dollar Index Price Forecast: Could target ascending channel’s upper boundary near 99.00
بواسطة Akhtar Faruqui
تاريخ النشر: 26 Sep 2025 | تاريخ التعديل: 26 Sep 2025


POPULAR ARTICLES

The US Dollar Index (DXY), which measures the value of the US Dollar (USD) against six major currencies, is holding losses after two days of gains and trading around 98.40 during the Asian hours on Friday.
- US Dollar Index may target the initial barrier at the ascending channel's upper boundary around 98.80.
- The 14-day Relative Strength Index remains above the 50 level, reinforcing the bullish bias.
- The primary support lies at the 50-day EMA of 98.00.
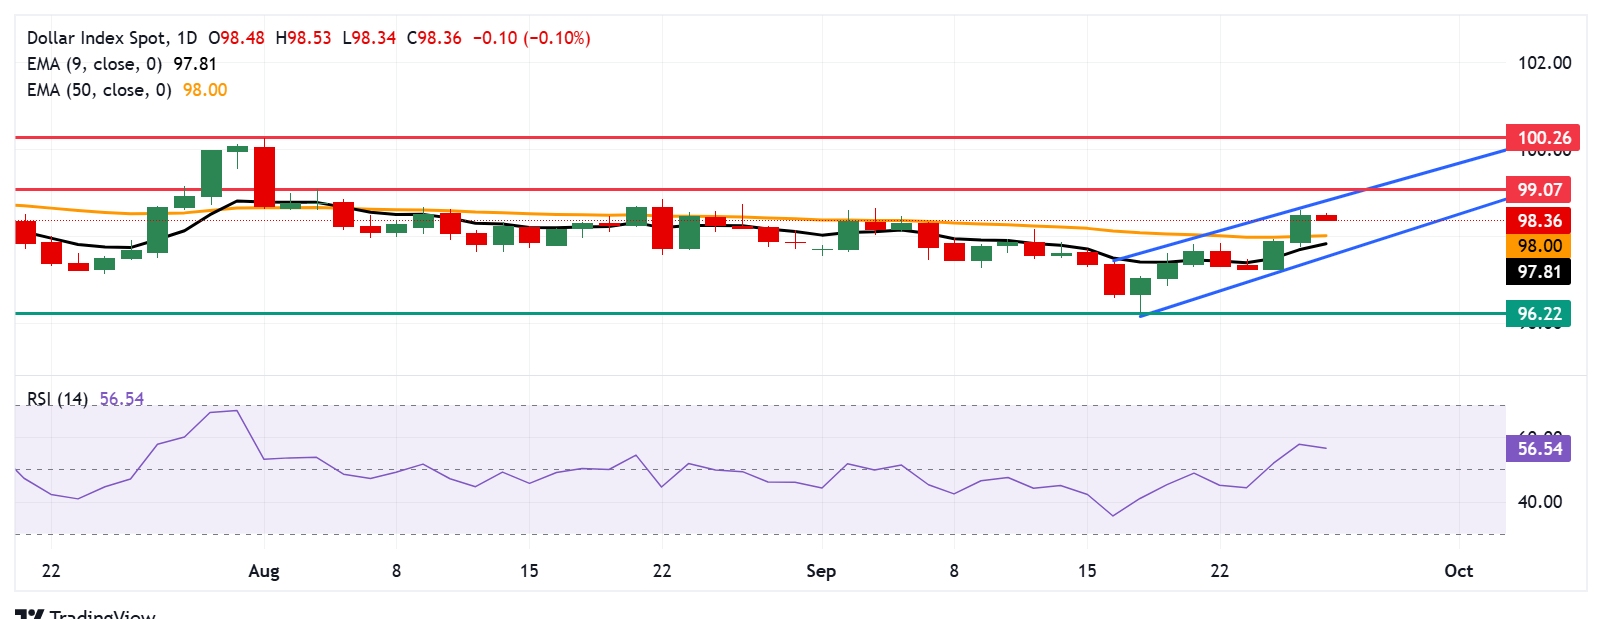
The US Dollar Index (DXY), which measures the value of the US Dollar (USD) against six major currencies, is holding losses after two days of gains and trading around 98.40 during the Asian hours on Friday. The technical analysis of the daily chart shows the dollar index moving upwards within the ascending channel pattern, suggesting that bullish bias prevails.
The short- and medium-term price momentums are strengthening as the DXY remains above the nine- and 50-day Exponential Moving Averages (EMAs). Additionally, the 14-day Relative Strength Index (RSI) is positioned above the 50 level, strengthening the bullish bias.
On the upside, the US Dollar Index may find its initial barrier at the upper boundary of the ascending channel around 98.80, followed by the eight-week high of 99.07, recorded on August 5. A break above this crucial resistance zone would strengthen the bullish bias and support the dollar index to approach the four-month high of 100.26, which was reached on August 1.
The US Dollar Index may find its primary support at the 50-day EMA of 98.00, followed by the nine-day EMA at 97.81 and the ascending channel’s lower boundary around 97.50. A break below this crucial support zone would weaken the bullish bias and put downward pressure on the DXY to navigate the region around the 96.22, the lowest since February 2022, reached on September 17.
US Dollar Index: Daily Chart
US Dollar Price Today
The table below shows the percentage change of US Dollar (USD) against listed major currencies today. US Dollar was the weakest against the Japanese Yen.
| USD | EUR | GBP | JPY | CAD | AUD | NZD | CHF | |
|---|---|---|---|---|---|---|---|---|
| USD | -0.11% | -0.05% | -0.13% | 0.07% | -0.12% | -0.01% | -0.08% | |
| EUR | 0.11% | 0.10% | 0.05% | 0.23% | 0.05% | 0.16% | 0.05% | |
| GBP | 0.05% | -0.10% | 0.04% | 0.13% | 0.04% | 0.06% | -0.08% | |
| JPY | 0.13% | -0.05% | -0.04% | 0.15% | -0.04% | 0.08% | -0.11% | |
| CAD | -0.07% | -0.23% | -0.13% | -0.15% | -0.19% | -0.05% | -0.21% | |
| AUD | 0.12% | -0.05% | -0.04% | 0.04% | 0.19% | 0.11% | -0.03% | |
| NZD | 0.01% | -0.16% | -0.06% | -0.08% | 0.05% | -0.11% | -0.03% | |
| CHF | 0.08% | -0.05% | 0.08% | 0.11% | 0.21% | 0.03% | 0.03% |
The heat map shows percentage changes of major currencies against each other. The base currency is picked from the left column, while the quote currency is picked from the top row. For example, if you pick the US Dollar from the left column and move along the horizontal line to the Japanese Yen, the percentage change displayed in the box will represent USD (base)/JPY (quote).

FXStreet
يعتمد أكثر من مليون مستخدم على FXStreet للحصول على بيانات سوقية لحظية، وأدوات رسوم بيانية، ورؤى خبراء، وأخبار الفوركس. يساعد تقويمهم الاقتصادي الشامل والندوات التعليمية عبر الويب المتداولين على البقاء على اطلاع واتخاذ قرارات محسوبة. لدى FXStreet فريق يضم حوالي 60 محترفًا موزعين بين مقر برشلونة ومناطق عالمية مختلفة.
Read More


