
Trade The World
USD/CHF Price Forecast: Sinks below 0.80 on weak NFP data
بواسطة Christian Borjon Valencia
تاريخ النشر: 6 Sep 2025 | تاريخ التعديل: 6 Sep 2025


POPULAR ARTICLES

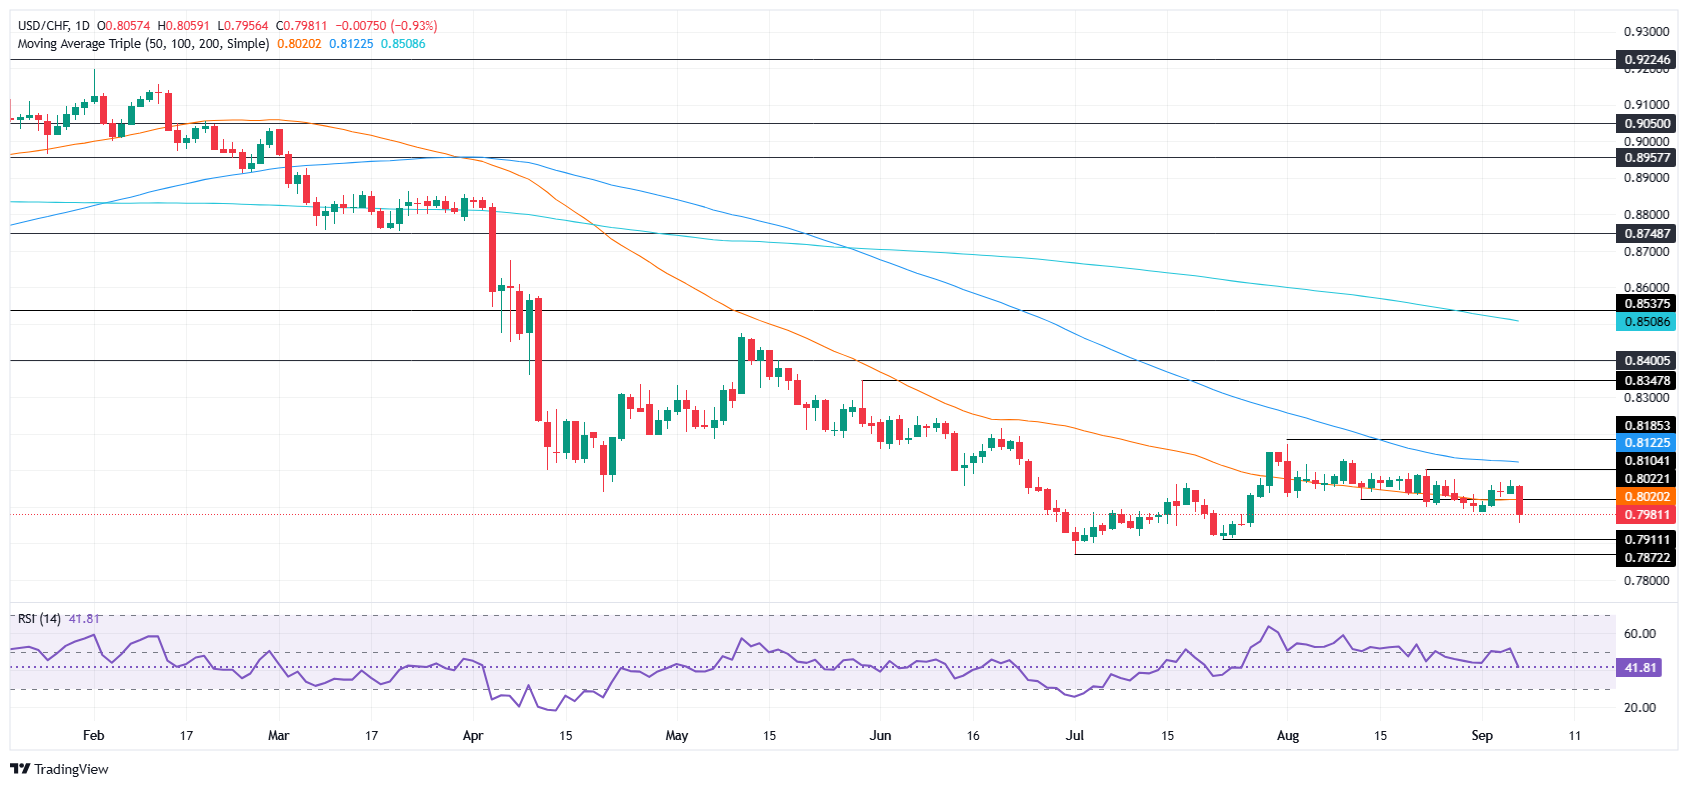
The USD/CHF extended its losses on Friday, tumbling below the 50-day Simple Moving Average (SMA) at 0.8020. The release of a worse than expected US Nonfarm Payrolls report, cemented the case for a Fed rate cut at the September meeting. At the time of writing, the pair trades at 0.7980, down 0.94%.
- USD/CHF breaks under 50-day SMA at 0.8020, closing below 0.8000 with momentum favoring further downside.
- Bears eye 0.7950 and July 23 low at 0.7911, with path open toward year-to-date trough at 0.7872.
- Buyers must reclaim 0.8000 and 50-day SMA to challenge resistance at 0.8047 and 100-day SMA at 0.8122.
The USD/CHF extended its losses on Friday, tumbling below the 50-day Simple Moving Average (SMA) at 0.8020. The release of a worse than expected US Nonfarm Payrolls report, cemented the case for a Fed rate cut at the September meeting. At the time of writing, the pair trades at 0.7980, down 0.94%.
USD/CHF Price Forecast: Technical outlook
Price action indicates that sellers reclaimed momentum, achieving a daily/weekly close below the 0.8000 figure. This reignited the chances for testing the year-to-date (YTD) low of 0.7872, reached on July 1.
Momentum indicates that bears are in control as depicted by the Relative Strength Index (RSI).
That said, if USD/CHF drops below 0.7950, this will expose July 23 low of 0.7911. A breach of the latter clears the path to test 0.7900, followed by the YTD low.
On the other hand, if buyers reclaim 0.8000, they must clear the 50-day SMA, before testing the 20-day SMA at 0.8047. Key resistance lies overhead at the 100-day SMA at 0.8122.
USD/CHF Price Chart – Daily
Swiss Franc Price This week
The table below shows the percentage change of Swiss Franc (CHF) against listed major currencies this week. Swiss Franc was the strongest against the Canadian Dollar.
| USD | EUR | GBP | JPY | CAD | AUD | NZD | CHF | |
|---|---|---|---|---|---|---|---|---|
| USD | -0.19% | -0.10% | 0.28% | 0.68% | -0.16% | -0.06% | -0.20% | |
| EUR | 0.19% | 0.09% | 0.40% | 0.89% | 0.03% | 0.15% | 0.00% | |
| GBP | 0.10% | -0.09% | 0.20% | 0.77% | -0.06% | 0.04% | -0.04% | |
| JPY | -0.28% | -0.40% | -0.20% | 0.47% | -0.44% | -0.31% | -0.43% | |
| CAD | -0.68% | -0.89% | -0.77% | -0.47% | -0.79% | -0.73% | -0.81% | |
| AUD | 0.16% | -0.03% | 0.06% | 0.44% | 0.79% | 0.10% | 0.02% | |
| NZD | 0.06% | -0.15% | -0.04% | 0.31% | 0.73% | -0.10% | -0.07% | |
| CHF | 0.20% | -0.01% | 0.04% | 0.43% | 0.81% | -0.02% | 0.07% |
The heat map shows percentage changes of major currencies against each other. The base currency is picked from the left column, while the quote currency is picked from the top row. For example, if you pick the Swiss Franc from the left column and move along the horizontal line to the US Dollar, the percentage change displayed in the box will represent CHF (base)/USD (quote).

FXStreet
يعتمد أكثر من مليون مستخدم على FXStreet للحصول على بيانات سوقية لحظية، وأدوات رسوم بيانية، ورؤى خبراء، وأخبار الفوركس. يساعد تقويمهم الاقتصادي الشامل والندوات التعليمية عبر الويب المتداولين على البقاء على اطلاع واتخاذ قرارات محسوبة. لدى FXStreet فريق يضم حوالي 60 محترفًا موزعين بين مقر برشلونة ومناطق عالمية مختلفة.
Read More


