學院合作夥伴


文章
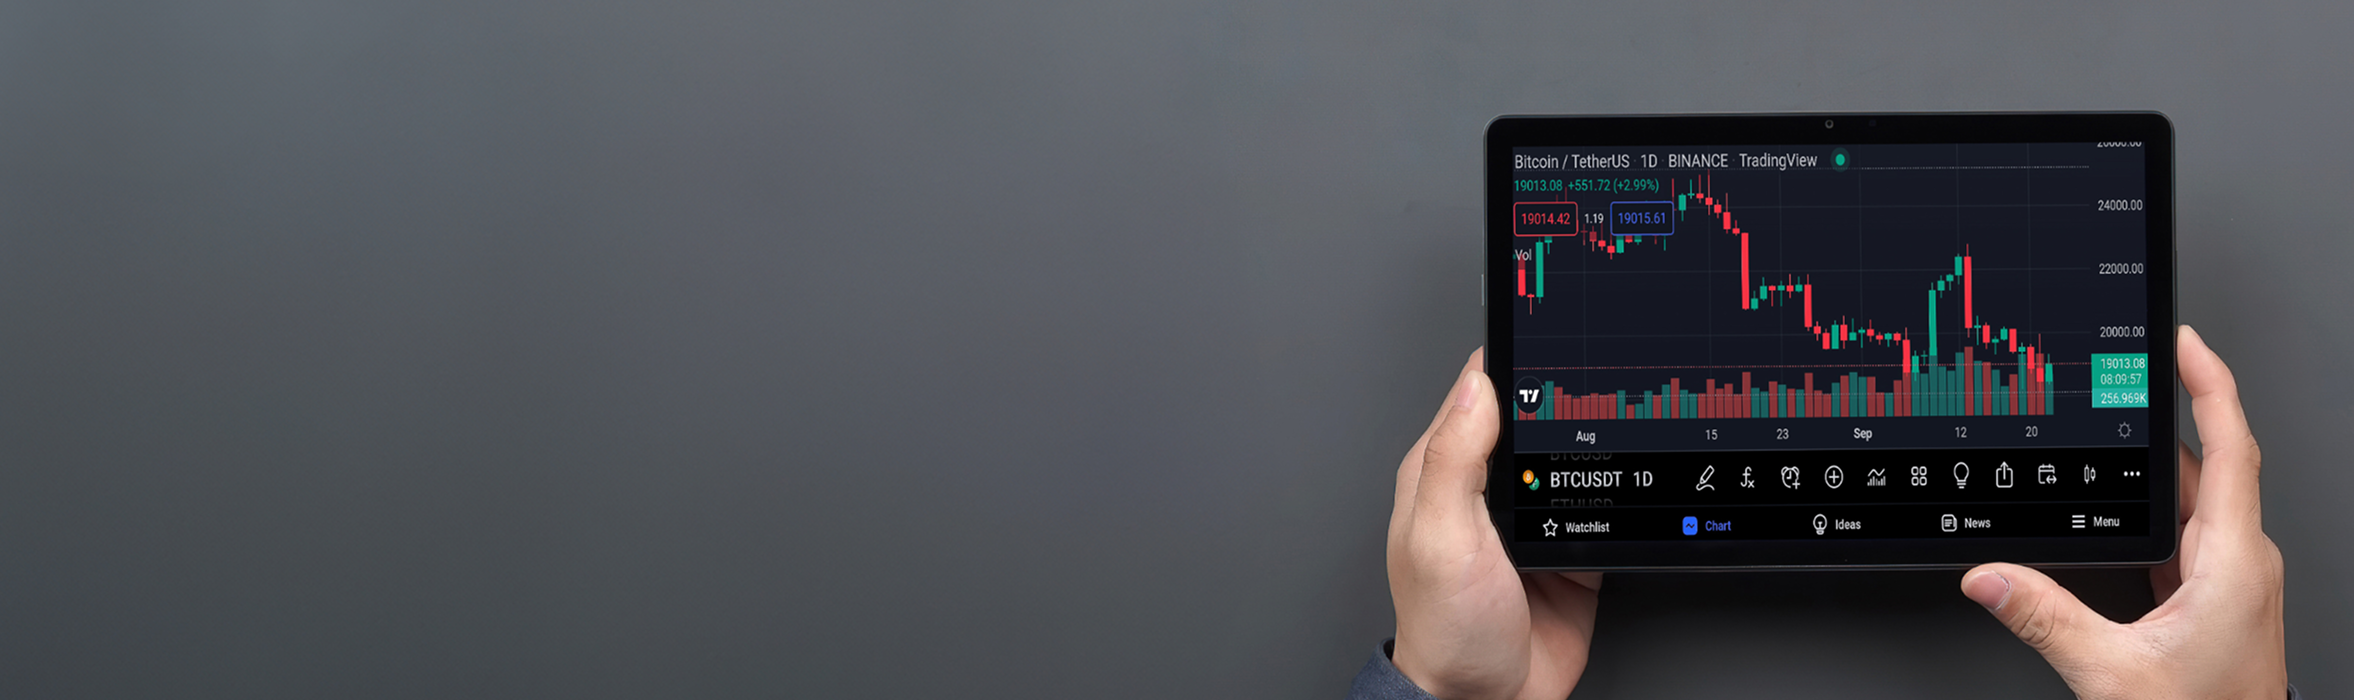
History Of Gold Prices In India
更新时间: 9 Oct 2025
Gold has always held a special place in India, not just as a symbol of wealth and culture, but also as an investment avenue. For Indian traders and investors, tracking the gold price history India is crucial to understanding how this precious metal performs over time. Over the last decade, gold has seen significant shifts influenced by global economic events, inflation trends, and currency fluctuations. By studying the past, traders can better anticipate potential future movements and make more informed trading decisions.
This article explores the gold price chart India 10 year performance, highlights the key drivers of its movement, and discusses the gold returns in last 10 years, which are all tailored to help beginner traders in India understand the bigger picture.
Gold Price Trends in India: The Last 10 Years
From 2014 to 2024, the gold price chart India 10 year history shows a steady upward trajectory with short-term volatility. In 2014, the average price of gold hovered around ₹28,000 per 10 grams. By 2020, gold had surged above ₹50,000, largely due to global uncertainty from the pandemic. As of 2024, gold continues to trade near record highs, reflecting its status as a safe-haven asset.
This consistent growth demonstrates why Indian households and traders view gold as a long-term store of value.
Key Global and Local Factors Influencing Gold Prices
Several global and domestic factors have contributed to the gold price history India:
Global Uncertainty
Events such as the US-China trade tensions and the COVID-19 pandemic played a major role in increasing global demand for gold. During times of crisis, investors tend to move away from risky assets and prefer safe-haven investments like gold, which pushed prices upward worldwide.
Currency Movements
The Indian Rupee’s performance against the US Dollar has a direct impact on domestic gold prices. When the Rupee weakens, importing gold becomes more expensive, which in turn raises the overall price of gold in India.
Inflation and Interest Rates
Gold has traditionally been viewed as a hedge against inflation, and rising inflation levels usually boost its appeal among investors. Additionally, changes in US Federal Reserve interest rates affect global sentiment, often leading to shifts in demand for gold.
Indian Demand
Local cultural traditions continue to drive strong demand for gold in India. Weddings, religious festivals, and family celebrations contribute to consistent purchases, cementing India’s position as one of the largest consumers of gold in the world.
Year-by-Year Breakdown of Gold Prices in India

Figure 1: Year-by-Year Breakdown of Gold Prices in India.
Here’s a simplified look at how gold moved each year in the last decade:
2014-2016: Prices ranged between ₹26,000–₹30,000 per 10 grams, showing moderate stability.
2017-2018: A gradual rise toward ₹32,000–₹34,000 levels, reflecting stronger global demand.
2019: Prices jumped to ₹38,000+ as trade wars and economic slowdown increased safe-haven buying.
2020: A landmark year—prices crossed ₹50,000 amid the pandemic and global uncertainty.
2021-2022: Fluctuations between ₹45,000–₹52,000 as markets adjusted to economic recovery and inflation concerns.
2023-2024: Gold consistently traded above ₹55,000, supported by strong retail demand and global economic risks.
This journey shows how both global and domestic factors shaped the gold price chart India 10 year outlook.
Gold Returns in the Last 10 Years: What Traders Should Know
When we calculate the gold returns in last 10 years, gold has offered over 90–100% appreciation between 2014 and 2024. This means that investors who bought gold in 2014 nearly doubled their stake by 2024.
For Indian traders, this underlines why gold remains a reliable hedge against inflation, market volatility, and currency depreciation.
What the 10-Year Chart Reveals for Indian Traders
Looking at the gold price history India, two important insights stand out:
Long-term Uptrend
Despite experiencing short-term dips over the years, gold has consistently delivered strong long-term returns. This steady upward movement highlights why many Indian investors and traders continue to see gold as a dependable asset for wealth preservation.
Safe-Haven Appeal
During times of crisis, whether caused by global economic slowdowns or unexpected events, gold prices have surged. This reinforces its reputation as a safe-haven asset that investors turn to when uncertainty dominates the markets.
For traders, this reinforces the importance of analyzing long-term charts before making short-term trading decisions.
How Traders Can Use Gold Price History to Plan Ahead
Studying the gold price chart India 10 year allows traders to identify long-term support and resistance levels that shape price movements. By recognizing these key zones, traders can better anticipate potential reversals or continuations in the market and refine their strategies accordingly. It also helps them understand how major global events, such as economic crises or policy changes, directly influence domestic gold prices.
In addition, reviewing the 10-year chart assists traders in planning more effective entry and exit points for trading contracts or CFDs. Beyond timing trades, it also highlights the importance of balancing risk by diversifying portfolios with precious metals, ensuring stability even when other asset classes face uncertainty.
TMGM: Helping You Trade Precious Metals in India
At TMGM, traders in India can access advanced tools to trade gold and other precious metals with confidence. TMGM provides:
Competitive Spreads and Deep Liquidity: Trade gold with minimal costs.
Global Market Access: Benefit from exposure to gold and other commodities.
Trusted Regulation: TMGM is regulated by multiple international financial authorities, ensuring a safe trading environment.
Educational Resources: Learn more through the TMGM Academy.
Ready to experience gold trading with TMGM?
Open a Demo Account to practice risk-free.
Or start real trading with a Live Account.
Explore TMGM’s Precious Metals Trading for more opportunities.
今日更明智地進行交易


加入超過100萬客戶,使用我們屢獲殊榮的交易平台
1
申請真實
賬戶
賬戶
2
為您的
賬戶注資
賬戶注資
3
立即開始
交易
交易
立即註冊
為你推薦


本網站所提供的信息僅為一般性信息且並不包含任何個人財務建議。在使用本網站信息之前,請您根據自身的目標、財務狀況和需求考慮該信息的適用性。保證金外匯和差價合約交易涉及高風險,未必適合所有投資者。您可能會在交易時遇到損失超過初始入金金額的情況。您並不擁有合約標的資產的所有權和收益權。我們建議您尋求專業建議,以確保您在交易之前全面瞭解所涉及的風險。在決定本網站上所提供的金融產品之前,請仔細閱讀我們的用戶條款、風險提示、隱私協議以及其他相關的披露文件。本網站提供的任何產品與服務不適用於美國地區居民。
TMGM 是由多家金融監管機構授權。
TMGM 集團下的 Trademax Australia Limited 公司(交易名稱為TMGM),是由澳大利亞證券和投資委員(ASIC)監管的金融服務公司,金融服務牌照號為 436416,公司地址為 Level 28, One International Tower, 100 Barangaroo Avenue, 2000 Sydney, NSW Australia.
郵箱:support@tmgm.com.au
TMGM 集團下的 Trademax Global Limited公司(交易名稱為TMGM),是由瓦努阿圖金融服務委員會(VFSC)監管的金融服務公司,金融牌照號為 40356,註冊地址為 1276, Kumul Highway, Port Vila, Vanuatu, Republic of Vanuatu.
郵箱:support@tmgm.com
Trademax Global Markets (SE) Limited, trading as TMGM, is authorized and regulated by the Financial Services Authority (FSA) of Seychelles, with license number SD224. The company is registered at Office No 13, Providence Estate ABIS Centre, Mahe, Seychelles.
Email: support@tmgm.com
TMGM集團下的Trademax Global Markets (International) Pty Ltd公司(交易名稱為TMGM),是由毛里求斯金融服務委員會監管的金融服務公司. 牌照號為 GB22201012,註冊地址為33, Edith Cavell Street C/o IQ EQ Fund Services (Mauritius) Ltd Port Louis, 11324 Mauritius.
郵箱:support@tmgm.com
版權所有 © TMGM。保留所有權利