
Trade The World
Cardano Price Forecast: ADA gains early New Year momentum, bulls target falling wedge breakout
作者 Manish Chhetri
發布日期: 2 Jan 2026 | 修改日期: 2 Jan 2026


POPULAR ARTICLES

Cardano (ADA) kicks off the New Year on a positive note and is extending gains, trading above $0.36 at the time of writing on Friday. Improving on-chain and derivatives data point to growing bullish interest, while the technical outlook keeps an upside breakout in focus.
- Cardano extends its gains on Friday after rallying nearly 7% the previous day.
- On-chain and derivatives data indicate improving sentiment, with large whale orders, positive funding rates, and buy-side dominance.
- Technical outlook suggests ADA is attempting to break out of falling wedge, with immediate resistance at $0.42.
Cardano (ADA) kicks off the New Year on a positive note and is extending gains, trading above $0.36 at the time of writing on Friday. Improving on-chain and derivatives data point to growing bullish interest, while the technical outlook keeps an upside breakout in focus.
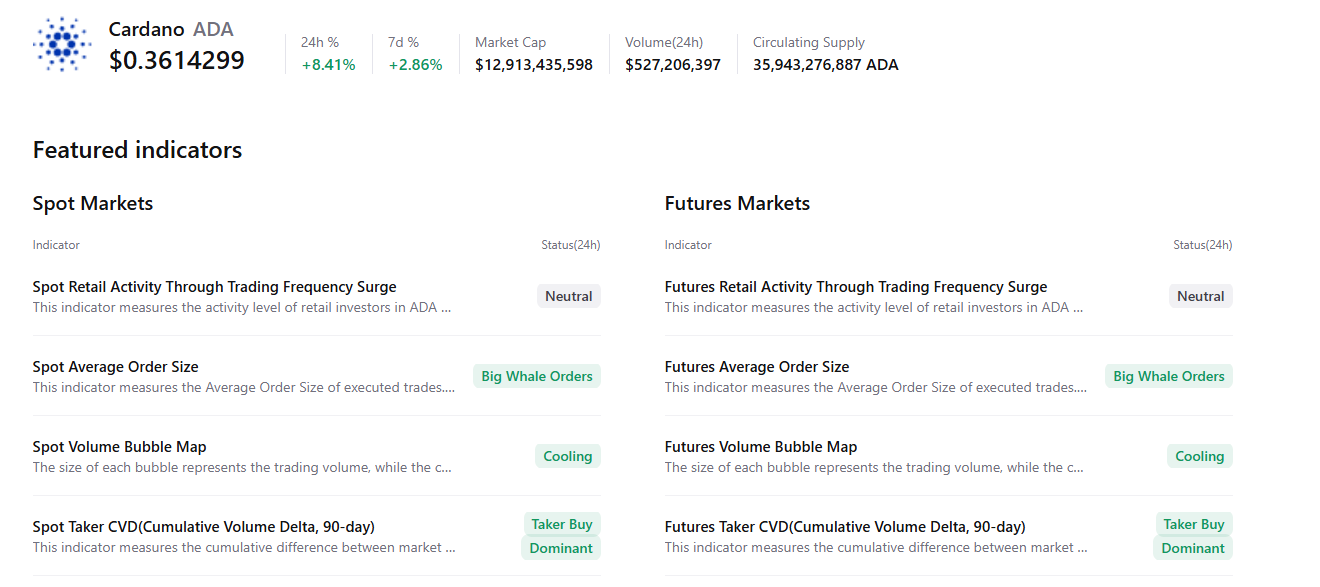
Cardano on-chain and derivatives data show bullish bias
CryptoQuant’s summary data points to a bullish outlook, as Cardano’s spot and futures markets show large whale orders, cooling conditions, and buy-side dominance. All these factors signal an improving sentiment among traders, hinting at a potential bullish breakout in the upcoming days.
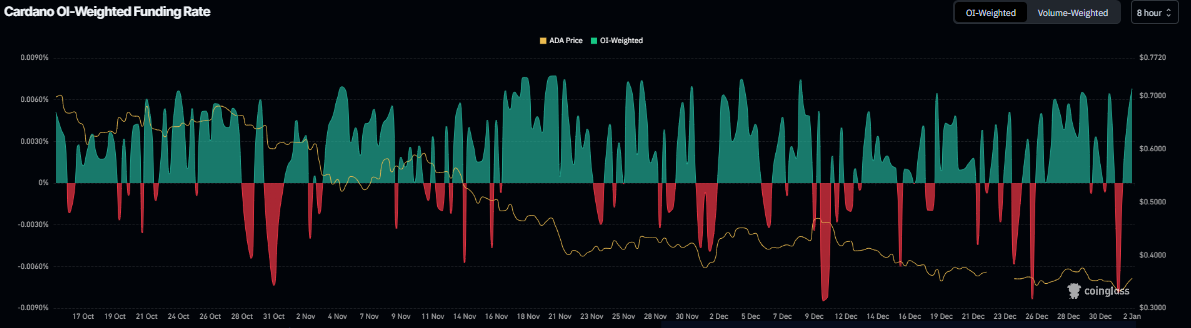
Additionally, Cardano’s funding rate data indicates a potential rally. According to Coinglass’s OI-Weighted Funding Rate data, the number of traders betting that the price of Cardano will slide further is lower than those anticipating a price increase.
The metric flipped to a positive rate on Thursday and stands at 0.0068% on Friday, indicating that longs are paying shorts. Historically, as shown in the chart below, when the funding rates have flipped from negative to positive, Cardano’s price has rallied sharply.
Cardano Price Forecast: New Year brings fresh optimism as ADA eyes falling wedge breakout
Cardano price was rejected from the upper trendline of the falling wedge pattern (formed by connecting multiple highs and lows with two trendlines since mid-October) on Monday and declined nearly 10% by Wednesday. However, ADA recovered by 6.9% on Thursday and is nearly at the upper trendline boundary as of Friday.
If ADA breaks out of the falling wedge pattern, it could extend the rally toward the next immediate resistance at $0.42, its 50-day Exponential Moving Average (EMA).
The Relative Strength Index (RSI) on the daily chart reads 43, pointing upward toward the neutral level of 50, indicating fading bearish momentum. For the bullish momentum to be sustained, the RSI must move above the neutral level. Meanwhile, the Moving Average Convergence Divergence (MACD) indicator showed a bullish crossover, which remains intact, supporting a slightly bullish view.
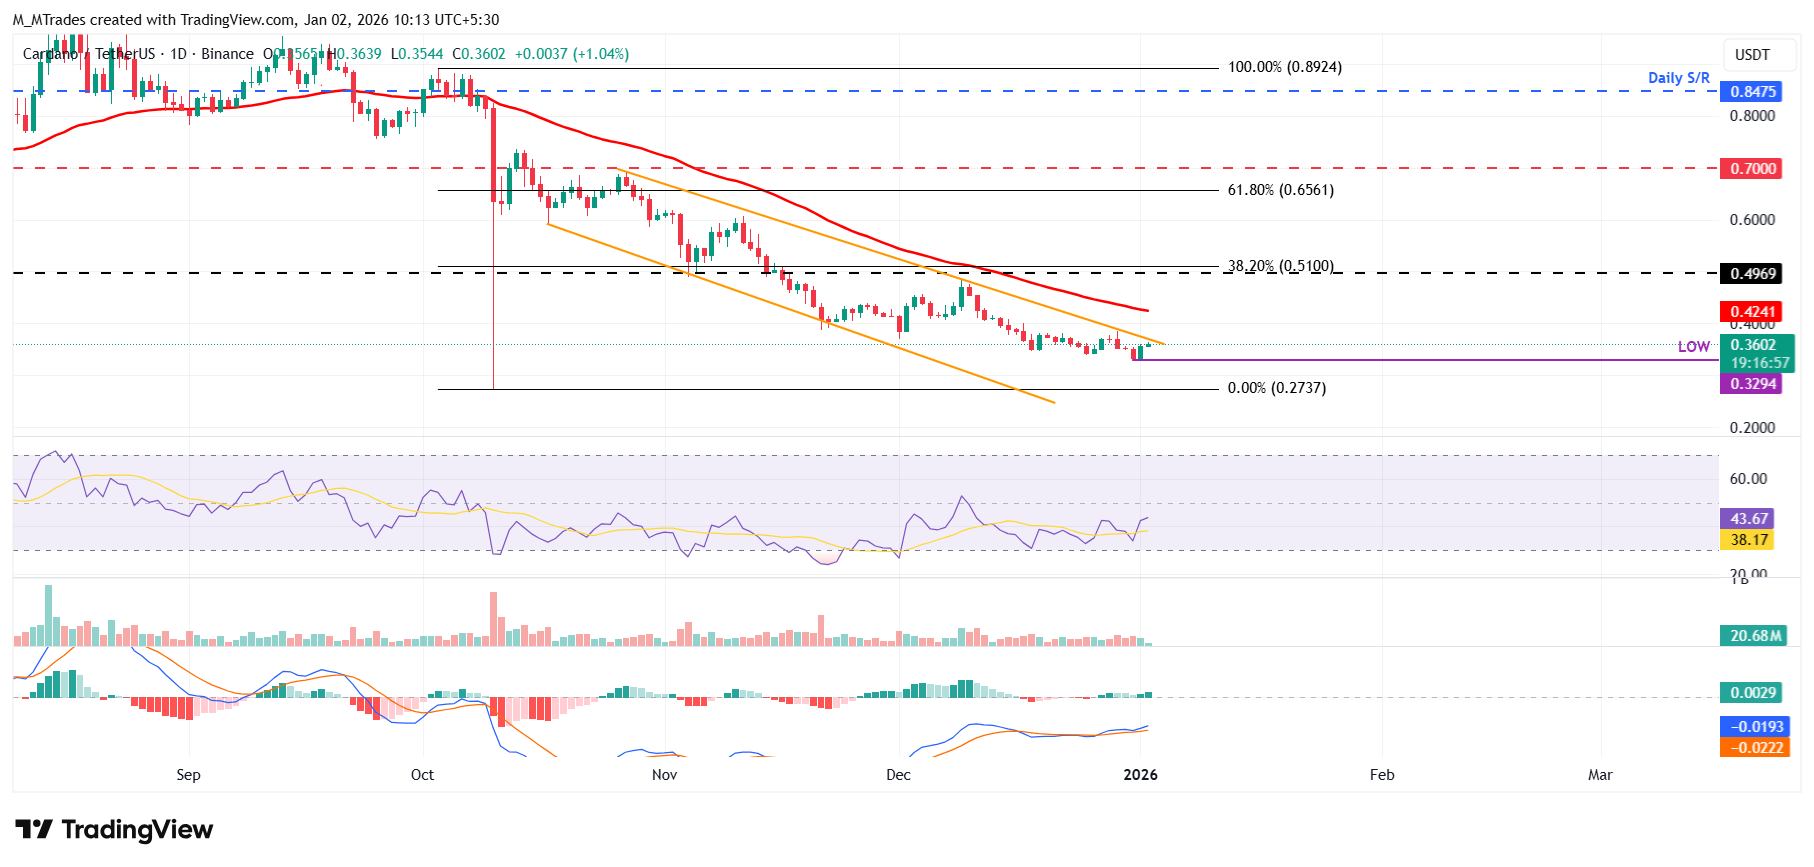
However, if ADA corrects, it could extend the decline toward Wednesday’s low of $0.32.

Acuity Trading
Acuity Trading 是一家成立於 2013 年、總部位於倫敦的金融科技公司,專注於 AI 驅動的另類數據與情緒分析,用於交易與投資。他們以可視化新聞與情緒工具革新線上交易體驗,並持續以最新 AI 研究與技術提供可產生阿爾法的另類數據與高度互動的交易工具。
Read More


