
Trade The World
Chainlink Price Forecast: LINK nears key support as profit-taking rises, but dip-buying emerges
作者 Manish Chhetri
發布日期: 25 Sep 2025 | 修改日期: 25 Sep 2025


POPULAR ARTICLES

Chainlink (LINK) price is nearing the key support zone, trading below $22 on Thursday as selling pressure from profit-taking intensifies.
- Chainlink price approaches its key support zone, with a firm close below potentially triggering a deeper correction.
- LINK’s Net Profit/Loss (NPL) chart indicates that holders are realizing profits, which increases short-term selling pressure.
- Despite this, exchange netflows recorded their highest outflow, suggesting some investors are accumulating the dip.
Chainlink (LINK) price is nearing the key support zone, trading below $22 on Thursday as selling pressure from profit-taking intensifies. While on-chain data highlight short-term bearishness, strong exchange outflows signal that some investors are accumulating, pointing to a mix of caution and optimism in the market.
Chainlink holders realized profits
Santiments’ Network Realized Profit/Loss (NPL) metric indicates that Chainlink holders are booking some profits after the price dips this week.
As shown in the chart below, the metric experienced a strong spike on Monday and Tuesday, indicating that holders are, on average, selling their bags at a significant profit, thereby increasing the selling pressure.
 [09-1758778856807-1758778856821.54.53, 25 Sep, 2025].png)
LINK NPL chart. Source: Santiment
Some signs of optimism
Despite some holders’ profit-taking activity, investors continue to buy the dips. CryptoQuant Exchange Netflow at all exchange metrics shows a negative netflow of 15,133 on Monday, the highest outflow since its launch. This negative flow indicates that investors are withdrawing LINK tokens from exchange wallets, which is generally a bullish sign, as investors are likely sending LINK outside for storage.
 - All Exchanges (1)-1758778896478-1758778896480.png)
Chainlink Echnage Netflow chart. Source: CryptoQuant
Beyond dip-buying activity, optimism around Chainlink is also supported by its expanding partnerships and ongoing ecosystem developments.
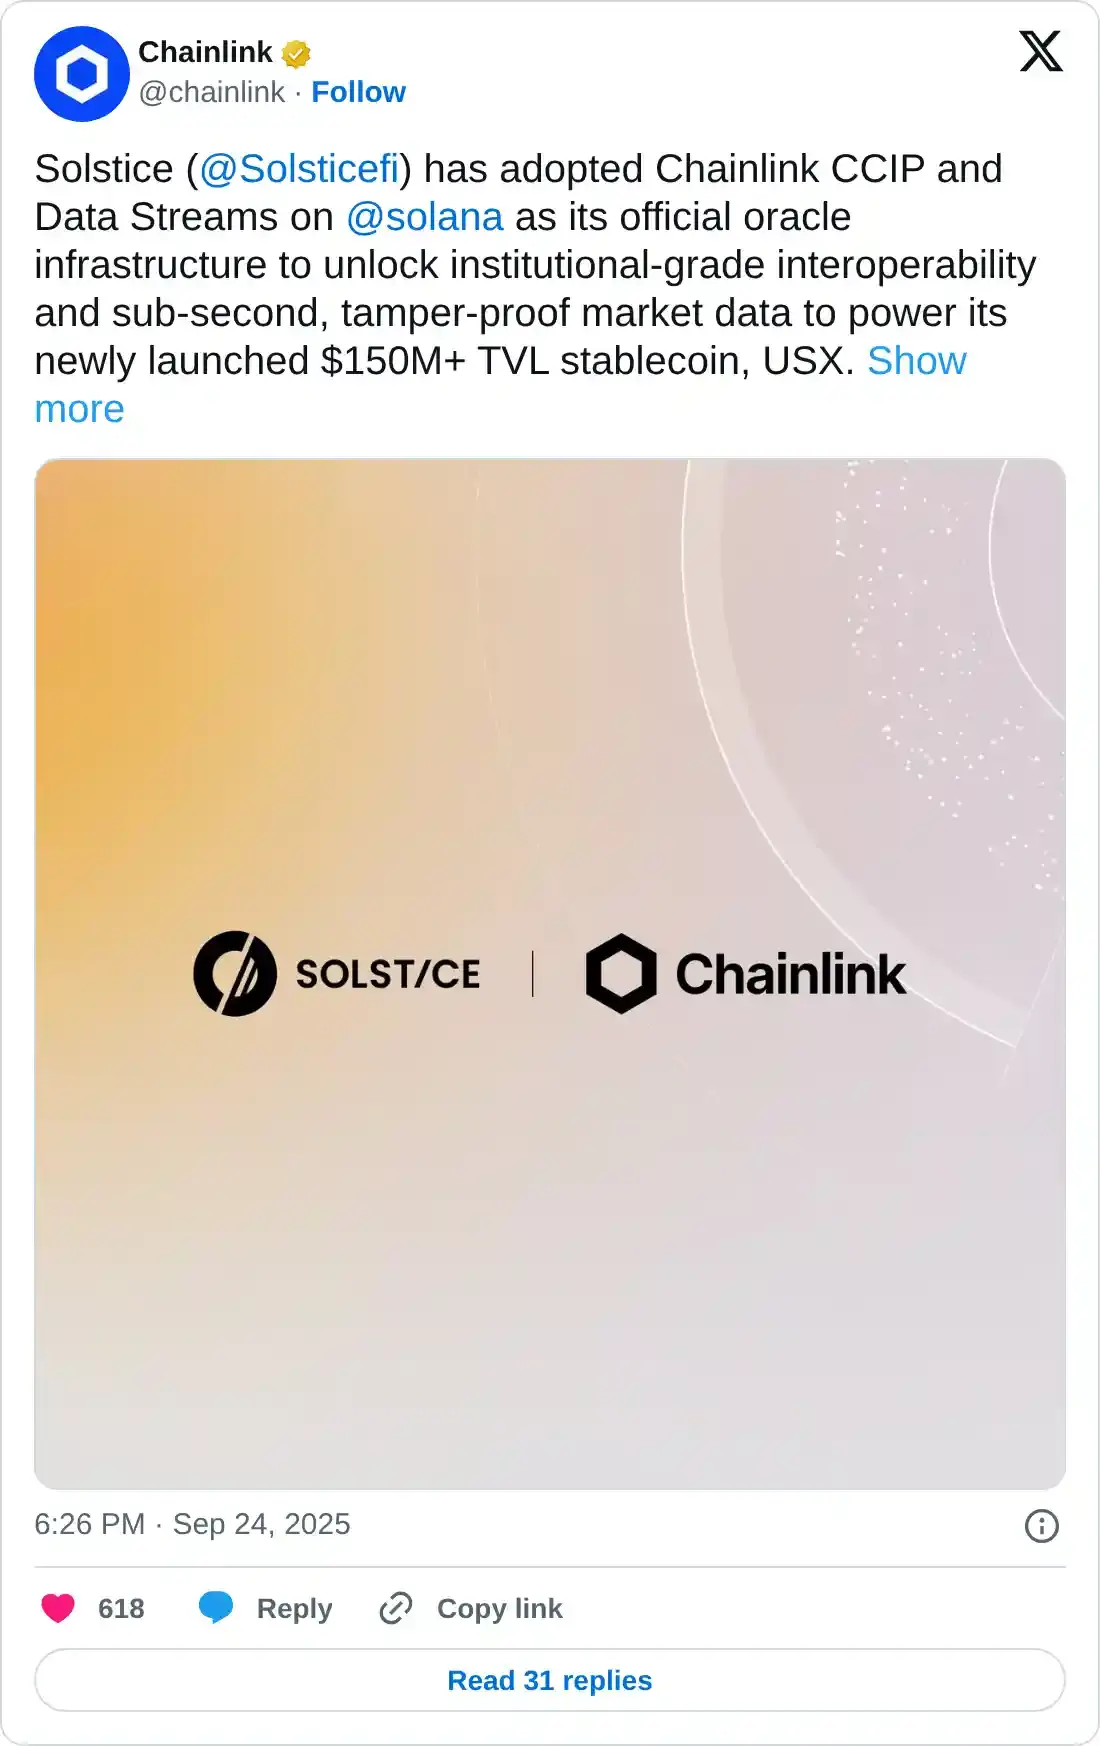
On Wednesday, Solstice Finance, the synthetic stablecoin and yield-generating protocol, announced a strategic collaboration with Chainlink, Ceffu, Copper, and Arcanum designed to strengthen Solstice’s infrastructure, cross-chain compatibilities, settlement opportunities, and market reach.
During the same period, Crypto Finance, part of Deutsche Börse Group, went live with Chainlink Proof of Reserve.
“With Chainlink’s technology, we can provide investors with verifiable information on reserves while maintaining the highest standards of security and operational integrity,” said Stijn Vander Straeten, CEO of Crypto Finance, on the press release.
These ongoing developments and partnerships highlight the rising adoption and wider acceptance of Chainlink, which suggests a bullish picture for the native token LINK in the long term.
Chainlink Price Forecast: LINK nears key support zone
Chainlink price fell by more than 5% on Monday and closed below its daily support level at $22.05. On Tuesday, it faced rejection from the daily level at $22.05 and declined slightly. At the time of writing on Thursday, it continues to trade in red, nearing the ascending trendline (drawn by connecting multiple lows since early July).
If LINK breaks below the ascending trendline, it could extend the decline toward the 50% price retracement level at $19.40.
Sideline investors looking for buying opportunities could do so between $19.40 and the weekly support at $18.81, which roughly coincides with the 200-day EMA.
The Relative Strength Index (RSI) on the daily chart reads 38, which is below its neutral level of 50 and is nearing oversold conditions. Additionally, the Moving Average Convergence Divergence (MACD) also showed a bearish crossover last week, signaling a sell and indicating bearish momentum and a downward trend ahead.
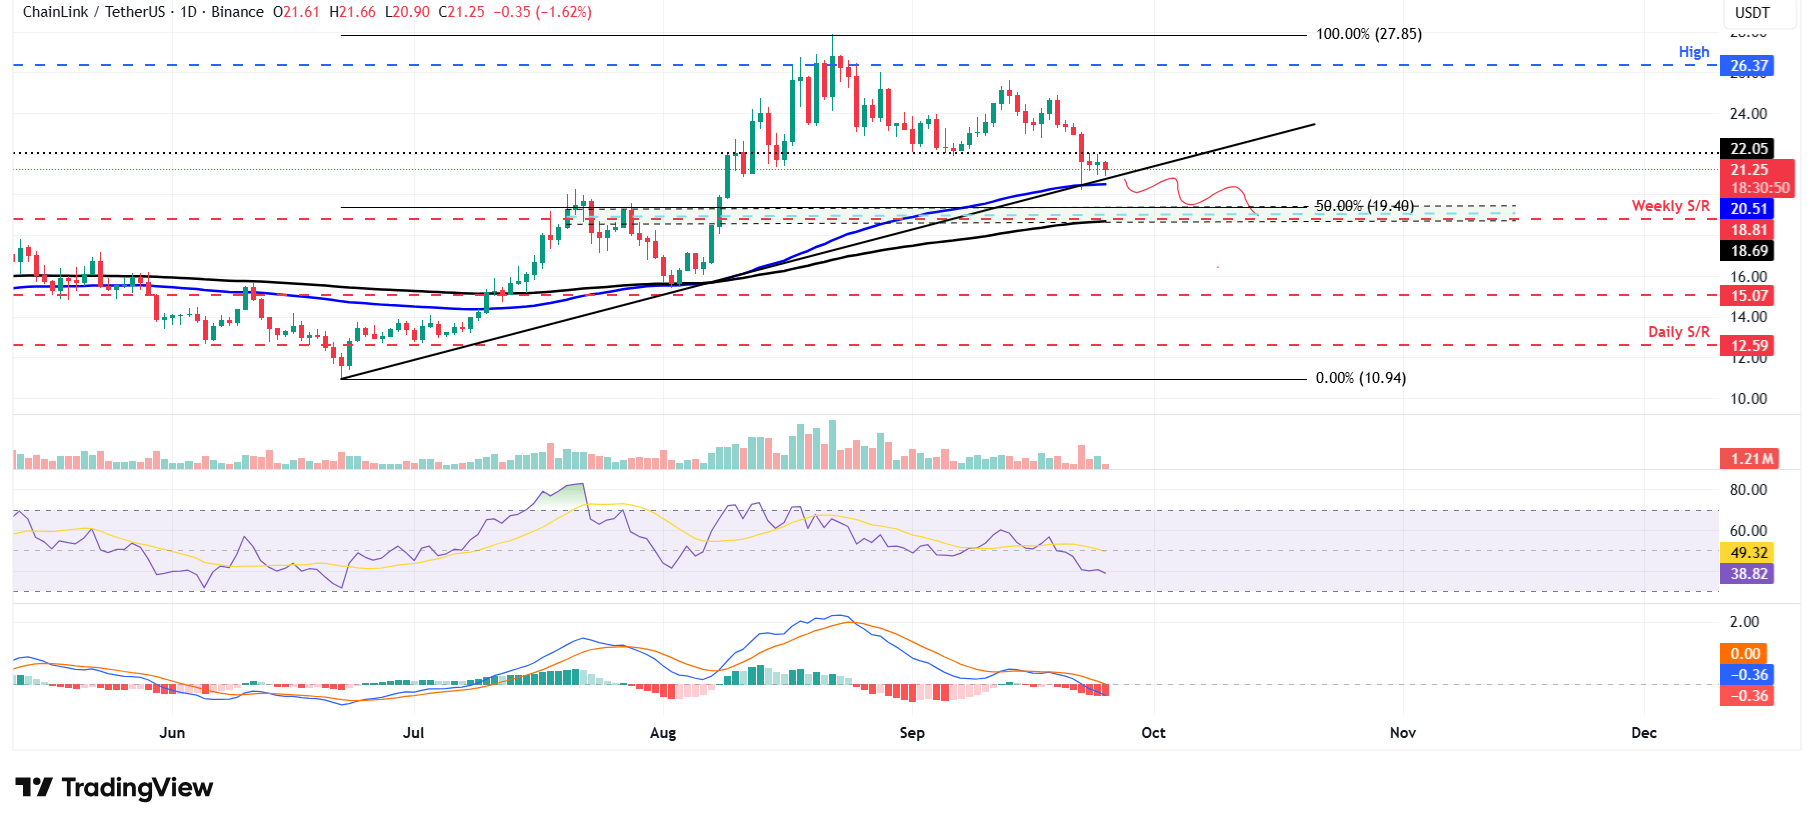
LINK/USDT daily chart
However, if LINK finds support around the 100-day EMA at $20.51 and recovers, it could extend the recovery toward the daily resistance at $22.05.

Acuity Trading
Acuity Trading 是一家成立於 2013 年、總部位於倫敦的金融科技公司,專注於 AI 驅動的另類數據與情緒分析,用於交易與投資。他們以可視化新聞與情緒工具革新線上交易體驗,並持續以最新 AI 研究與技術提供可產生阿爾法的另類數據與高度互動的交易工具。
Read More


