
Crypto Today: Bitcoin, Ethereum, XRP rebound capped amid low retail activity
作者 John Isige
發布日期: 28 Nov 2025 | 修改日期: 28 Nov 2025


熱門文章

Bitcoin (BTC), Ethereum (ETH) and Ripple (XRP) are struggling to sustain their recovery on Friday, reflecting a sticky bearish sentiment.
- Bitcoin holds $91,000 as bulls struggle to extend recovery amid low retail interest.
- Ethereum is trading above $3,000 but remains under pressure and below key moving averages.
- XRP builds on a MACD buy signal, holding above $2.21 on Friday.
Bitcoin (BTC), Ethereum (ETH) and Ripple (XRP) are struggling to sustain their recovery on Friday, reflecting a sticky bearish sentiment. Since the October 10 flash crash, which liquidated over $19 billion in crypto assets in a single day, retail interest in crypto assets has been significantly suppressed.
Unsteady inflows into crypto Exchange Traded Funds (ETFs), particularly for products related to Bitcoin and Ethereum, suggest that institutional investors are actively staying on the sidelines.
The next two weeks, before the December Federal Reserve (Fed) monetary policy meeting, will help gauge sentiment and provide insight into the direction the crypto market would take ahead of 2026.
As of Friday, Bitcoin holds above $91,000, Ethereum above $3,000, and XRP above $2.21, all of which highlight key short-term support levels.
Data spotlight: Bitcoin, Ethereum, XRP struggle amid weak retail interest
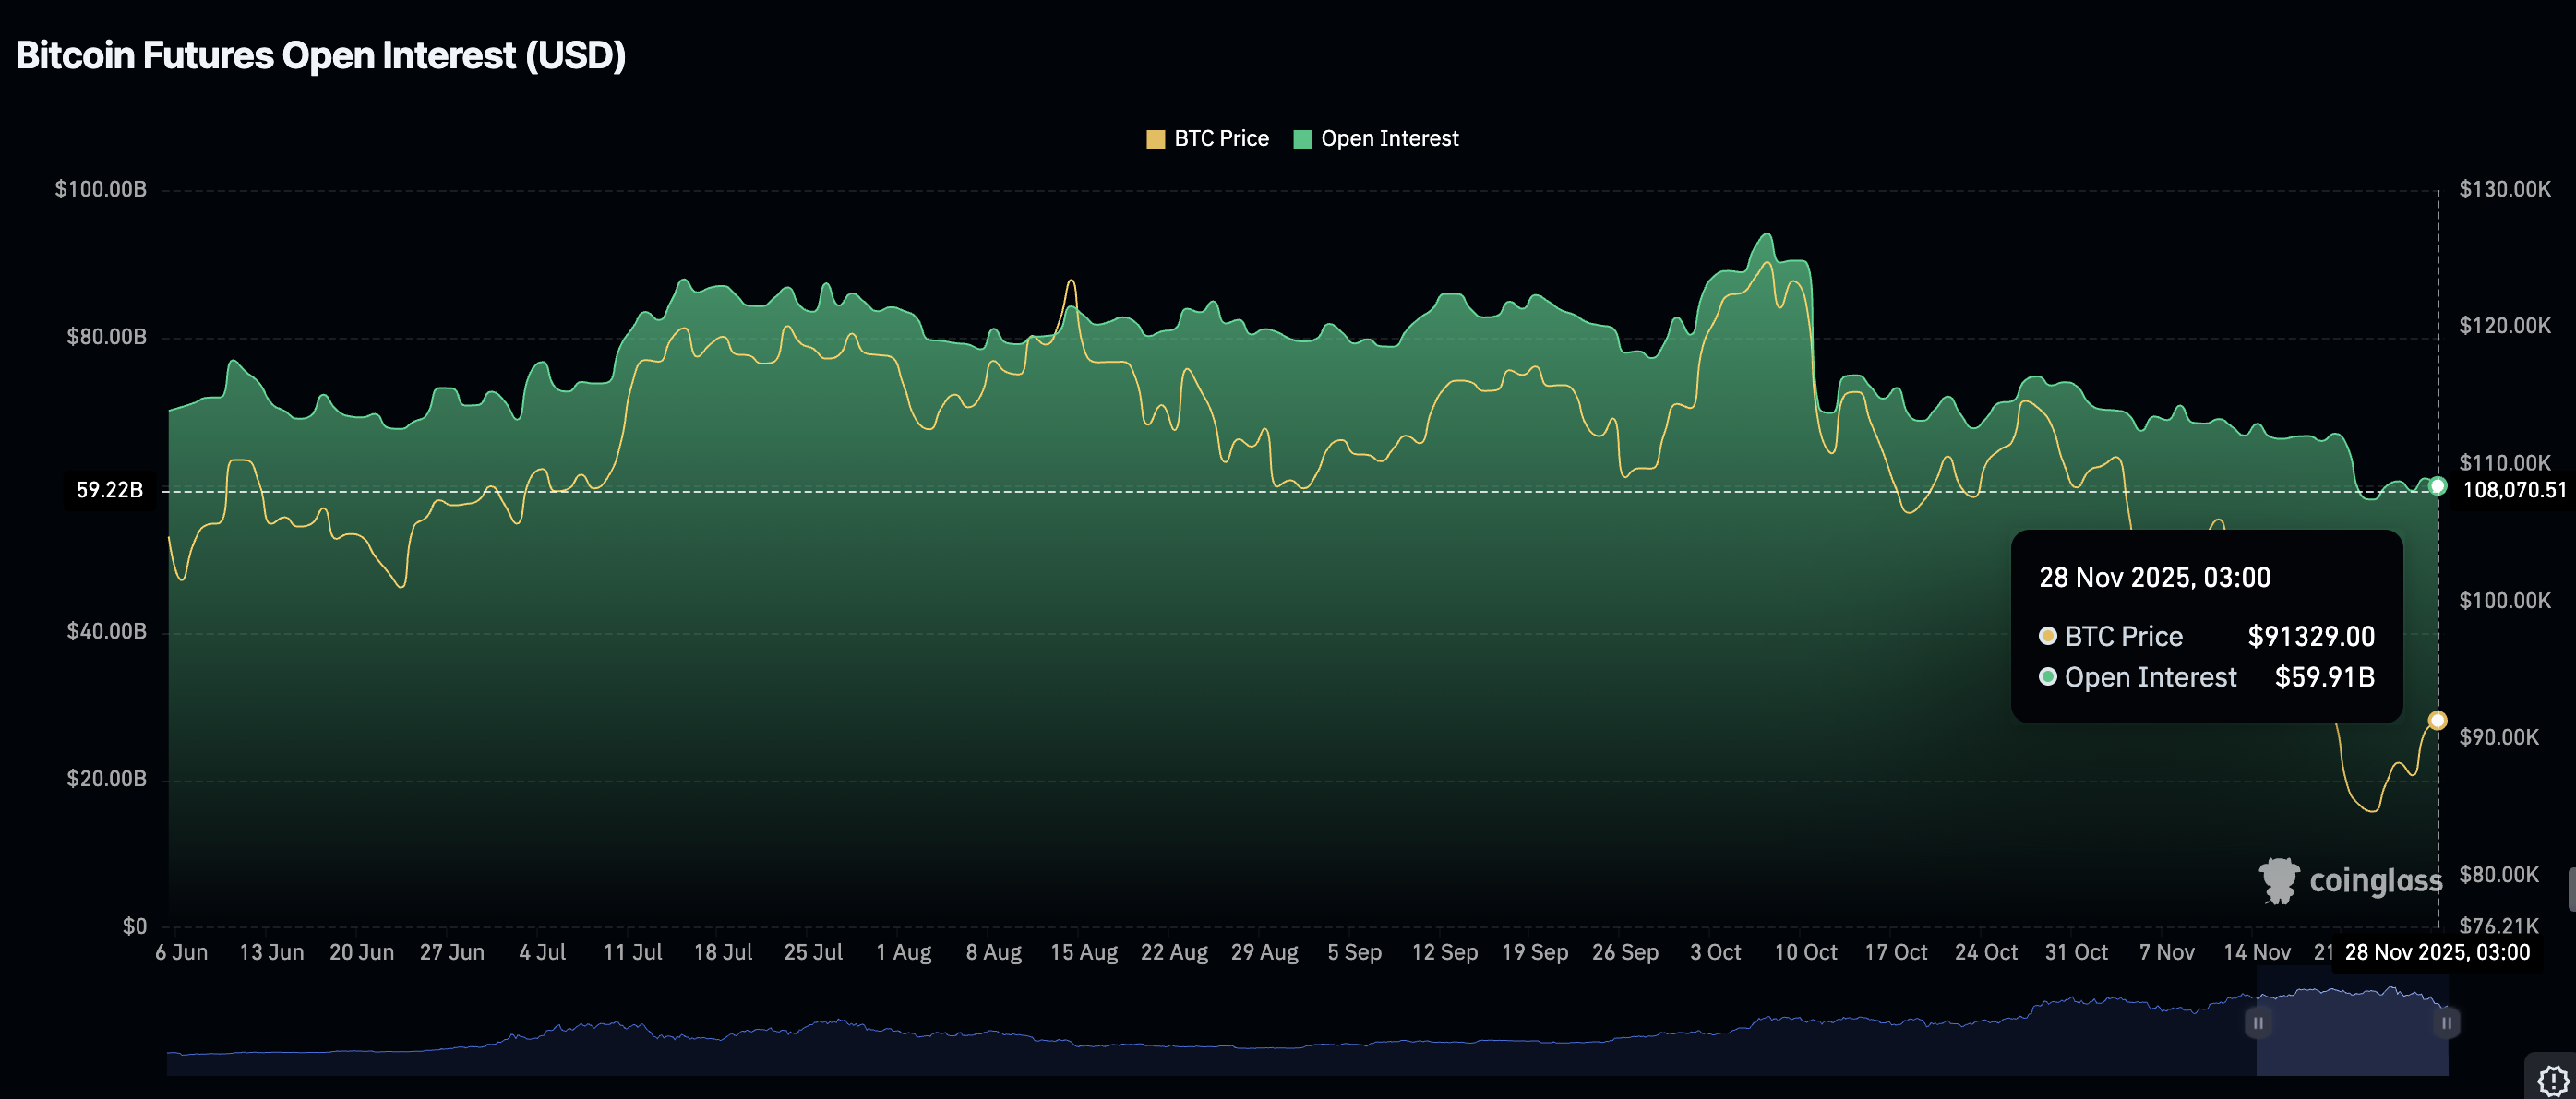
The Bitcoin derivatives market has not picked up since the October 10 crash, as evidenced by futures Open Interest (OI) averaging $60 billion on Friday, down from $65 billion on November 21, $71 billion on November 1 and the record high of $94 billion, reached on October 7.
OI tracks the notional value of outstanding futures contracts, whereby a steady increase would support Bitcoin’s bullish outlook and investor confidence. However, if OI remains suppressed in the coming weeks, it will be difficult to support recovery, making BTC vulnerable to headwinds.
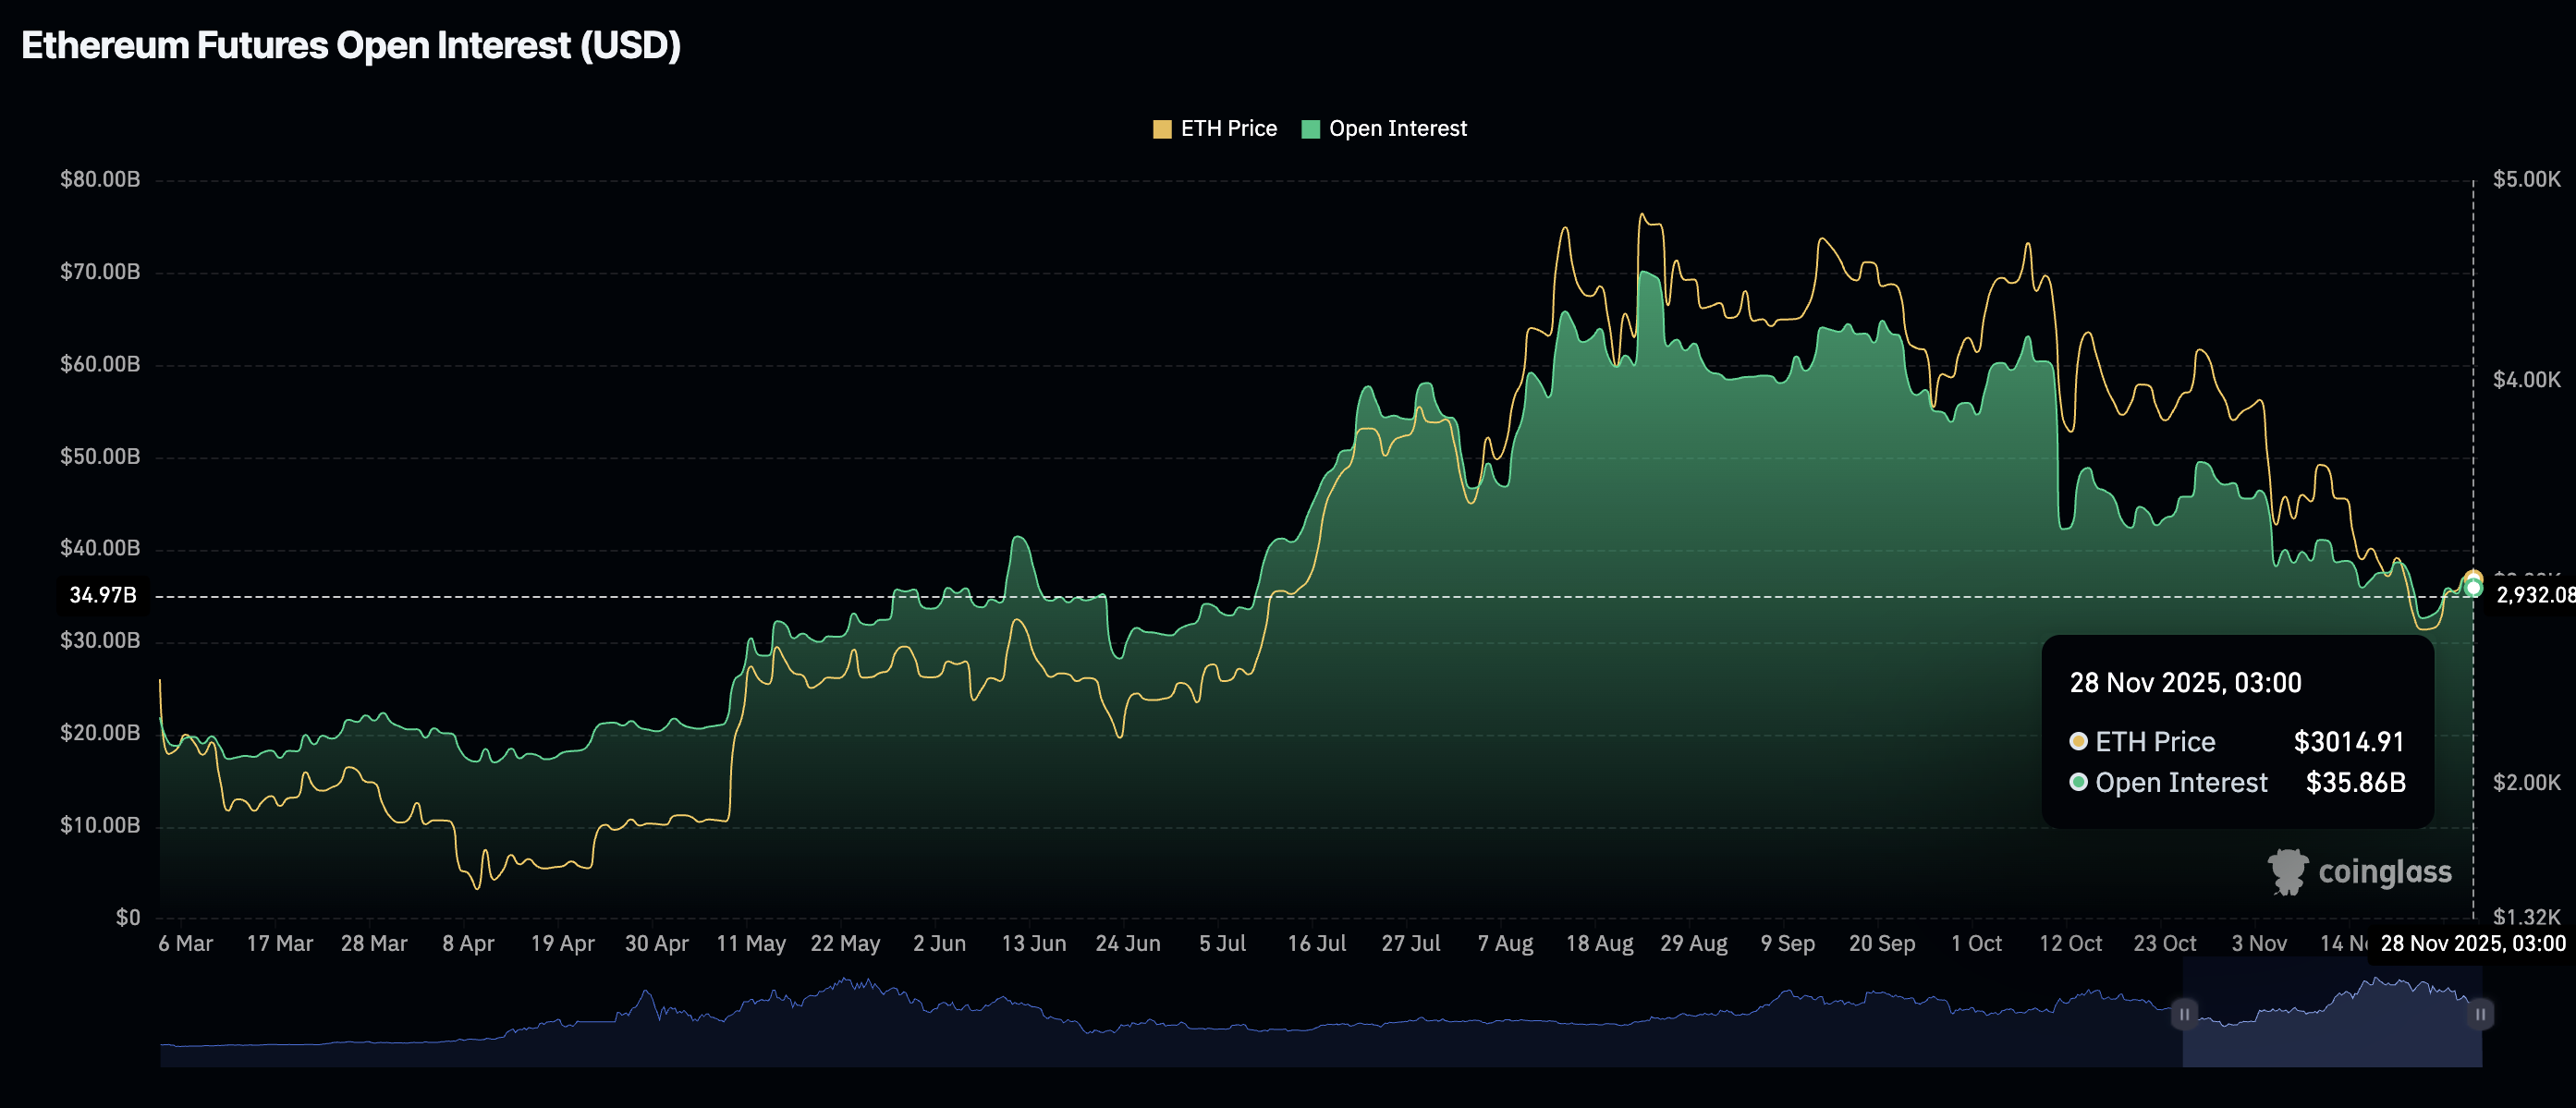
Retail interest in Ethereum derivatives paints a similar picture to Bitcoin, with futures near $36 billion as of Friday. It has been increasingly difficult to sustain recovery since OI began correcting from its record high of $70 billion, achieved in late August. With Ethereum holding above $3,000 short-term support, interest in the smart contracts token must steadily rise to support its recovery toward $4,000.
The XRP derivatives market is also on the back foot, with futures OI at $4 billion this Friday, more than halfway below the $8.36 billion on October 10 and the $10.94 billion, which marked the record high on July 22.
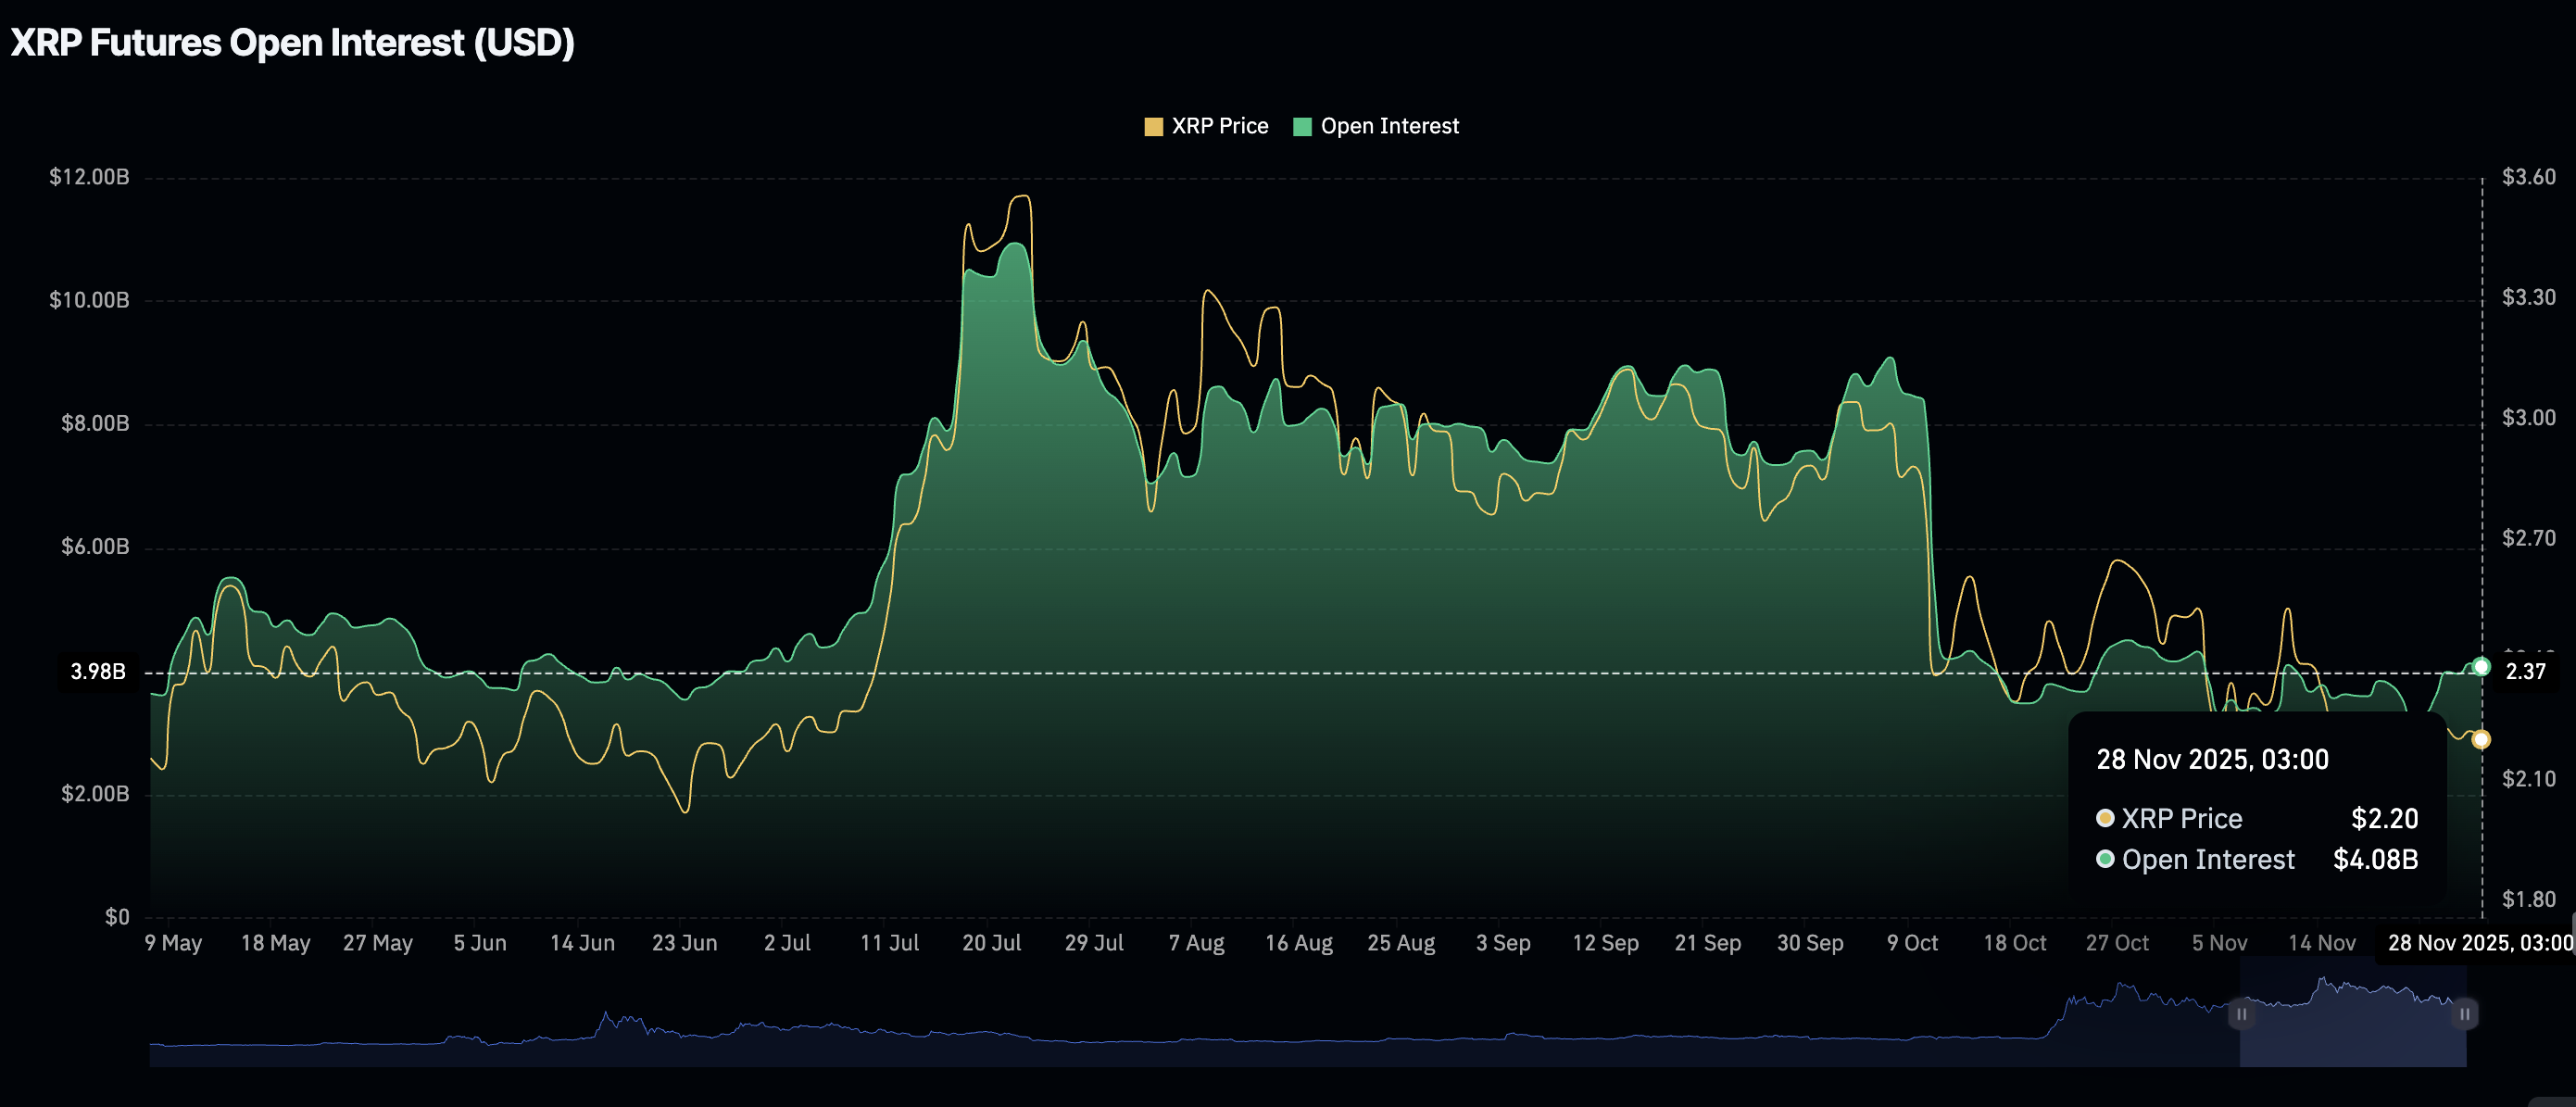
Chart of the day: Bitcoin holds key support
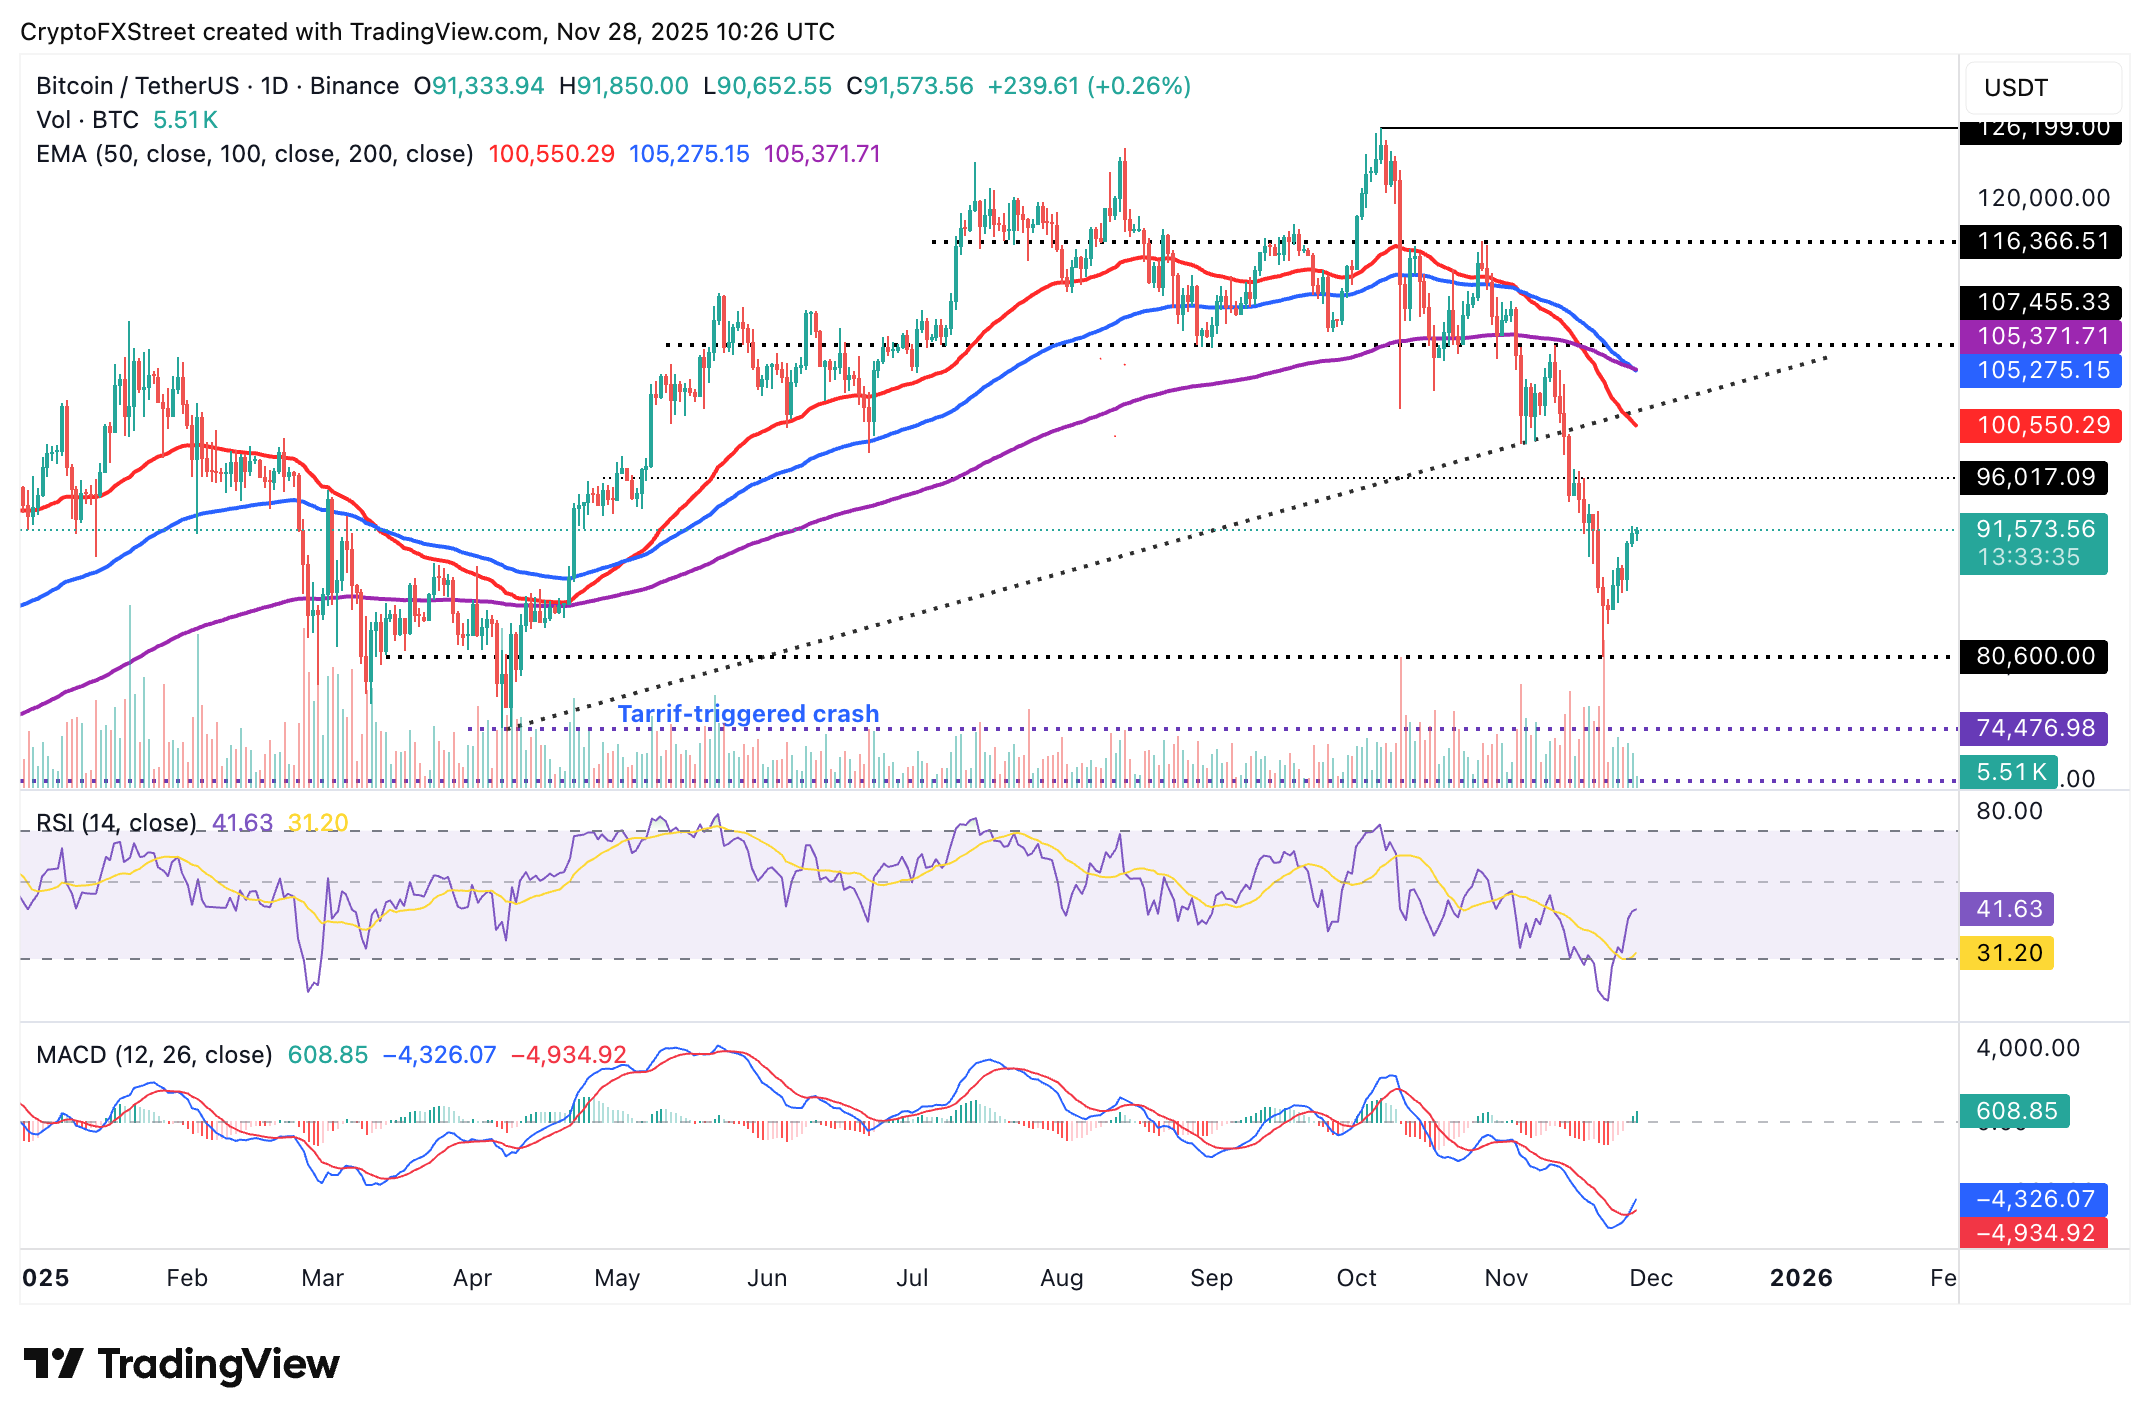
Bitcoin is trading above $91,000 at the time of writing on Friday, as bulls push to maintain control and steady recovery toward $100,000. The Relative Strength Index (RSI) is at 41 on the daily chart and rising, indicating easing bearish momentum. Investors will likely continue to increase their risk exposure underpinned by a buy signal from the Moving Average Convergence Divergence (MACD) indicator.
Still, Bitcoin is trading under pressure below the 50-day Exponential Moving Average (EMA) at $100,550, and the confluence resistance established by the 100- and 200-day EMAs at $105,275-$105,371.
A reversal below $90,000 could accelerate selling pressure and increase the chances of Bitcoin sweeping liquidity near support at $80,000.
Altcoins update: Ethereum, XRP hold steady
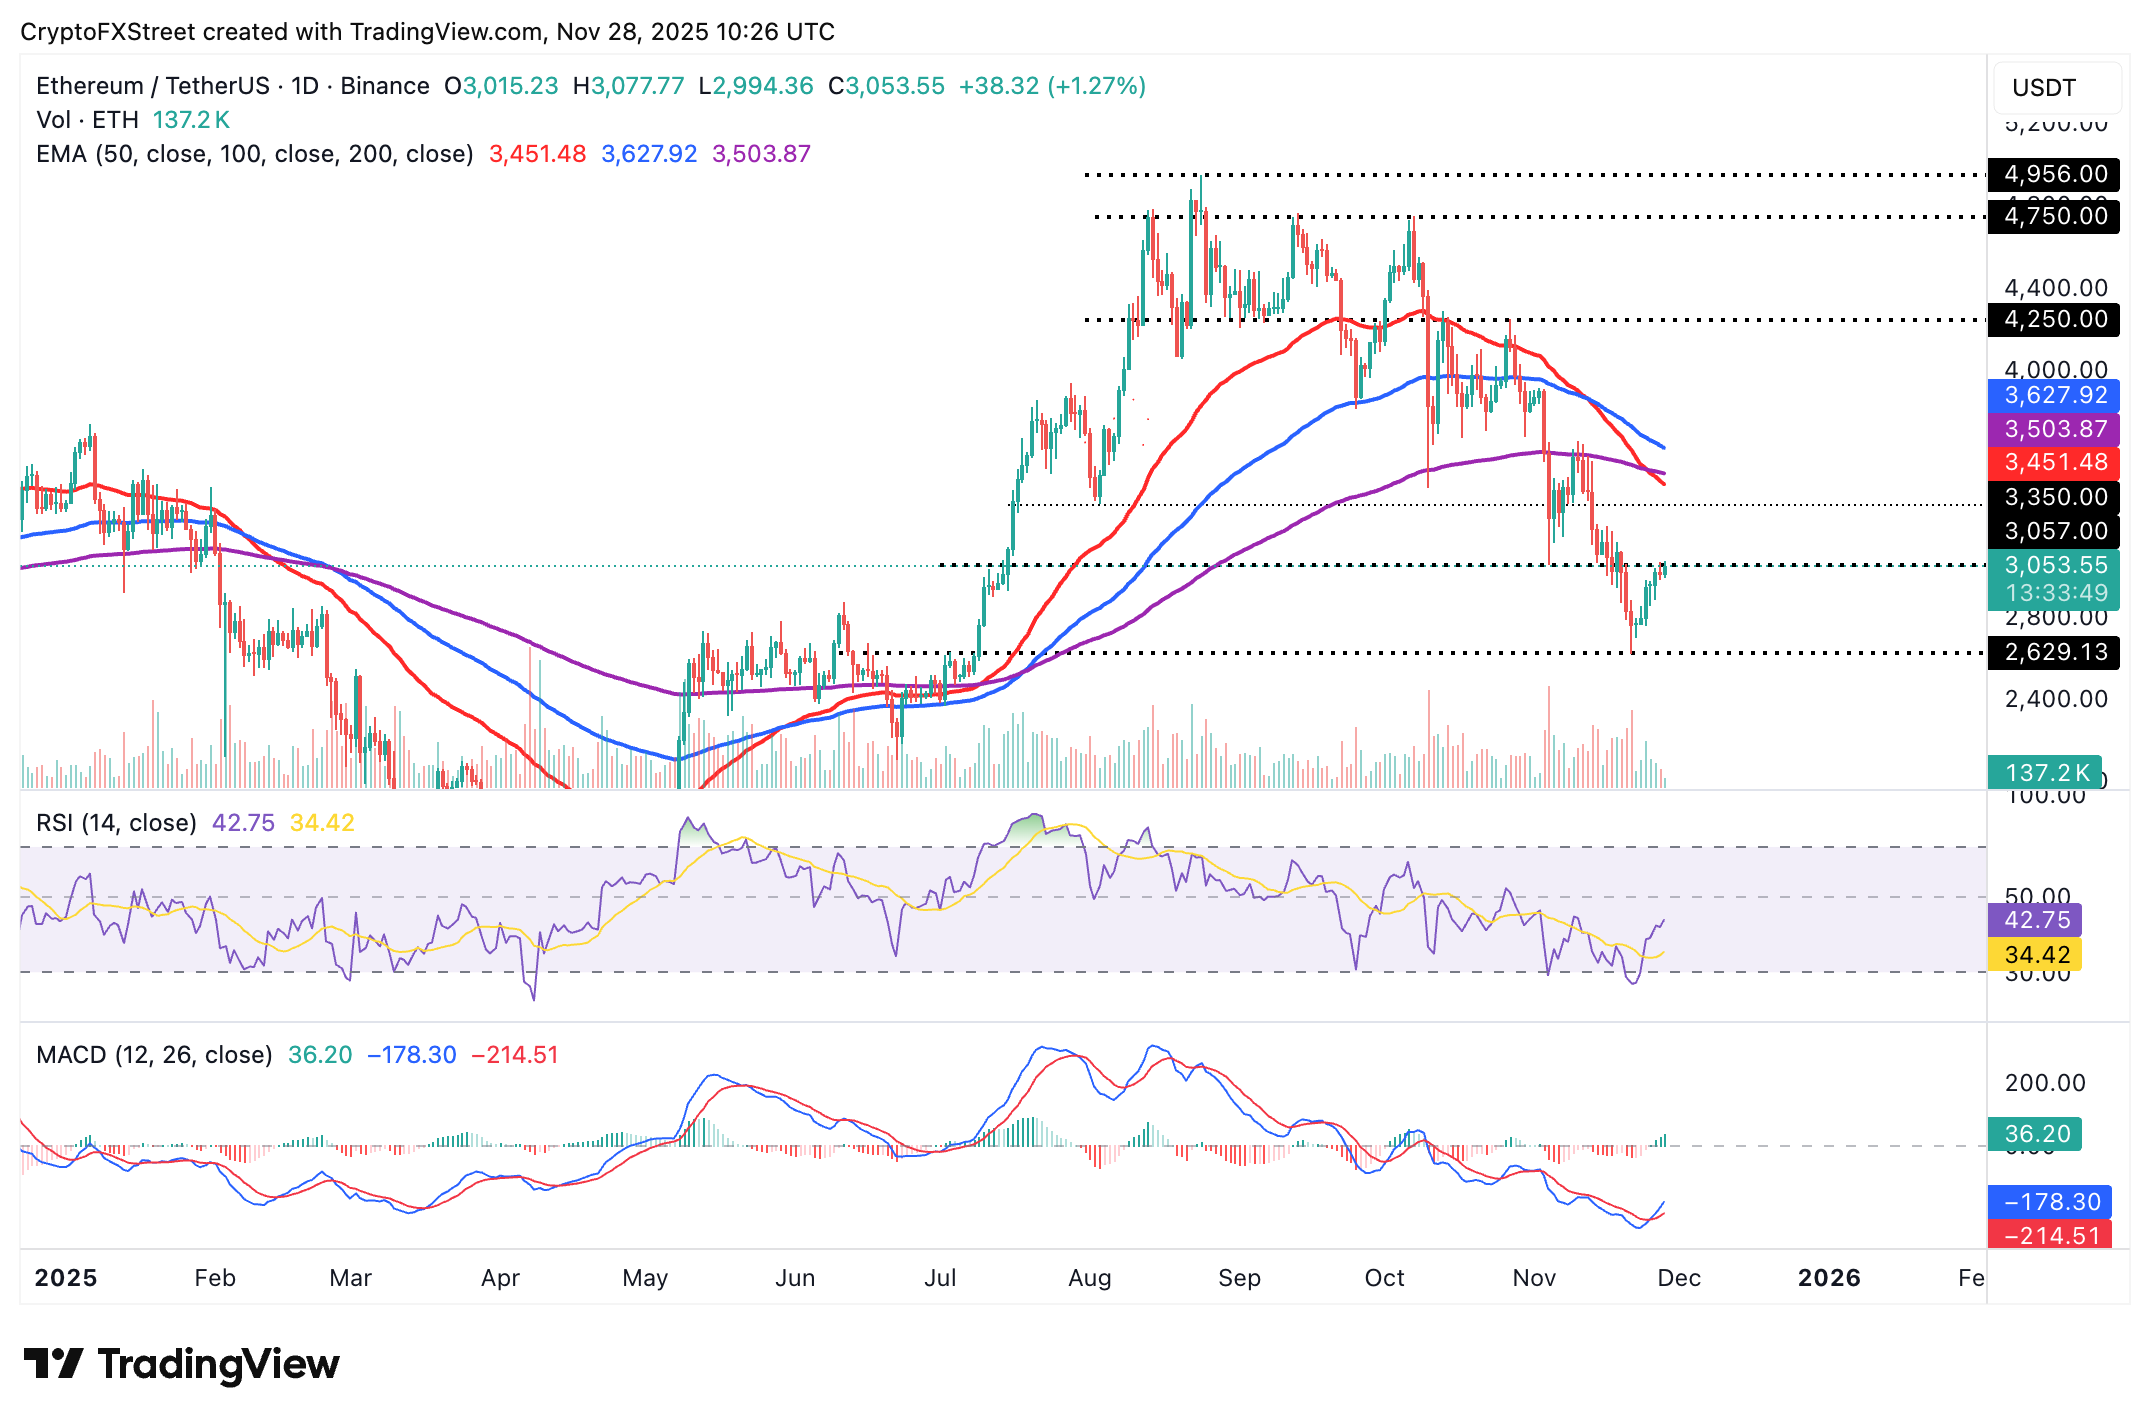
Ethereum is holding above $3,000 at the time of writing on Friday, as bulls push to shape the trend going forward. The RSI has risen to 42 from the oversold region on the daily chart, indicating that bearish momentum is narrowing and that ETH bulls could push toward the 50-day EMA at $3,451.
At the same time, the MACD indicator triggered a buy signal on Wednesday, encouraging investors to increase their risk exposure. A steady uptrend is required above the zero line to reinforce the bullish grip.
However, two Death Crosses on the same daily chart signal that the bearish outlook remains and may continue weighing Ethereum down. A Death Cross pattern forms when a shorter-term moving average crosses and settles below a longer-term moving average, as observed on the daily chart.
Despite support at $3,000, Ethereum remains at risk of resuming its decline toward support at $2,629, which was tested on November 21, unless the uptrend advances above the 50-day EMA at $3,451 and the 200-day EMA at $3,503.
As for XRP, the price holds below the descending 50-day EMA at $2.37, 100-day EMA at $2.51 and 200-day EMA at $2.52, which slope lower, capping rebounds. The MACD indicator's blue line on the daily chart has risen above the signal line, suggesting that bearish momentum is easing. At the same time, the RSI at 47 is neutral, tempering XRP's upside while it remains under the 50 midline.
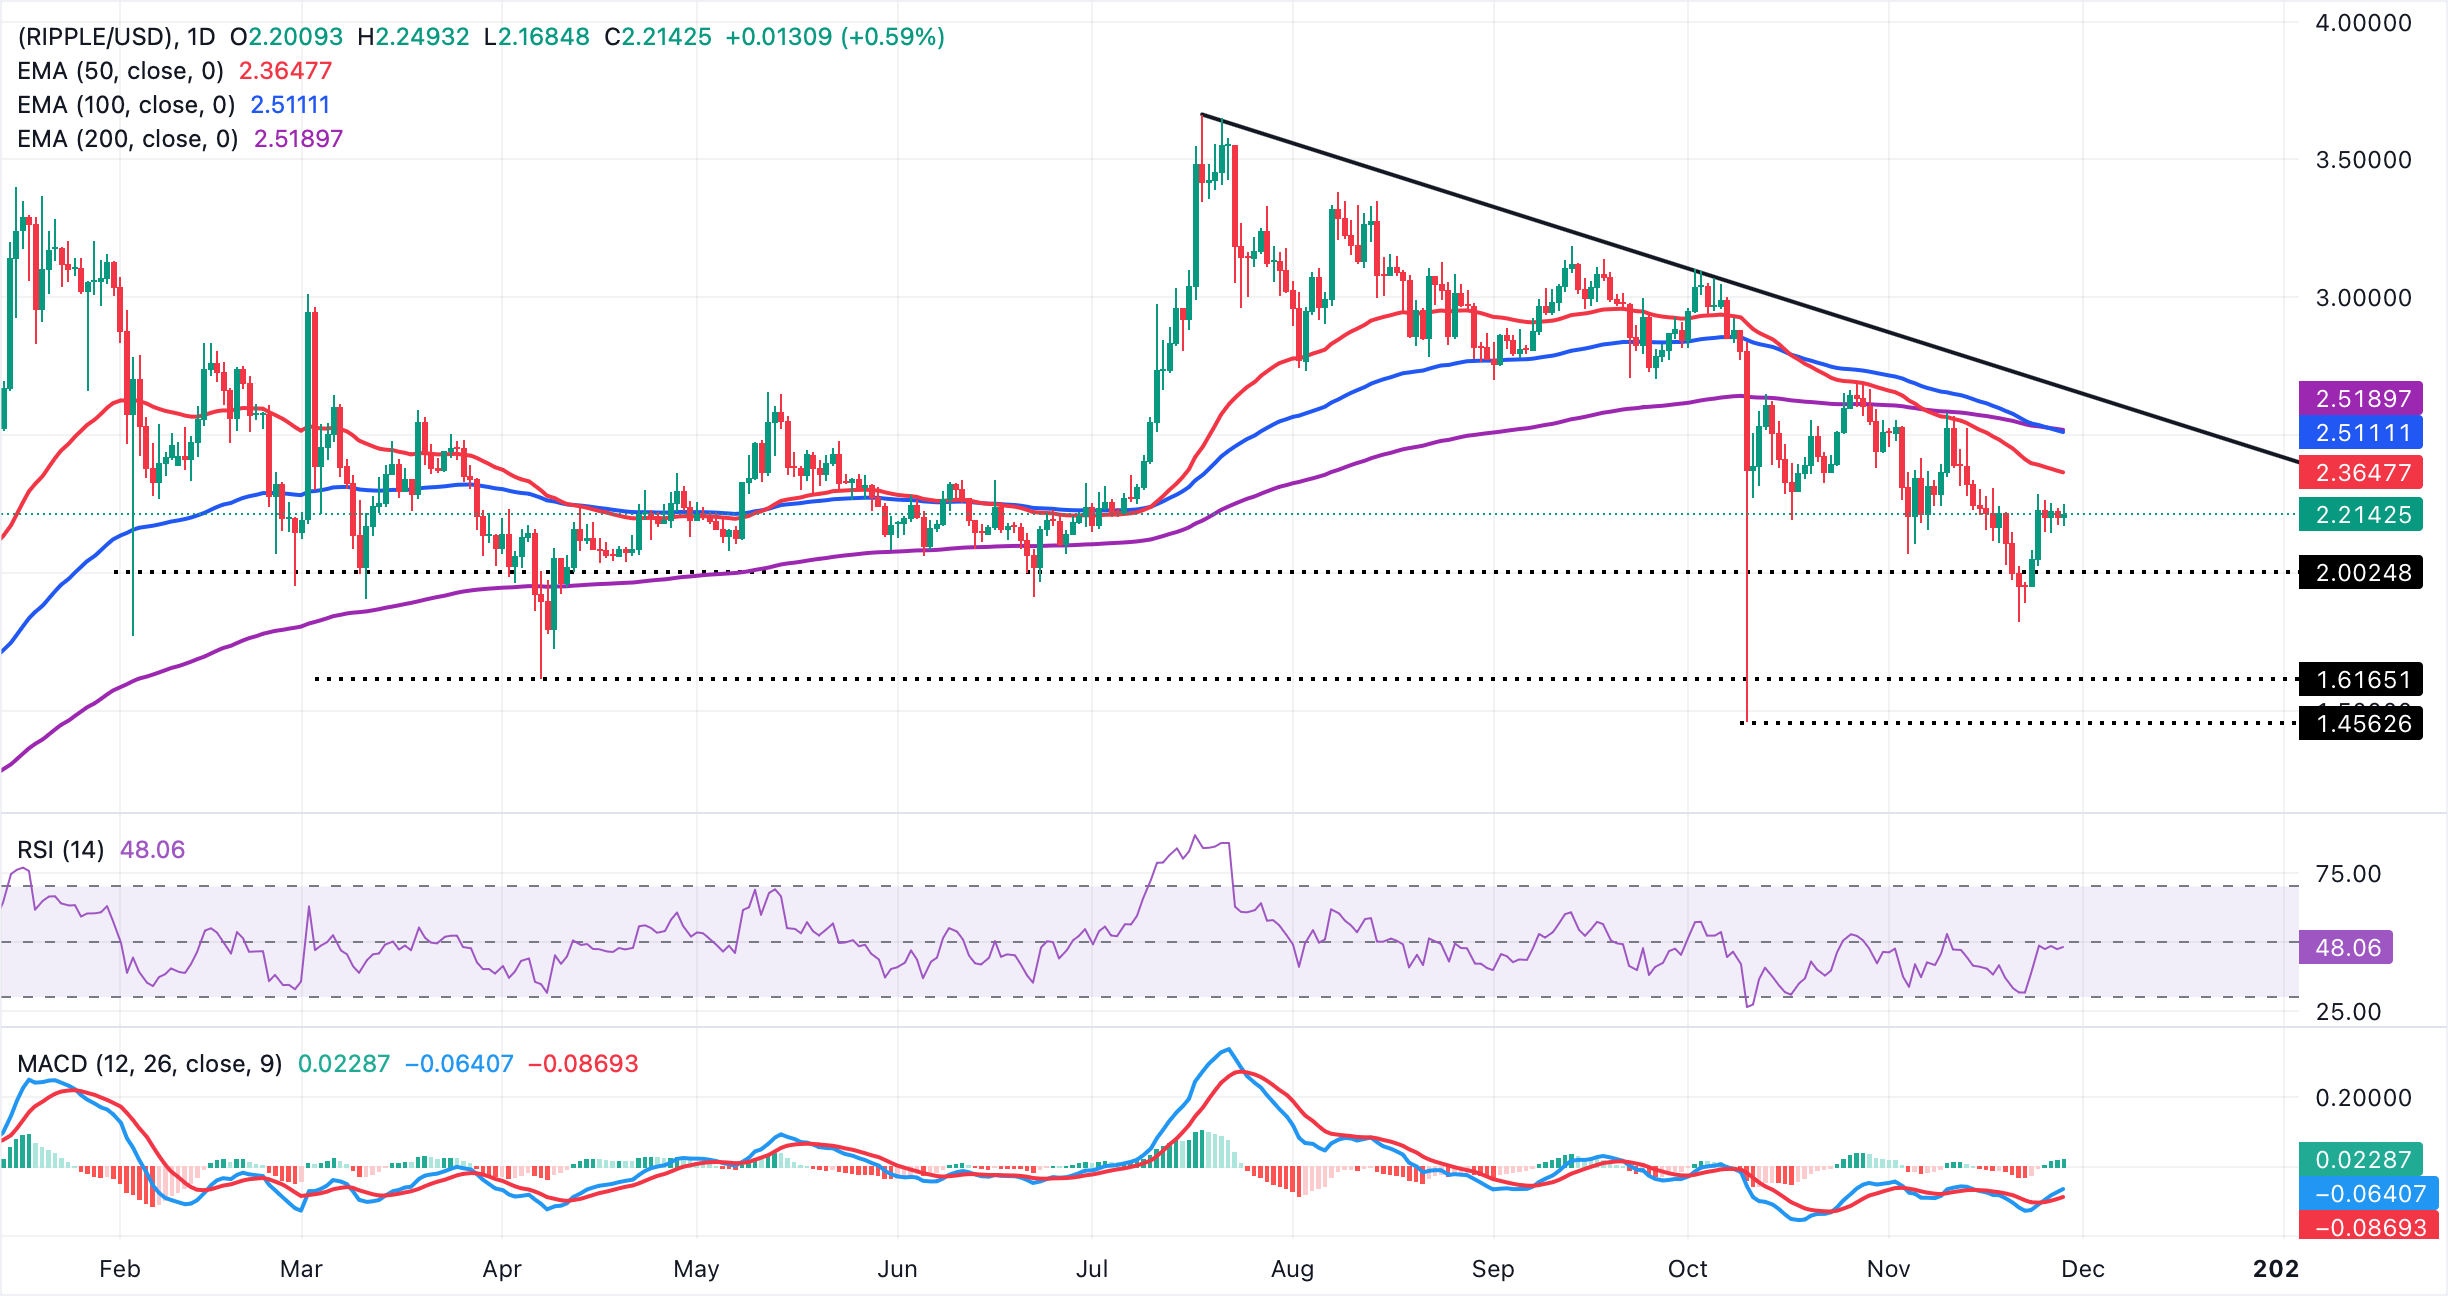
The descending trend line from $3.66 limits gains, with resistance seen at $2.66, a clearance would unlock a more meaningful recovery phase. While price trades beneath the SuperTrend ceiling at $2.40, rebounds would remain fragile and face supply on approaches to the EMA band. A sustained move through these overhead hurdles could shift the tone bullishly, otherwise the prevailing downtrend would stay intact.
Open Interest, funding rate FAQs
Higher Open Interest is associated with higher liquidity and new capital inflow to the market. This is considered the equivalent of increase in efficiency and the ongoing trend continues. When Open Interest decreases, it is considered a sign of liquidation in the market, investors are leaving and the overall demand for an asset is on a decline, fueling a bearish sentiment among investors.
Funding fees bridge the difference between spot prices and prices of futures contracts of an asset by increasing liquidation risks faced by traders. A consistently high and positive funding rate implies there is a bullish sentiment among market participants and there is an expectation of a price hike. A consistently negative funding rate for an asset implies a bearish sentiment, indicating that traders expect the cryptocurrency’s price to fall and a bearish trend reversal is likely to occur.
(The technical analysis of this story was written with the help of an AI tool.)

Acuity Trading 是一家成立於 2013 年、總部位於倫敦的金融科技公司,專注於 AI 驅動的另類數據與情緒分析,用於交易與投資。他們以可視化新聞與情緒工具革新線上交易體驗,並持續以最新 AI 研究與技術提供可產生阿爾法的另類數據與高度互動的交易工具。
閱讀更多


